Key points:
-
-
- Today’s article looks at running rates for growth in earnings and dividends in the 20 largest share markets in the world, as context for assessing over-pricing on traditional metrics like P/Es, div yields, and price/book ratios.
- The stand-outs are Sweden (Spotify), Netherlands (ASML), Japan (macro & micro reforms), and the US (strong earnings & dividend growth engine).
- The Aussie share market has done very poorly on earnings and dividend growth in recent years, not just relative to other countries, but in absolute terms.
- Why? Two words – Banks. Miners. Both sectors peaked a decade ago. Earnings and dividends per share have not even kept pace with inflation. Share prices have risen well head of earnings and dividends.
- The US market may appear very expensive on traditional metrics, but this is mostly underpinned by much stronger earnings and dividend growth.
- Personally, I focus not on share prices, but on underlying profitability of companies, sectors, and countries, as that is what drives my future wealth and living standards, not temporary share price gains.
This article is Part 5 in my 6-part series on share market pricing. The articles in this series are:
This series is designed to be read in sequential order, so readers may get more out of today’s article if they have already read the prior articles via the links above.
Also take a look at my explanation in Part 2 of why I do this stuff, and why it is important for long-term investors like me to understand pricing and how it affects subsequent returns and wealth.
Part 1 – painted the overall picture of relative pricing for the 20 largest stock markets in the world – most appeared very expensive, especially the US market.
Part 2 – went into more detail on 3 of the most widely used measures of pricing/valuation – trailing price/earnings ratios, dividend yields, and price-to-book values.
Part 3 – looked at two further measures – forward price/earnings ratios, and forecast earnings growth on which they were based. Here I suggested that, although the US market appears to be the most over-priced, it’s profit growth outlooks are probably more reasonable and achievable than Australia and most other markets.
Part 4 – looked at two key measures of corporate profitability for the same 20 share markets – profit margins and returns on equity. This also suggested that the US market was the most profitable and at least partially justified its higher apparent pricing.
Today’s article looks at the current trends and growth paths for profits and dividends in each market, in order to provide context for assessing the achievability of the profit growth assumptions embedded in current pricing (Part 3), and current market profitability (Part 4).
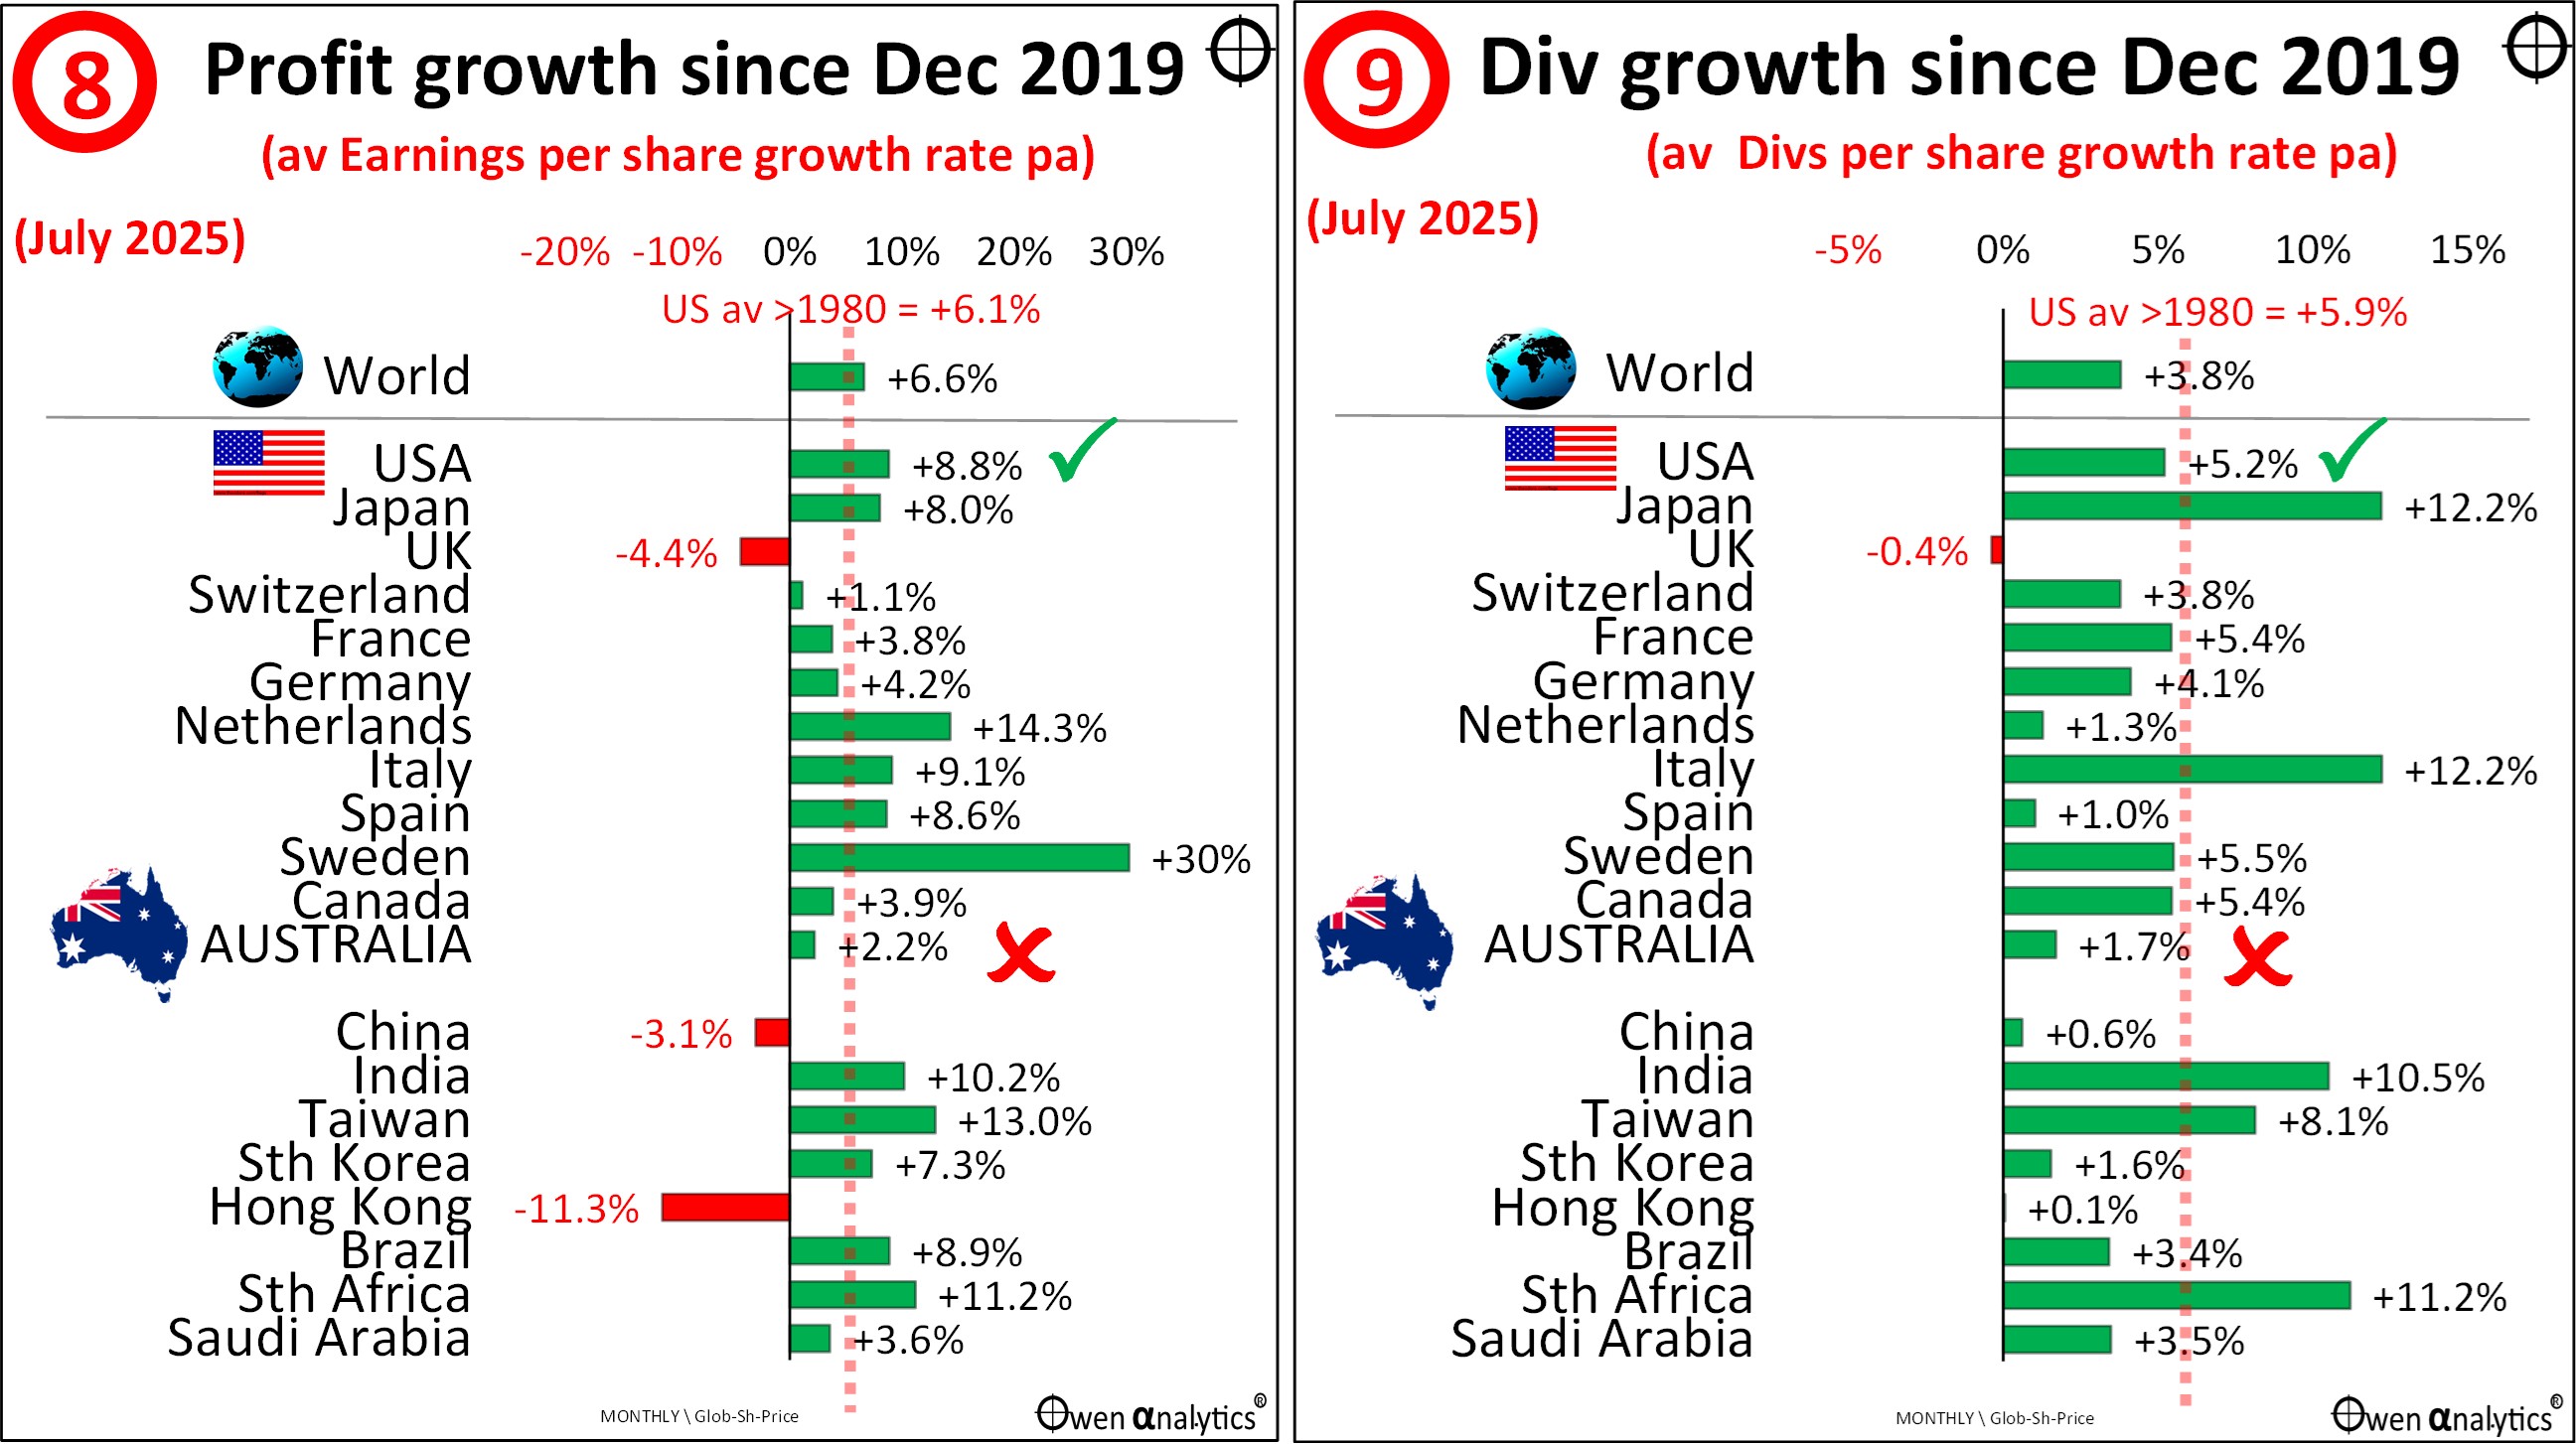
Charts 8 & 9 – Growth in Profits & Dividends per country
These charts show the average annual growth rates in aggregate earnings per share (‘profit’) and dividends per share in the same 20 major share markets and for the same period (to July 2020) used in the other Parts in this series of articles.
What period to measure growth in earnings & dividends?
I look at growth rates for earnings and dividends over different time periods for different purposes.
Growth rates over short periods like a year or two are useful when assessing things like rebounds from recessions or market shocks (like the Covid lockdowns), or reactions to rate cuts or rate hikes, or the impacts of tax changes (like Trump’s 2017 tax cuts).
At the other end of the time scale, I look at growth rates over much longer periods like a decade or several decades when assessing things like a country’s inherent competitive advantages or disadvantages, or long-term effects like resource depletion, demographics, changes in industry structure, or political regimes.
However, for this exercise I want to get a picture on each market’s medium-term growth ‘running rate’ that we can reasonably expect may be sustainable for the next few years, beyond short-term cyclical distortions.
For this purpose I would generally use growth rates over a five-year period. Why five years? The assumption is that if the earnings generating engine of a company or market has delivered a particular rate of earnings per share growth and dividend growth over the last five years, through all sorts of short-term effects (political / management regimes, interest rate cycles, commodities cycles, tax changes, etc), then there is a fairly good chance that this running rate of growth may be sustainably at similar sorts of rates for the next few years or so.
For today’s exercise, if I used a standard five year medium-term historical period to measure earnings and dividend growth rates, that would put the start point (July 2020) right in the middle of the big cuts to profits and dividends in the Covid lockdown crisis in 2020, and that would distort the picture significantly. Therefore, the above charts show average annual growth rates in earnings per share and dividends per share in each country over the period since the end of 2019, which is 5.5 years.
The critical assumption here is that the growth rate that the company market had achieved over the past five years is more or less sustainable into the future, at least in terms of ranking of different markets. After all, we are paying for future growth, not past growth. It is impossible to forecast the future of course, so this is best used as a relative tool for ranking different companies or markets, not a forecast tool.
This assumption of sustainability of medium-term growth rates can be upset by a host of shocks out of the blue of course (eg Covid, or Trump’s tariff tirade, etc), so this is not an absolute measure, but rather a useful way of ranking relative performance. Relatively low-growth companies, sectors and markets generally don’t suddenly become relatively high growth, or vice-versa (aside from short-term cyclical effects like recessions, etc).
Growth in earnings per share – chart 8
The stand-out countries on the profit growth chart are Sweden and Netherlands, which are two very concentrated markets – much more highly concentrated than the US share market.
Sweden’s high profit growth numbers are distorted by its largest company, Spotify, which finally posting profits in 2024-5 after many years of losses.
Netherlands’ high profit growth is distorted by its largest company, ASML, and its 250% total growth in profits since the end of 2019.
Growth in dividend per share – chart 9
The Japanese share market warrants special mention here for high its high rate of growth in aggregate dividends per share in recent years. There are two main drivers here. The first is the gains from the from the dramatic yen depreciation as part of the Abenomics program to trash depress the yen to help Japanese exporters. The yen has halved in value against the US dollar since the start of Abenomics, which has doubled the yen value per unit of exports.
The second reason for high dividend growth is the far-reaching reforms to Japanese corporate governance in the Abenomics era. This has been effective in dramatically lifting the focus on shareholder returns, unwinding cross-shareholdings, and increasing returns to shareholders, especially in dividend pay-outs. Dividend yields on the Japanese stock market (Nikkei 225) have risen from 0.4% in the 1980s, and 0.5% in the 1990s, to 1.0% in the 2000, then 1.8% in the 2010s, up to an average of 2.4% in the 2020s. This has been a one-off structural shift that was impossible to predict or model.
The fact that share markets like Japan can undergo such a dramatic structural transformation is a good reminder of the dangers of simply extrapolating the past into the future. The past is not a bad guide to the future in most cases, but it is not a forecast, and notable exceptions like Japan do come along every now and then.
USA growth in earnings and dividends
The stand-out share market in terms of overall aggregate growth in earnings and dividends in recent years has been the US.
US companies have grown their aggregate earnings per share by an average of 8.8% per year since the start of 2020. This is more than 4% above US inflation for the period, and it is ahead of the 6.1% pa average US EPS growth rate since 1980, and 6.2% pa average since 1950.
On dividends - US companies have also grown their dividends per share by an average of 5.2% per year since the start of 2020. This is also more than US inflation, and not far below the US average DPS growth rate of 5.9% pa since 1980, and 5.7% since 1950. (Over the past 20 years, US companies on the whole have paid out more in buy-backs than dividends, in order to boost earnings per share),
Bottom line - US companies are just doing what they have done for the past 4 decades or so – they keep churning out above-inflation growth in profits and dividends, through all sorts of economic and political conditions.
Australia
The ASX market has done very poorly on both profit growth and dividend growth in recent years, not just in relative terms compared to other countries, but in absolute terms as well.
Australian earnings per share and dividends per share have grown at rates well below CPI inflation (which has averaged 4.5% pa over the period in Australia) – ie they have gone backwards in real terms since the start of 2020. That’s a long time for negative real growth in earnings and dividends per share.
ASX profit growth rates for earnings and dividends have been a fraction of US growth rates, and the US has had almost the same level of inflation over the period.
Why the poor growth rates for profits and dividends for the ASX market?
Two words – Banks. Miners. The two largest sectors of the ASX market have popped up repeatedly as culprits in other articles in this series.
The big-4 Aussie banks peaked in 2015, and have delivered negative real growth in earnings and dividends per share since then. CBA’s share price has risen strongly, but it has not been underpinned by growth in earnings per share or dividends per share, which have not even kept pace with inflation.
For a deep dive into CBA performance and fundamentals, see:
The mining sector (mainly iron ore and gas) also peaked in the mid-2010s at the top of the post-GFC China stimulus boom, which collapsed in 2014-5, and has not recovered since then. Weak demand and over-supply also extend to other segments like copper and lithium.
The only bright spot for miners has been gold, but the gold segment’s impact on the local market index was reduced significantly after Newcrest was taken over by Newmont (US) in 2023.
Aside from the big banks and miners, the rest of the ASX market is dominated by low-growth, mostly domestic-constrained companies like Woolworths, Coles, Telstra, Goodman, Scentre, Transurban, Qantas, ASX, and the like. Despite their domestic constraints, some of them are well-run (ok, one of them).
The ASX does have some globally relevant players like CSL, Wisetech, Worley, Reece - but their impact on the overall market is relatively minor, and most of them have also run into problems of their own making.
Australia -v- USA
The next two charts highlight the stark differences between the US and Australian share markets in terms of their growth in earnings and dividends.
First the US market (S&P500) since 1990 –
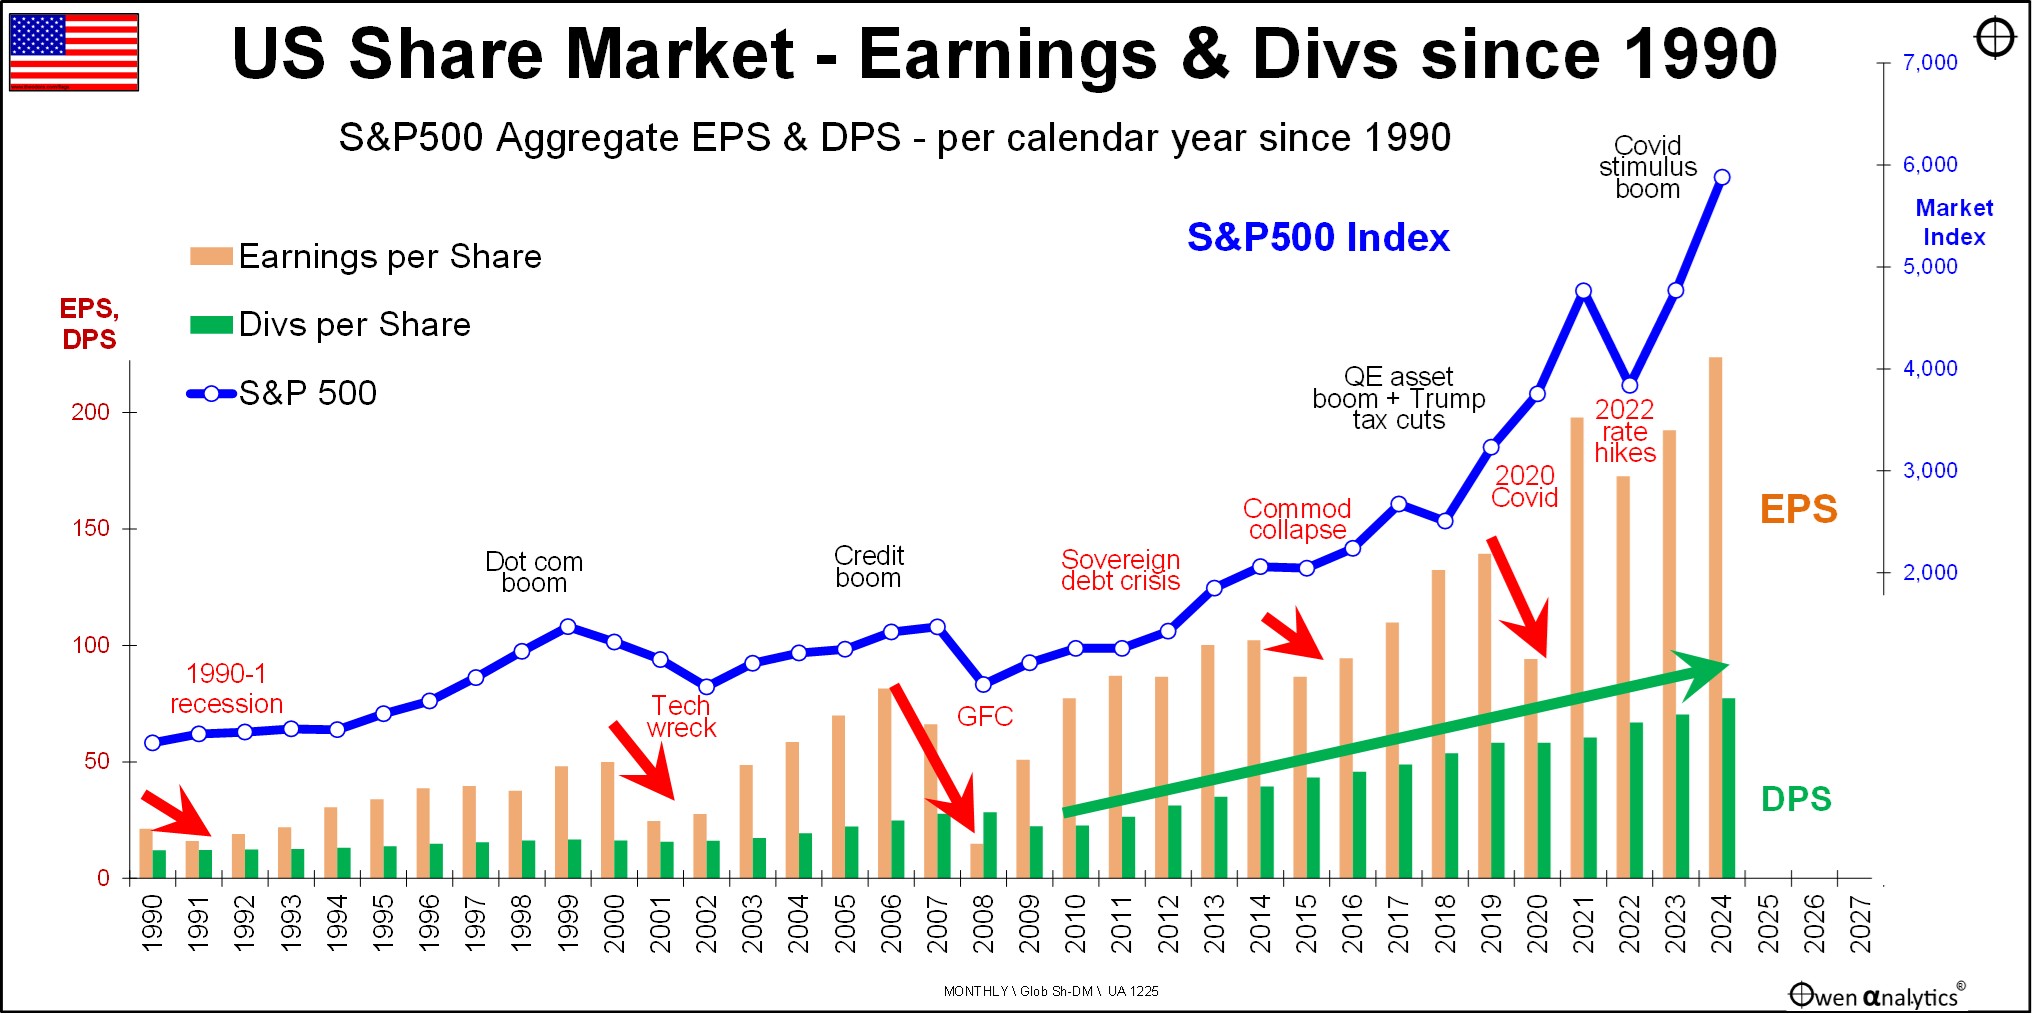
Here we see the strongly rising S&P500 index (blue line) supported by strongly rising earnings per share (orange bars) and also strongly rising dividends per share (green bars).
Since 1990:
-
-
- US aggregate earnings per share have grown by an average of 6.6% pa
- US aggregate dividends per share have grown by an average of 5.6% pa
- US S&P price index has grown by an average of 8.5% pa
- The price index has grown strongly, mostly underpinned by growth in earnings and dividends.
Here is the same picture for Australia since 1990 –
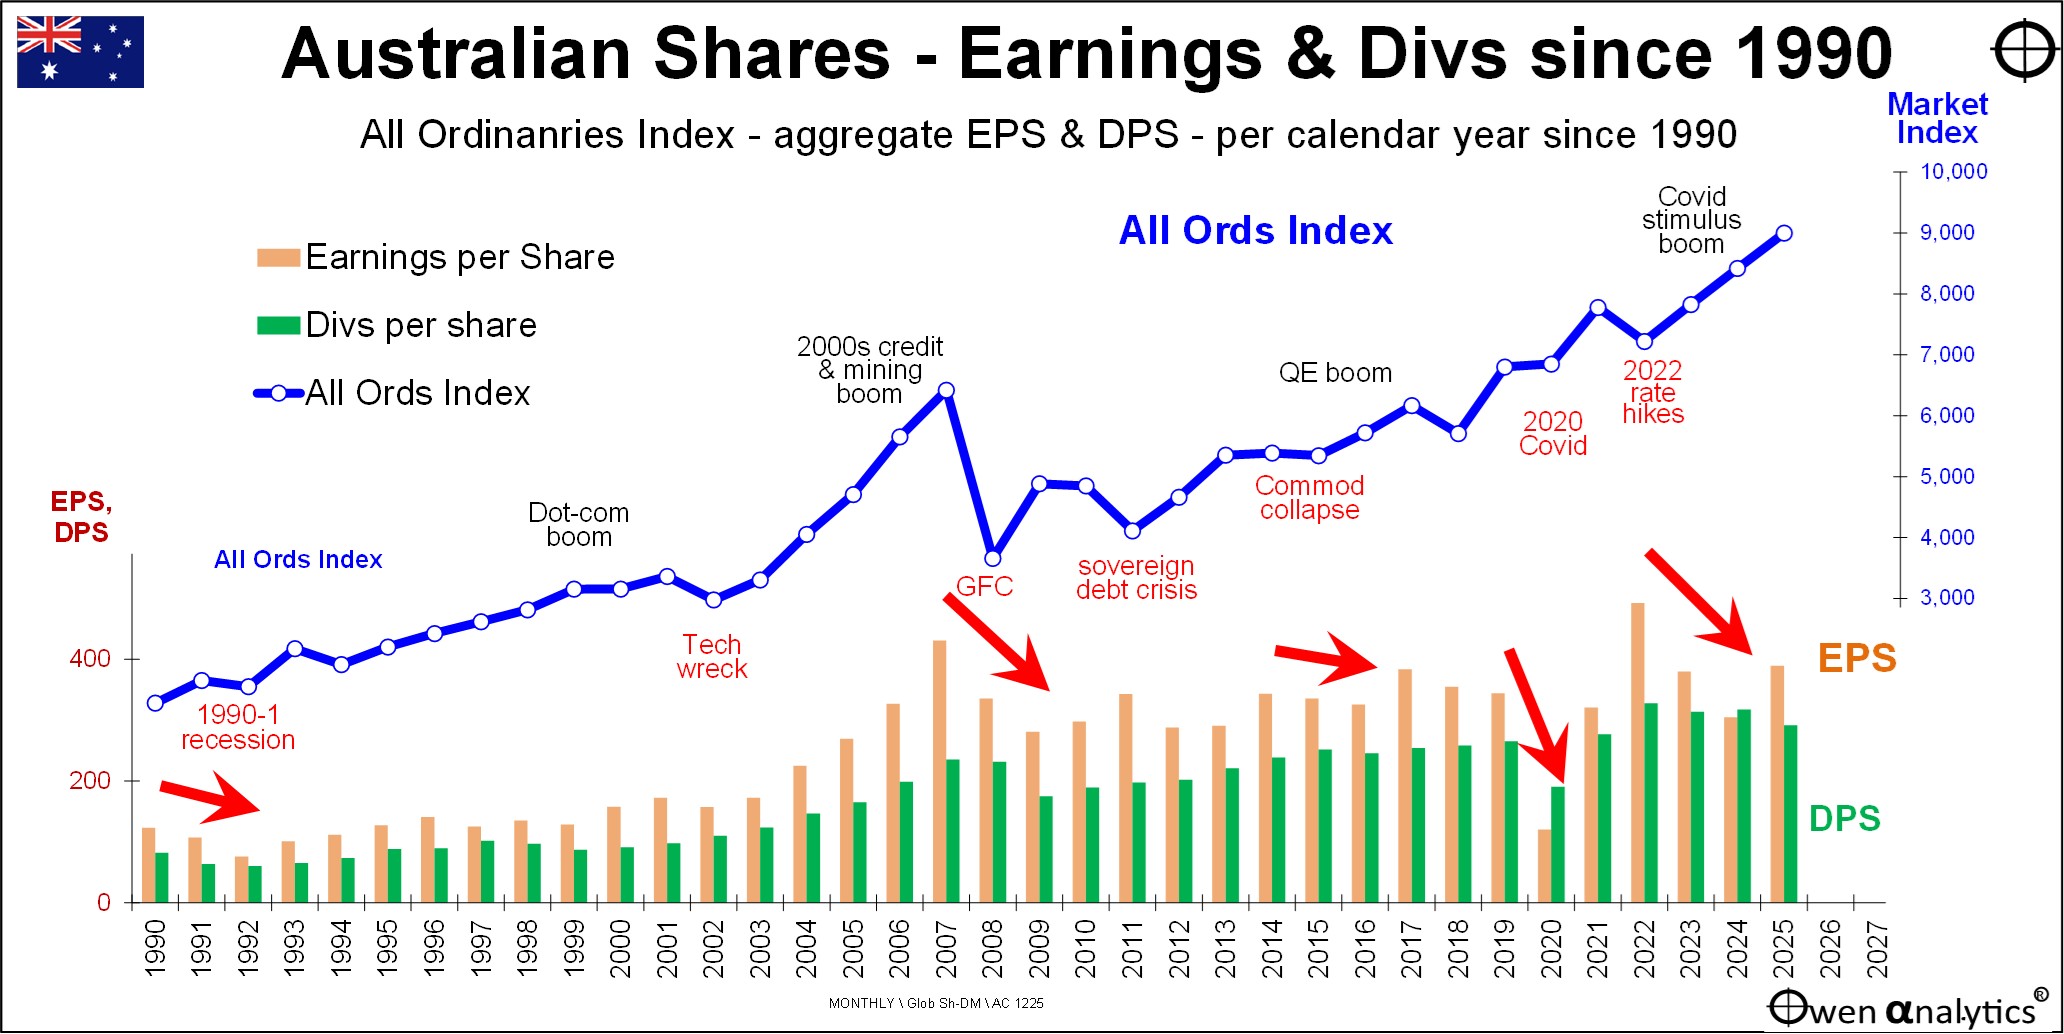
The price index (blue line) has also risen over the period, but at a much lower rate than the US, because of much weaker growth in aggregate earnings per share (orange bars), and also much weaker growth in dividends per share (green bars).
Current aggregate earnings per share in Australia are still below where they were in 2007 – and that’s before inflation!
Aggregate dividends per share in Australia are now only just above where they were in 2007 before inflation, and well below after inflation.
Since 1990:
-
-
- ASX aggregate earnings per share have grown by an average of 2.8%% pa (-v- 6.6% pa in the US)
- ASX aggregate dividends per share have grown by an average of 3.3% pa (-v- 5.6% in the US)
- The All Ords price index has grown by an average of 4.9% pa (-v- 8.5% pa for the US S&P500)
- So the All Ords index has also risen well ahead of earnings and dividends.
Bottom line - The Australian market has been much weaker than the US market over the period because ASX earnings and dividends have been much weaker than in the US.
Why? Because Australian companies in aggregate generate much lower returns on equity than US companies in aggregate, and this has been the case for several decades – see my Part 4 story.
The Australian share market will overtake the US market once again, as it has done several times in the past, but it’s not ‘our turn’ yet. See -
My personal focus?
On a personal note – I live off dividends, and these come from profits. I am not particularly interested in share prices because they jump around every minute of every day for all sorts of irrelevant reasons. (And, no, I don’t chase high dividend yield shares, because they are inevitably low-profitability, low-growth companies.)
When analysing companies, most people look first at the share price chart. They want to jump in on companies that have share prices that are going up – in the hope that they will keep going up.
For me, the share price chart is the last thing I look at. I focus first and foremost on the profit generating capacity of a company, or sector or country. That is what will drive share prices and dividends in the long run.
Summary
-
- Today’s article looks at running rates for growth in earnings and dividends in each market to provide a context for assessing apparent over-pricing on traditional metrics like P/Es, div yields, and price/book ratios.
- The stand-outs are Sweden (Spotify), Netherlands (ASML), Japan (macro & micro reforms), and the US (strong earnings & dividend growth engine).
- The Aussie share market has done very poorly on earnings and dividend growth in recent years, not just relative to other countries, but in absolute terms.
- Why? Two words – Banks. Miners. Both sectors peaked a decade ago. Earnings and dividends per share have not even kept pace with inflation. Share prices here have risen well head of earnings and dividends.
- The US market may appear very expensive on traditional metrics, but this is mostly underpinned by the much stronger earnings and dividend growth rates.
- Personally, I focus not on share prices, but on the underlying profitability of companies, sectors, and countries, as that is what drives my future wealth and living standards, not temporary share price gains.
In the final part in this series – Part 6 – I look at what at some approaches to the question of what is a reasonable price to pay for higher profitability and growth.
‘Till next time . . . . safe investing!
See other articles in this 6-part series -