- I am neither a buyer nor a seller, so why is CBA important?
- Why CBA is the ‘Steven Bradbury’ of the banking world?
- Its share price is soaring, but its fundamentals stalled a decade ago
- Here’s my quick take in 7 charts
CBA has been in the headlines of late for a few reasons – for re-taking the lead from BHP to be the largest ASX-listed company by market value, for being the most over-priced bank in the world, and also for having the most mysterious share price surge this year.
My main interest in CBA (aside from being a former shareholder), is that it will probably be a significant drag on the overall Australian share market in coming years. This is critical when deciding asset allocation in diversified long-term portfolios.
Even if investors, advisors, and portfolio managers have no interest in stock picking or stock valuation, they need to take a view on CBA, given its heavy weighting it the local share market, and its impact on overall portfolio returns.
CBA (along with CSL) was one of the greatest success stories from the early 1990s government privatisations of sleepy government departments, and it has made a lot of people a lot of money over the years (including me).
Unfortunately, all good things come to an end
This is not a bold new call from me – the turning point was in 2015, nearly a decade ago. (I am no longer a CBA shareholder). CBA and the rest of the ‘big-4’ retail banks peaked in 2015, and their underlying fundamentals have deteriorated significantly since then.
CBA’s share price may have soared, but the underlying business has stalled.
My worry is that people who benefited from CBA’s past growth are now expecting it to continue on the same upward trajectory and generate the same great returns in the future. In particular, many are hanging on to CBA in the hope that its dividends will continue to form the core of their retirement incomes.
My fear is they will be disappointed. Rather than lead the overall market, as it did up until 2015, CBA is likely to lag the market in future.
Quick background – CBA: the ‘Steven Bradbury’ of the big-4 retail banks
CBA was one of the great stars of the 1990s government privatisation program, which was a key part of the productivity-boosting Hawke/Keating reforms of the 1980s and early 1990s. (Just don’t mention that to Smiling Jim Charmer as he desperately tries to drag Australia back to the dark ages of the pre-reform era!)
CBA was a sleepy government department when it was sold off and floated in 1991. It was the least favoured and second smallest of the ‘big-4’ banks, but it is now by far the largest of the banks in terms of market value, profits and dividends.
How did this happen? Essentially, because the other three big banks did their best to blow themselves up!
CBA is thus the ‘Steven Bradbury’ of Australia’s big banks. It has done nothing spectacular - it just kept a steady, somewhat boring course (aside from the Hayne revelations of institutionalised greed that drove a dizzying array of unsavoury and unethical activities), but the others did a lot worse and tripped over themselves.
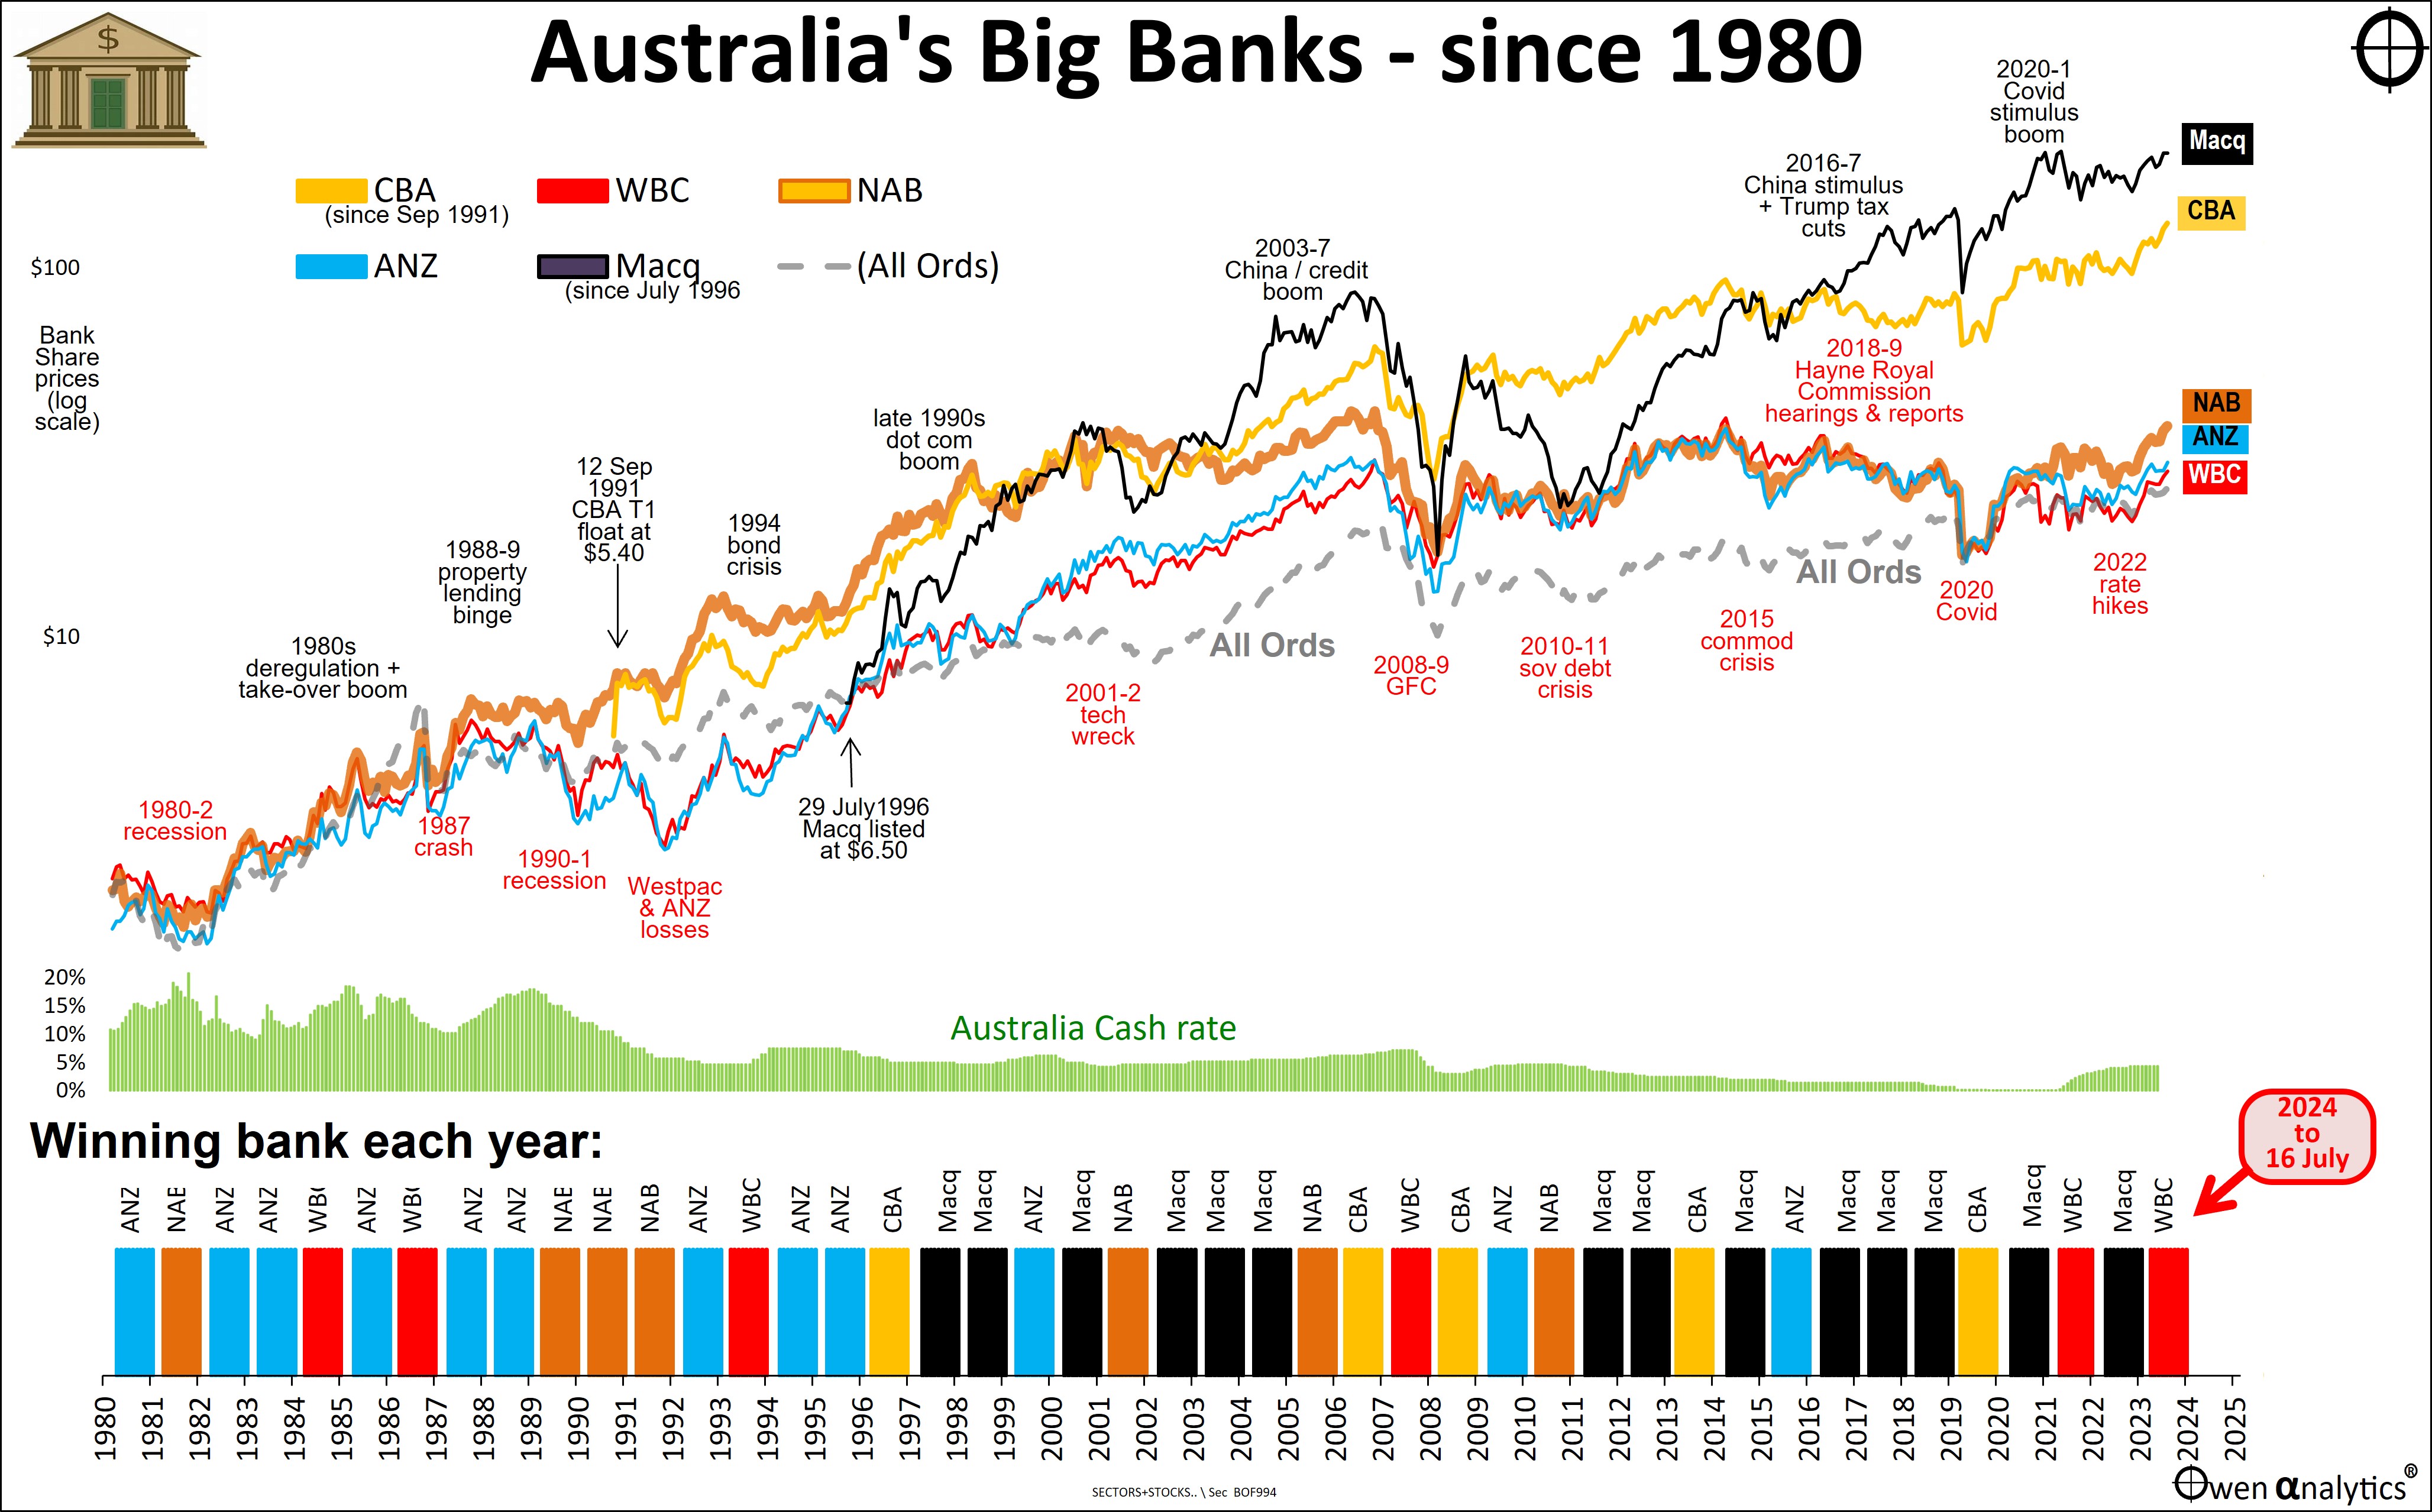
After bank deregulation in the mid-1980s, the two most aggressive business lenders - Westpac and ANZ - went mad in a wild lending spree and suffered huge, near-existential losses in the early 1990s ‘recession we had to have’, and have never fully recovered. NAB, which sensibly (or luckily) was asleep during the 1980s lending frenzy, leapfrogged into the lead.
But then NAB also went mad in the 1990s and 2000s and blew its lead thanks to a string of costly own goals, mainly with its disastrous overseas adventures. As NAB fell by the wayside, CBA overtook it to become the largest and most profitable of Australia’s big-4 retail banks.
For a run-down on the recent history of the big banks, see:
· Which Bank? . . is winning the Battle of the Banks? (17 July 2024)
Share price has run well head of dividends or profits
In terms of share price gains, CBA has been a star in recent years. Its share price had been stuck at around $80 pre-Covid, then fell below $60 in the 2020 Covid lockdown recession sell-off, but more than doubled to $130 by mid-2024.
Why? It’s a mystery to me and most analysts. One theory is that much of the buying has come from global institutions selling out of China, but having to retain exposure to Asia-Pacific. Australia is a ‘safe haven’ in Asia, but they wanted to avoid the big miners because of their exposure to China, so they went for the banks instead. A related theory is that passive index funds have been forced to buy CBA due to its sheer weight in the index, forcing it up even further.
Either way, CBA’s share price has run up well ahead of fundamentals. This is the focus of today’s story.
Chart A – share prices -v- dividends
This chart shows CBA’s share rice (yellow) since the 1991 float, thoroughly beating the market benchmark ‘All Ordinaries index’ (grey line).
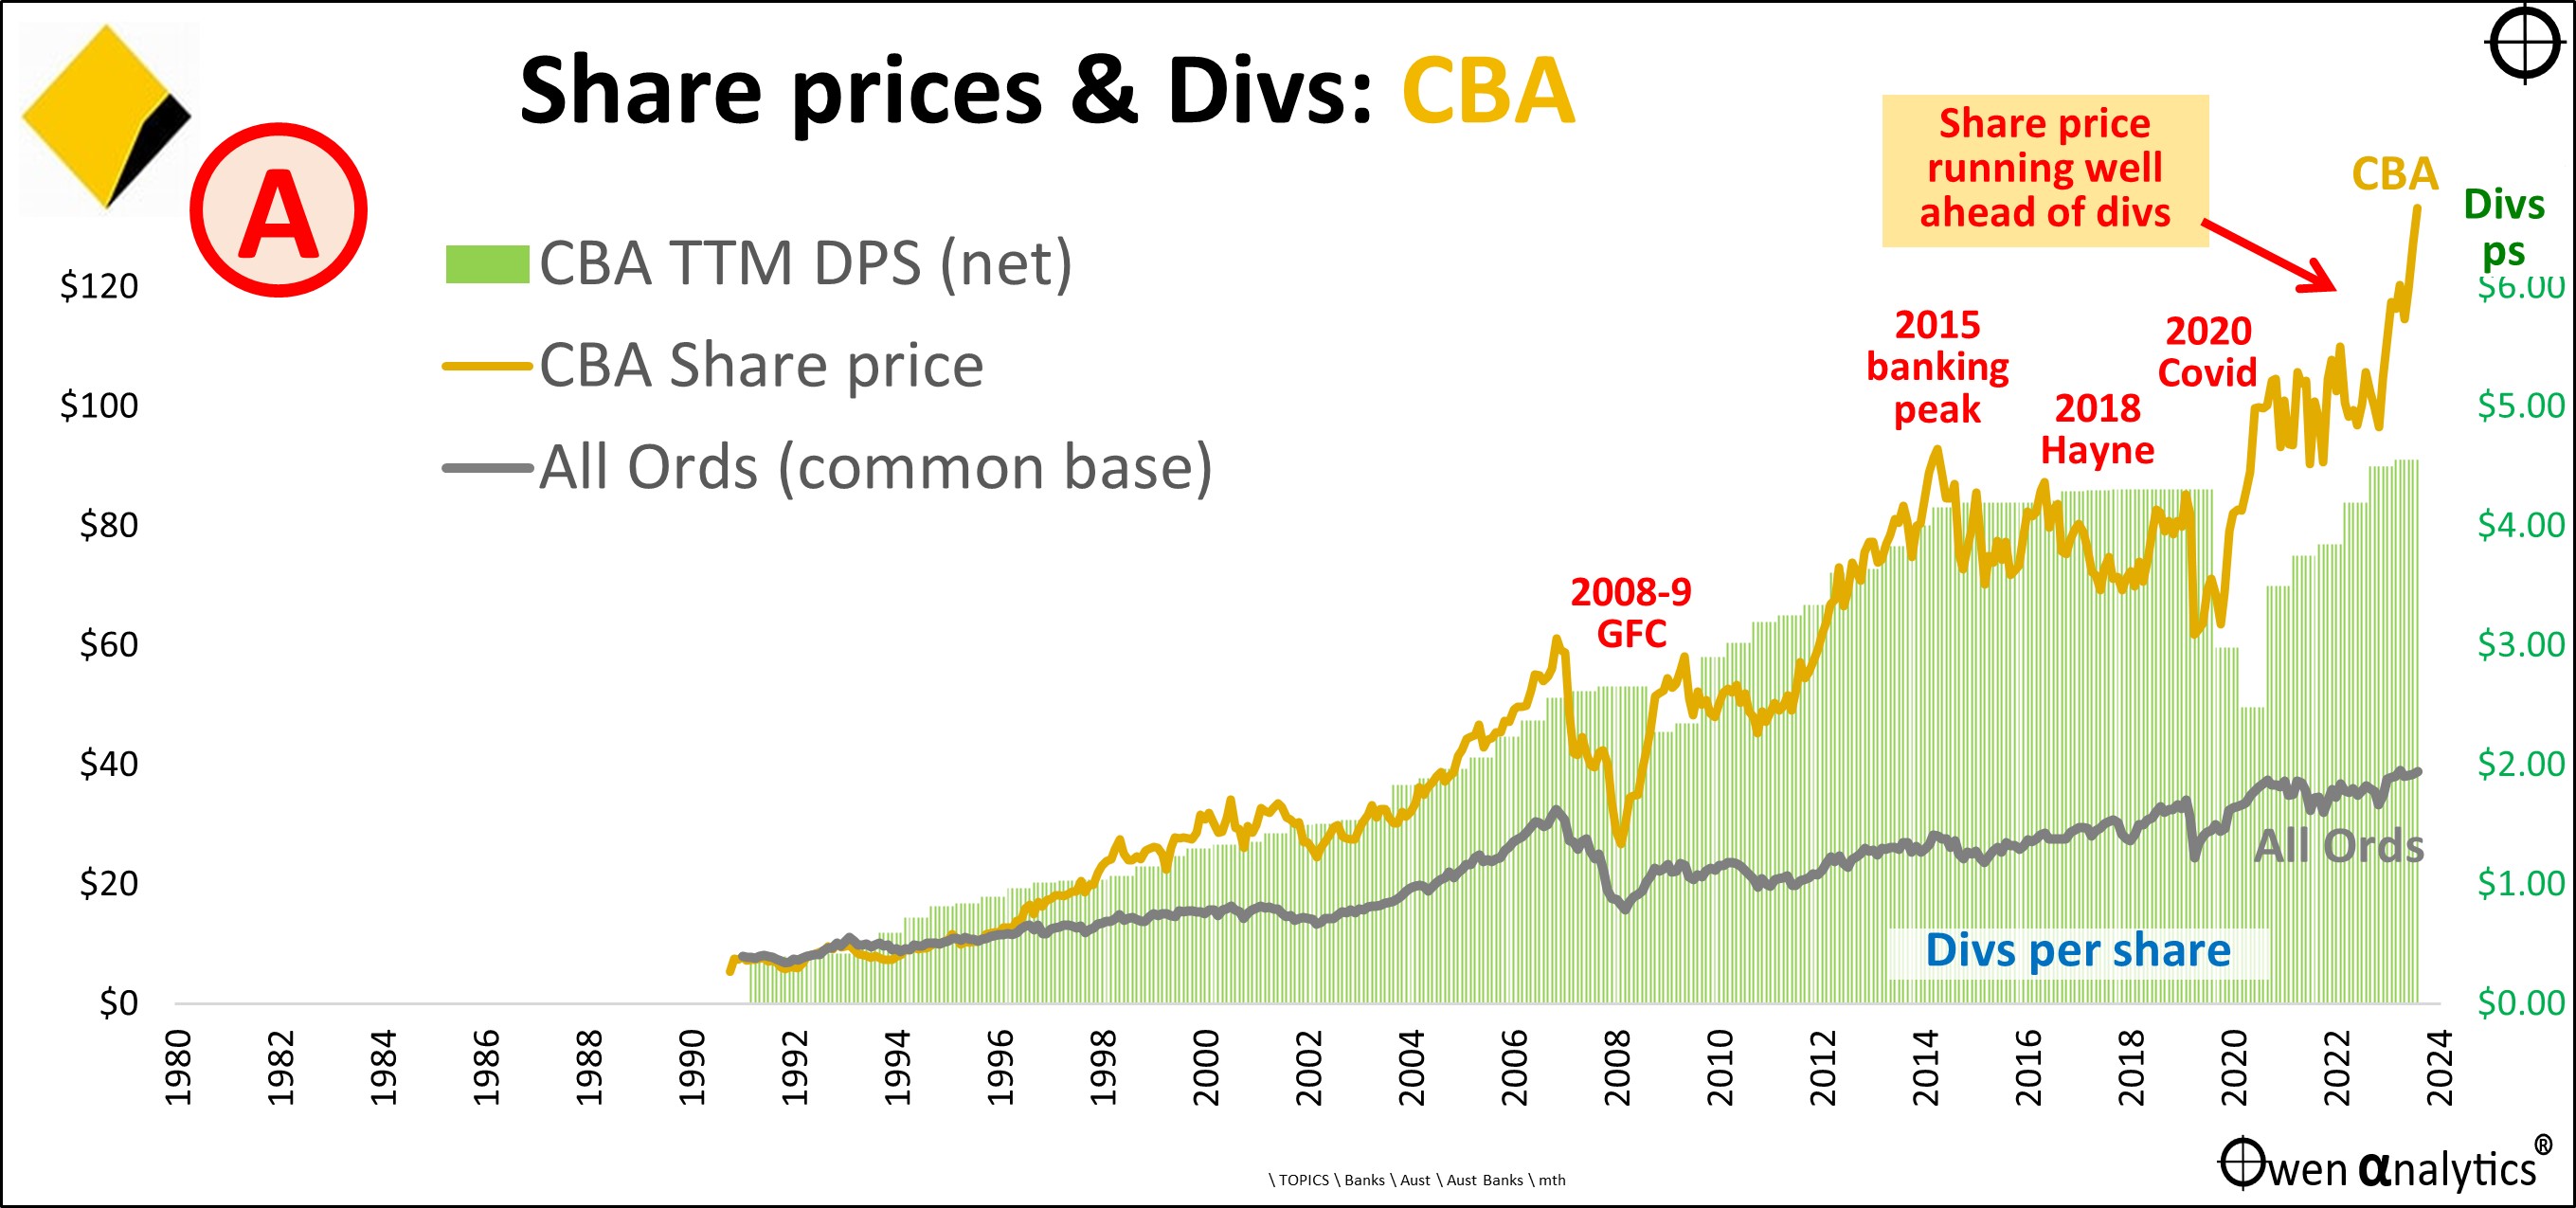
The problem is that the share price has run well ahead of cash dividends (green bars). Dividends were cut in Covid and have only just rebounded to 2015 levels, but the share price has doubled. (‘TTM’ means ‘trailing twelve months’).
This means buyers are now paying two times per dollar of dividends than they were a decade ago.
Chart B - Dividends, franking, and real dividends
In the next chart, the green bars represent cash dividends per share each year (same as Chart A), but here we also show franking credits attached to the dividends (orange bars). Adding the two together, we arrive at the ‘grossed-up’ dividends per share (black line) for tax-free investors (eg Australian pension funds, charities, but notably not foreign shareholders).
The grey line shows the ‘grossed-up’ dividends in real terms (after CPI inflation).
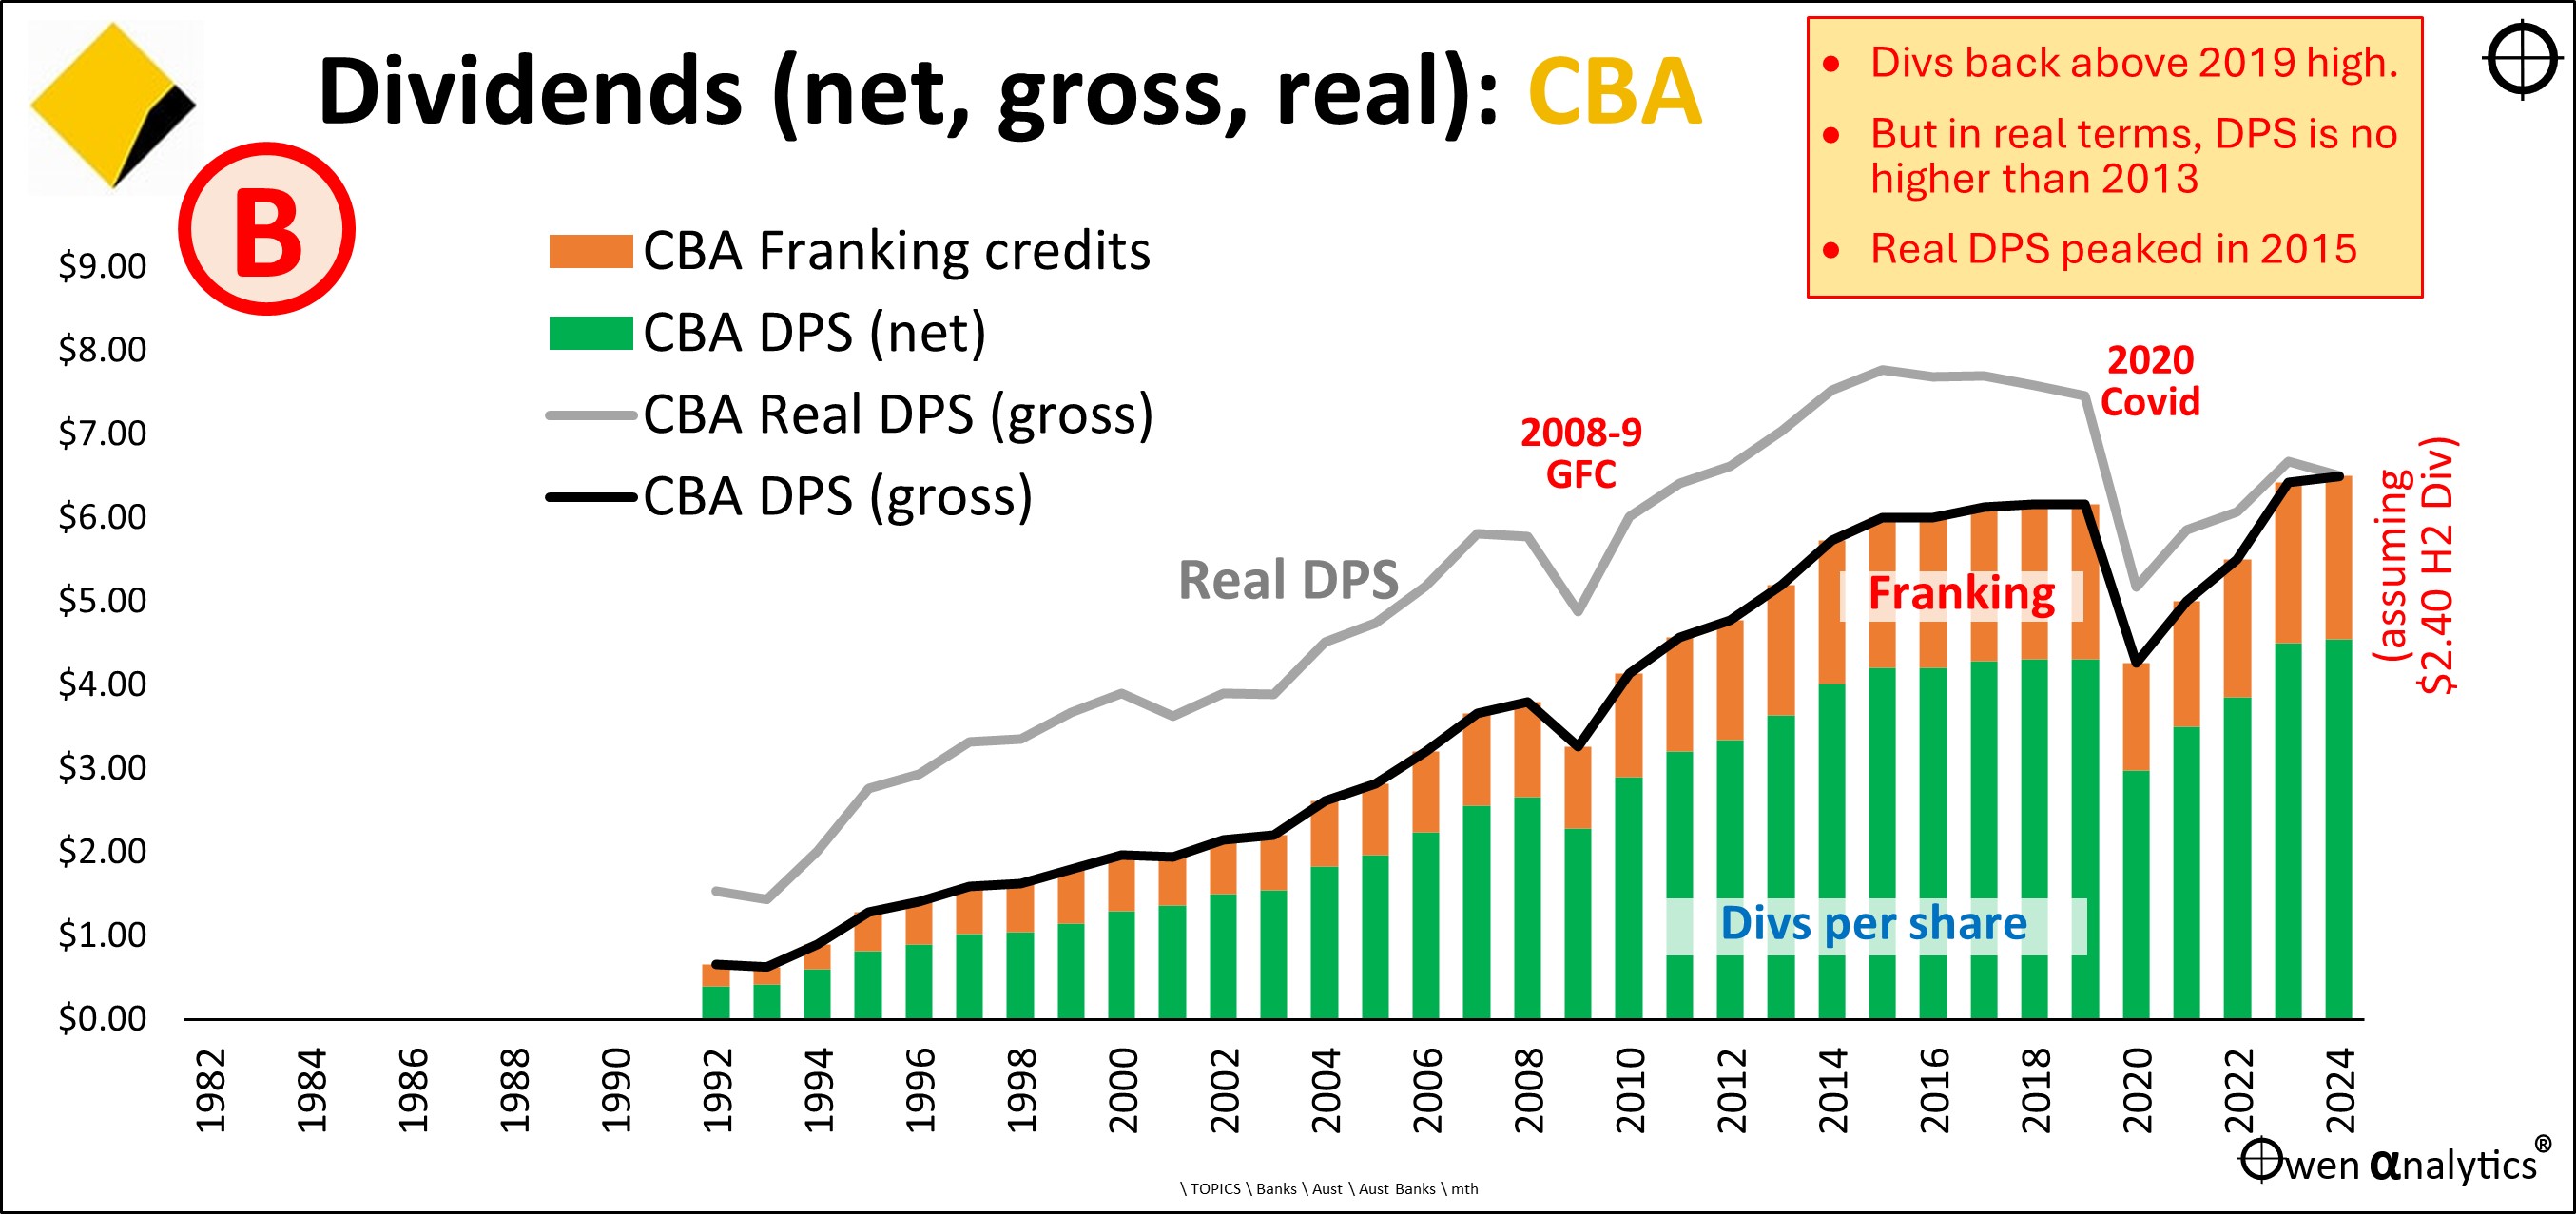
This grey line highlights the problem. Real dividends per share peaked in 2015 and are still well below those levels a decade later.
Dividends per share in nominal (pre-inflation) terms are at least back above their 2019 pre-Covid high. But in real terms after inflation, dividends per shares are no higher now than they were in 2013 - that's more than a decade of no real growth in dividends.
Chart C - Pricing – expensive relative to dividends (dividend yields)
So, the pricing of CBA shares relative to dividends is now unusually expensive.
Chart C below shows CBA’s net (cash) dividend yield (yellow) compared to the cash dividend yield for the overall ASX market (grey line).
CBA’s dividend yield has always been around 1.5% above the dividend yield of the overall market. The reason for this traditional dividend yield premium is the fact that CBA (and the other big retail banks) are low-growth, mature giants with little room to grow, and they are highly cyclical, with extremely high leverage. (CBA is currently geared 17:1, or in home lending terms, has a ‘Loan-to-Value’ ratio of 94%).
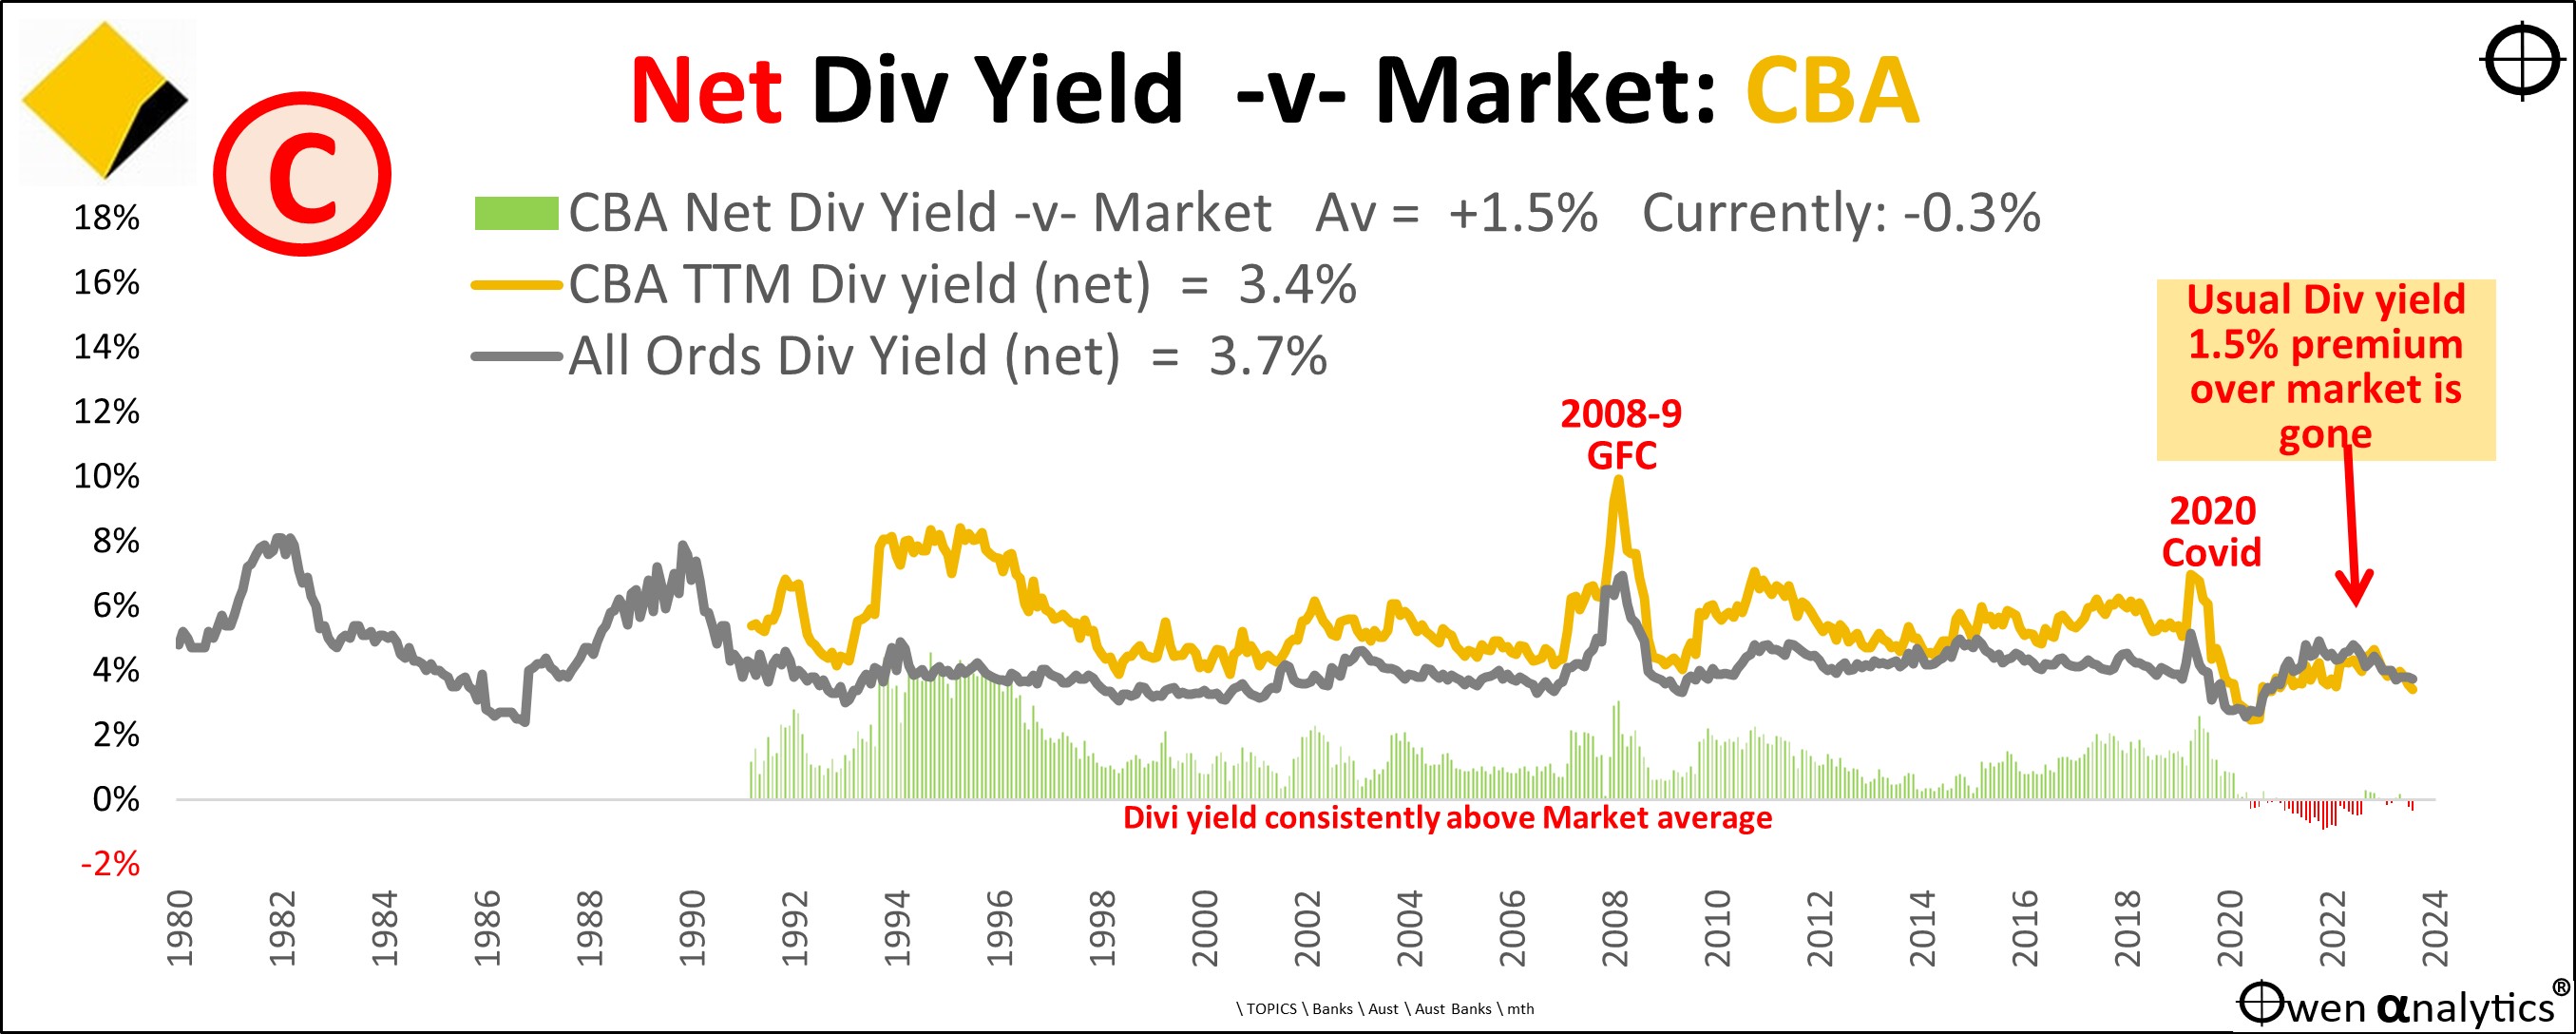
The green bars running along the bottom show the dividend yield premium to the overall ASX market (ie CBA div yield less overall market div yield). This is normal for all large banks in all markets around the world.
However, this traditional dividend yield premium to the overall market (positive green bars) is gone. In fact, for most of the past three years CBA has traded at a lower dividend yield than the market (ie the positive green bars have been running at negative red bars).
Chart D - Pricing – expensive on grossed-up dividend yields
Chart D is the same as C except it is based on grossed-up dividend yields (including franking credits).
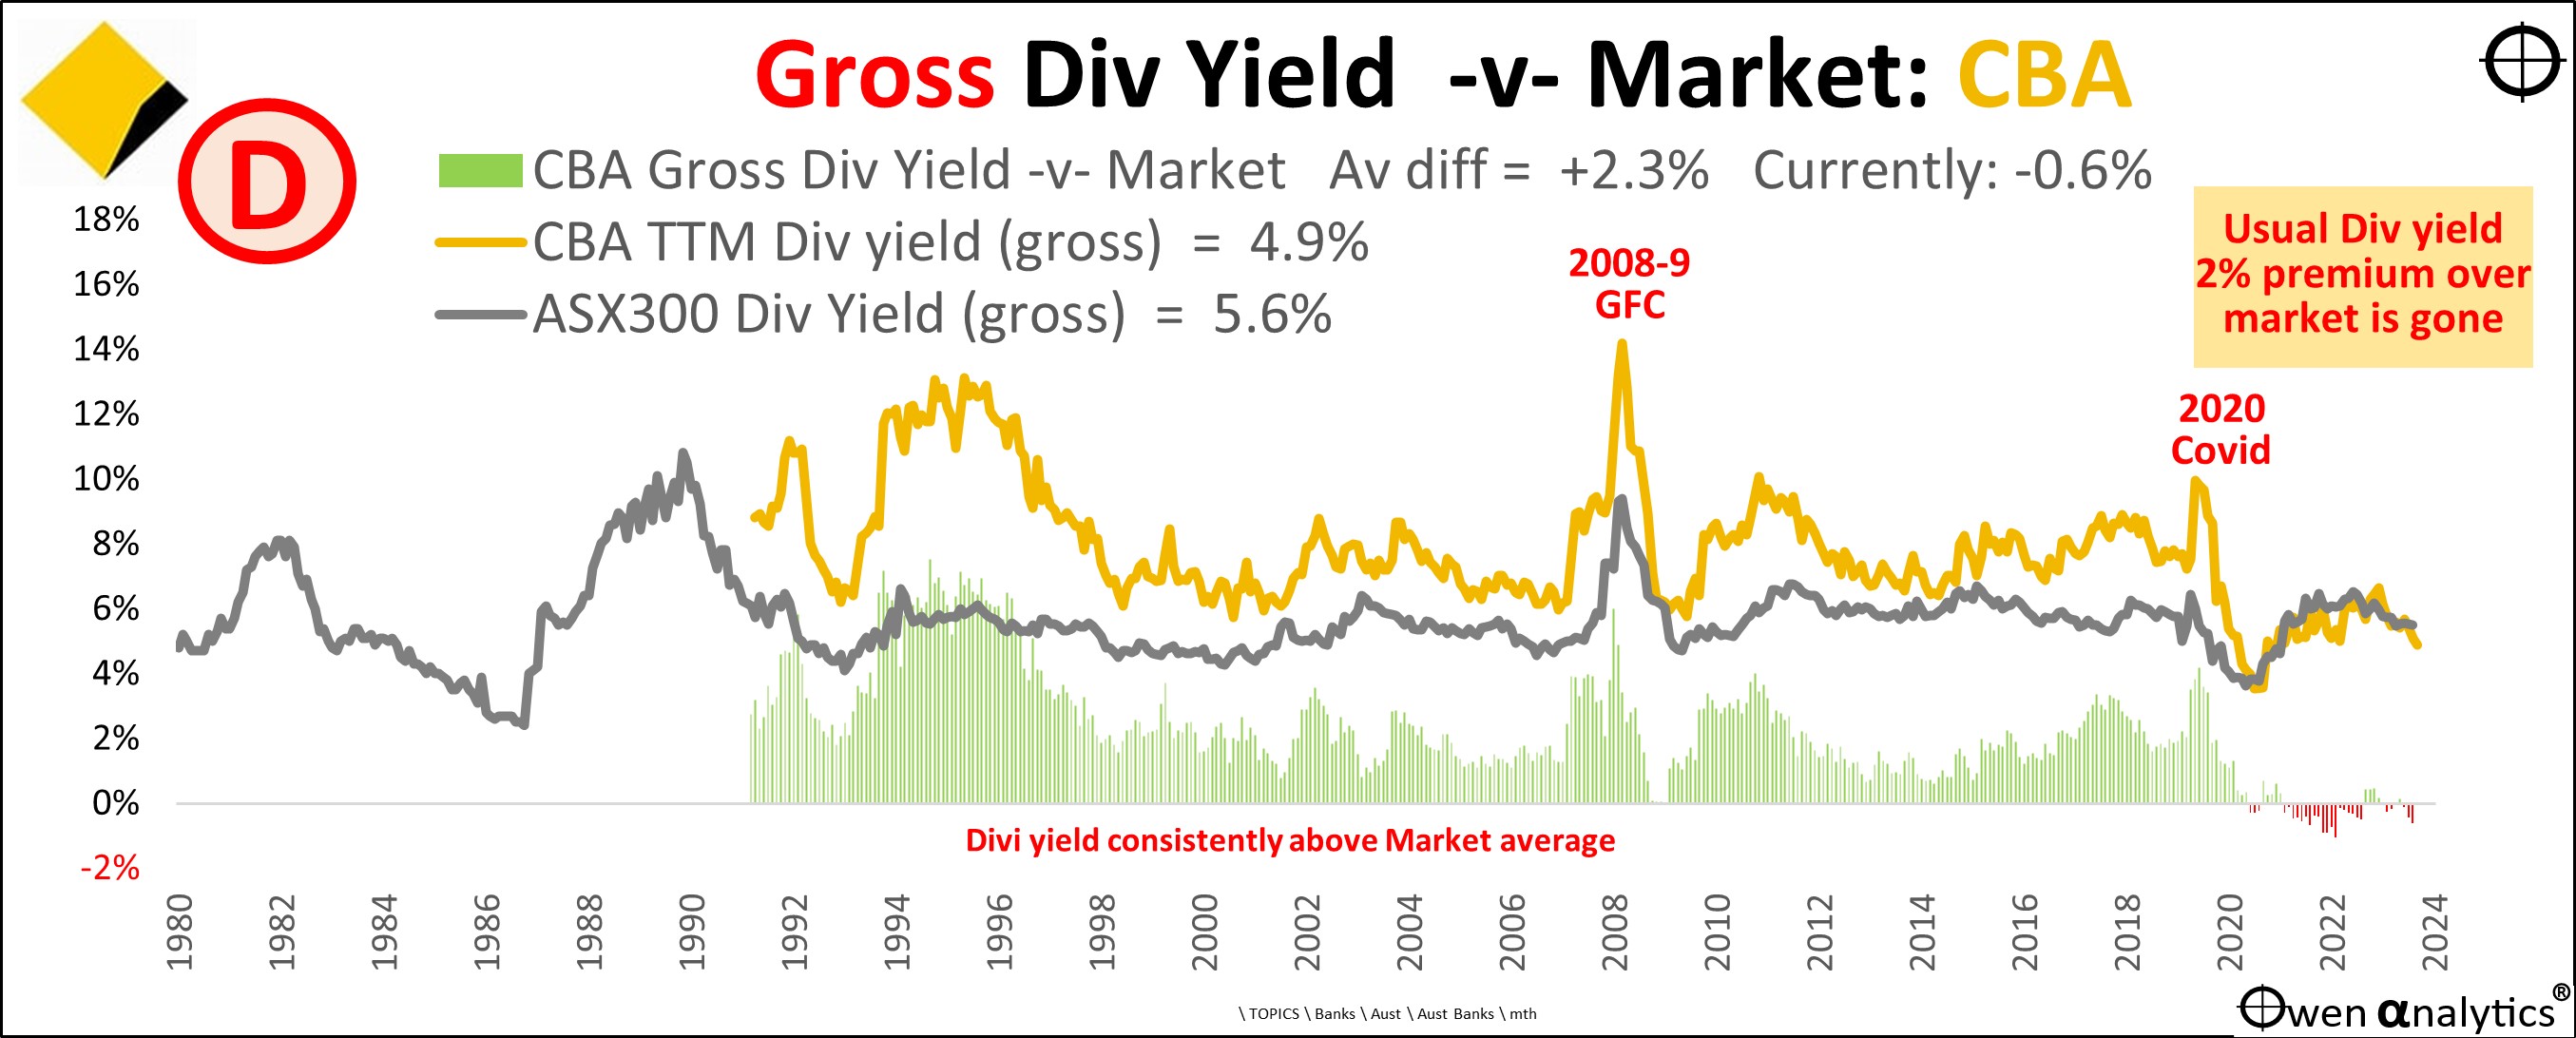
The traditional grossed-up yield premium of +2.4% pa above the overall market is also now negative (negative red bars instead of positive green bars) in recent years.
Chart E - Pricing – expensive relative to profits (price/earnings ratios)
Here we show CBA’s share price relative to profits (‘price/earnings ratio’) – ie how much are buyers paying per dollar of profits.
CBA’s p/e ratio (yellow line) has traditionally been lower than the overall market p/e (grey line) – again because CBA is a highly cyclical, highly geared, mature, low-growth giant. This is normal for all large banks in all markets around the world.
The negative red bars at the bottom (CBA p/e less overall market p/e) indicate CBA’s traditionally lower p/e for most of the past three decades as a listed company.
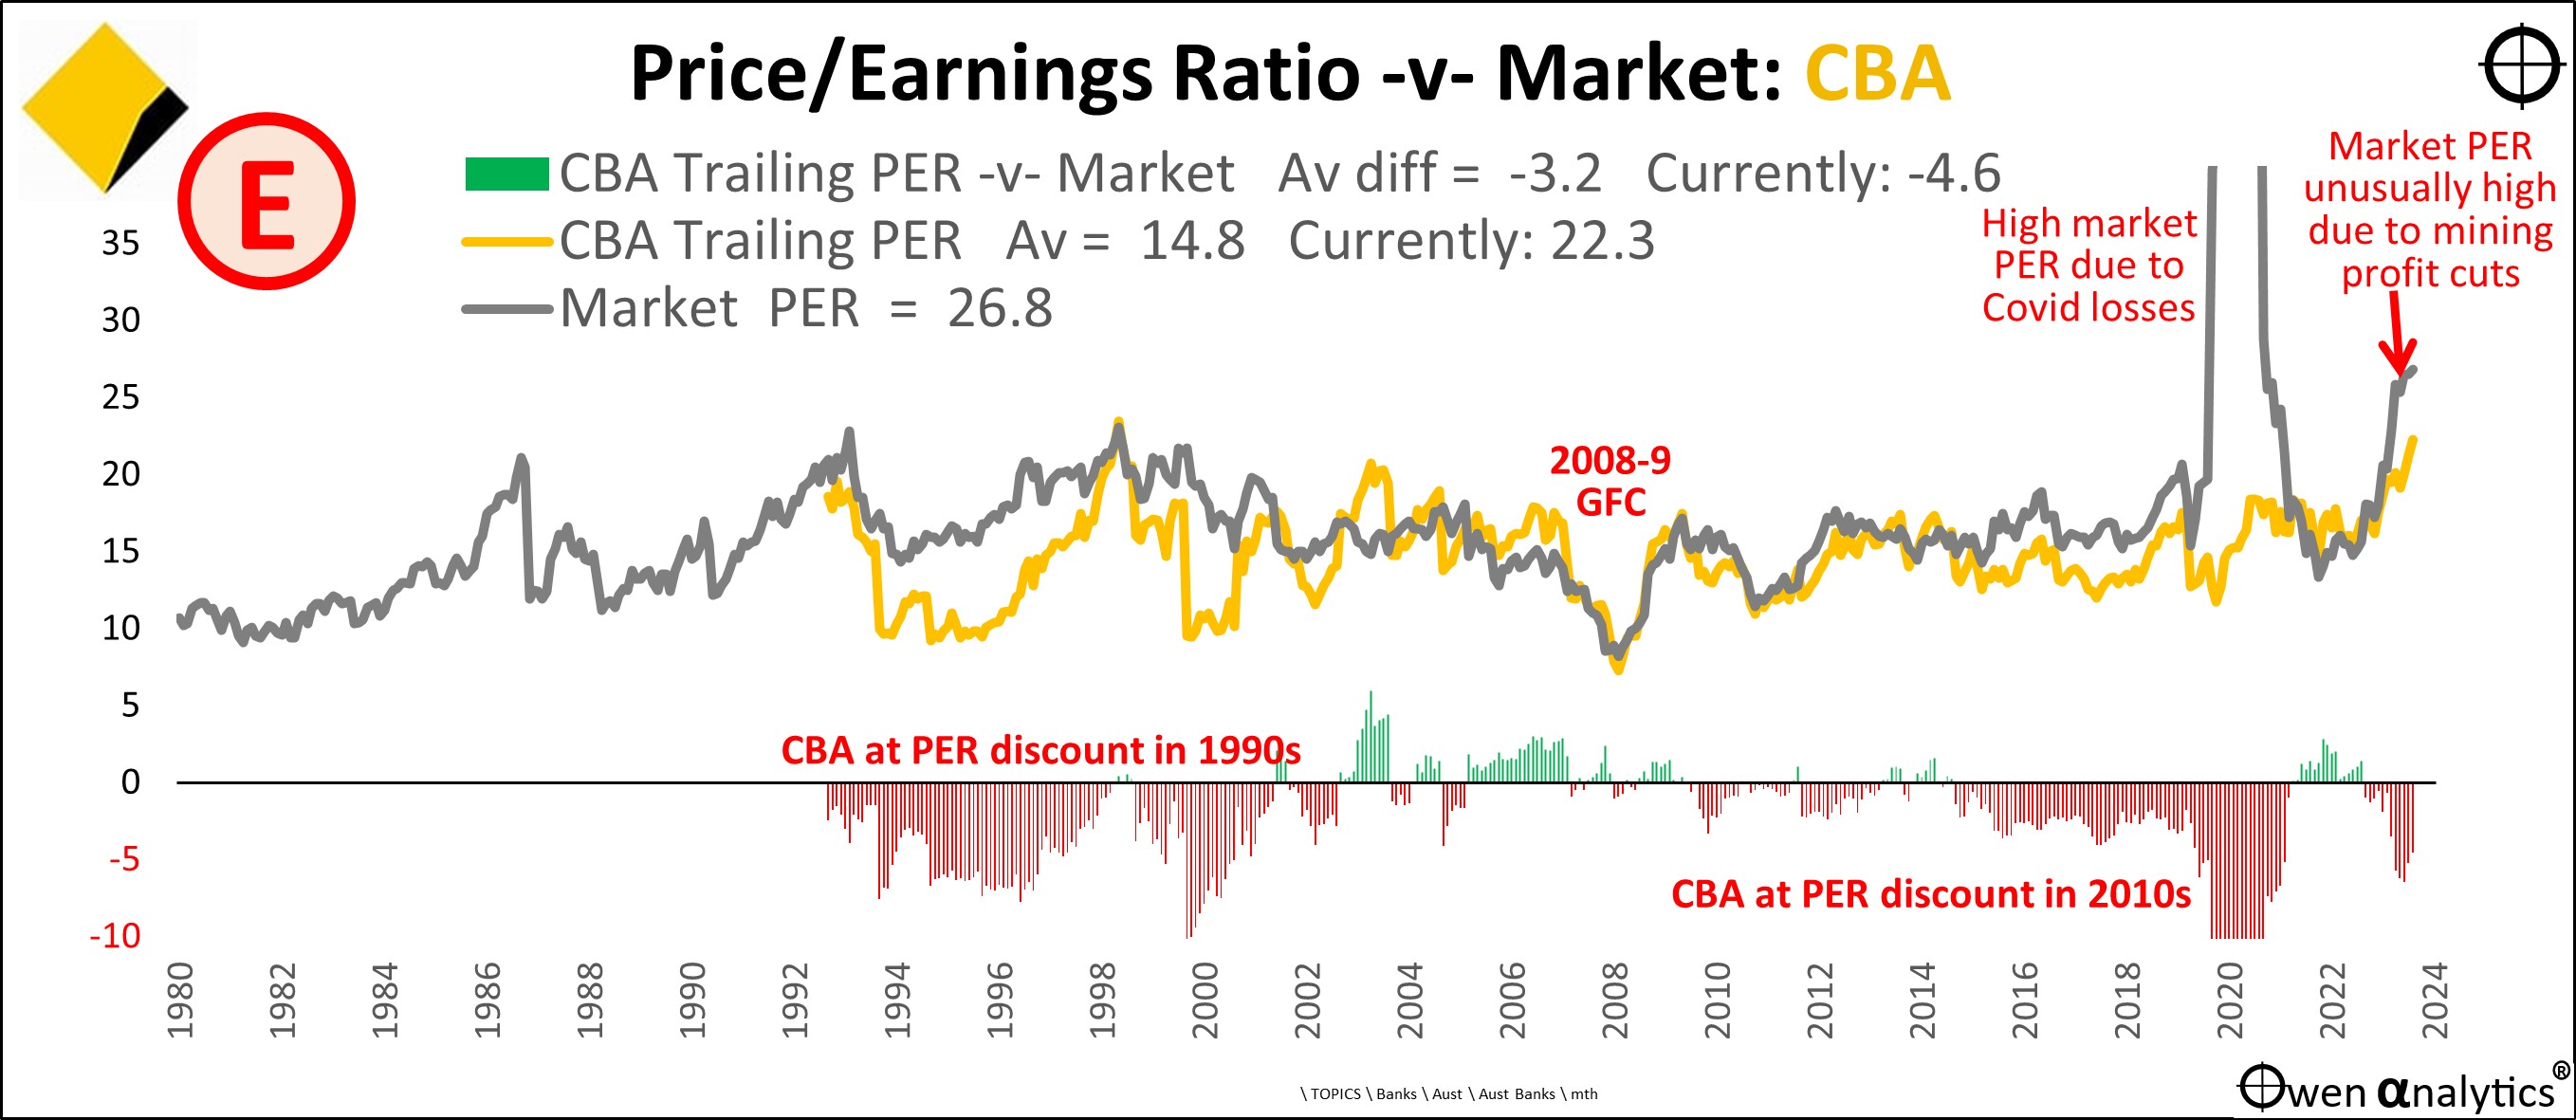
To the right we see CBA’s current price/earnings ratio has now shot up to a very high 22 times earnings – ie buyers are paying $22 per $1 of profit. Ordinarily it would make no logical sense to pay any more than around $15 per $1 of profit for a low-growth, mature big bank like CBA.
On the chart we see that this high current p/e of 22 for CBA is actually still lower than the overall market p/e ratio of 26 times earnings, but that is unusually high at the moment because of last year’s disappearance of much of the windfall post-covid iron ore profits from BHP, RIO, and FMG. The market p/e is high because the market is expecting these windfall iron ore profits will suddenly re-appear. (That is by no means certain).
You can’t look at CBA’s very high p/e of 22 and say: “That is ok because it is still lower than the market p/e of 26!”
The fact that the market p/e is temporarily high because of the temporary ups and downs of windfall iron ore profits has nothing at all to do with CBA.
We should ignore the completely unrelated iron ore/China story and ask instead: why are buyers suddenly paying $22 per $1 of CBAs profit?
Over the past year, CBA has suddenly been fundamentally re-rated by the market – either it has suddenly become a ‘growth stock’, or it has suddenly become less risky.
Neither is the case. It is still just a bloated building society confined to property lending in Australia, it is still highly geared, and highly exposed to the highly-geared Australian property market.
Chart F - Declining growth + declining returns on equity
Here’s the twin problem. CBA is the opposite of a growth stock:
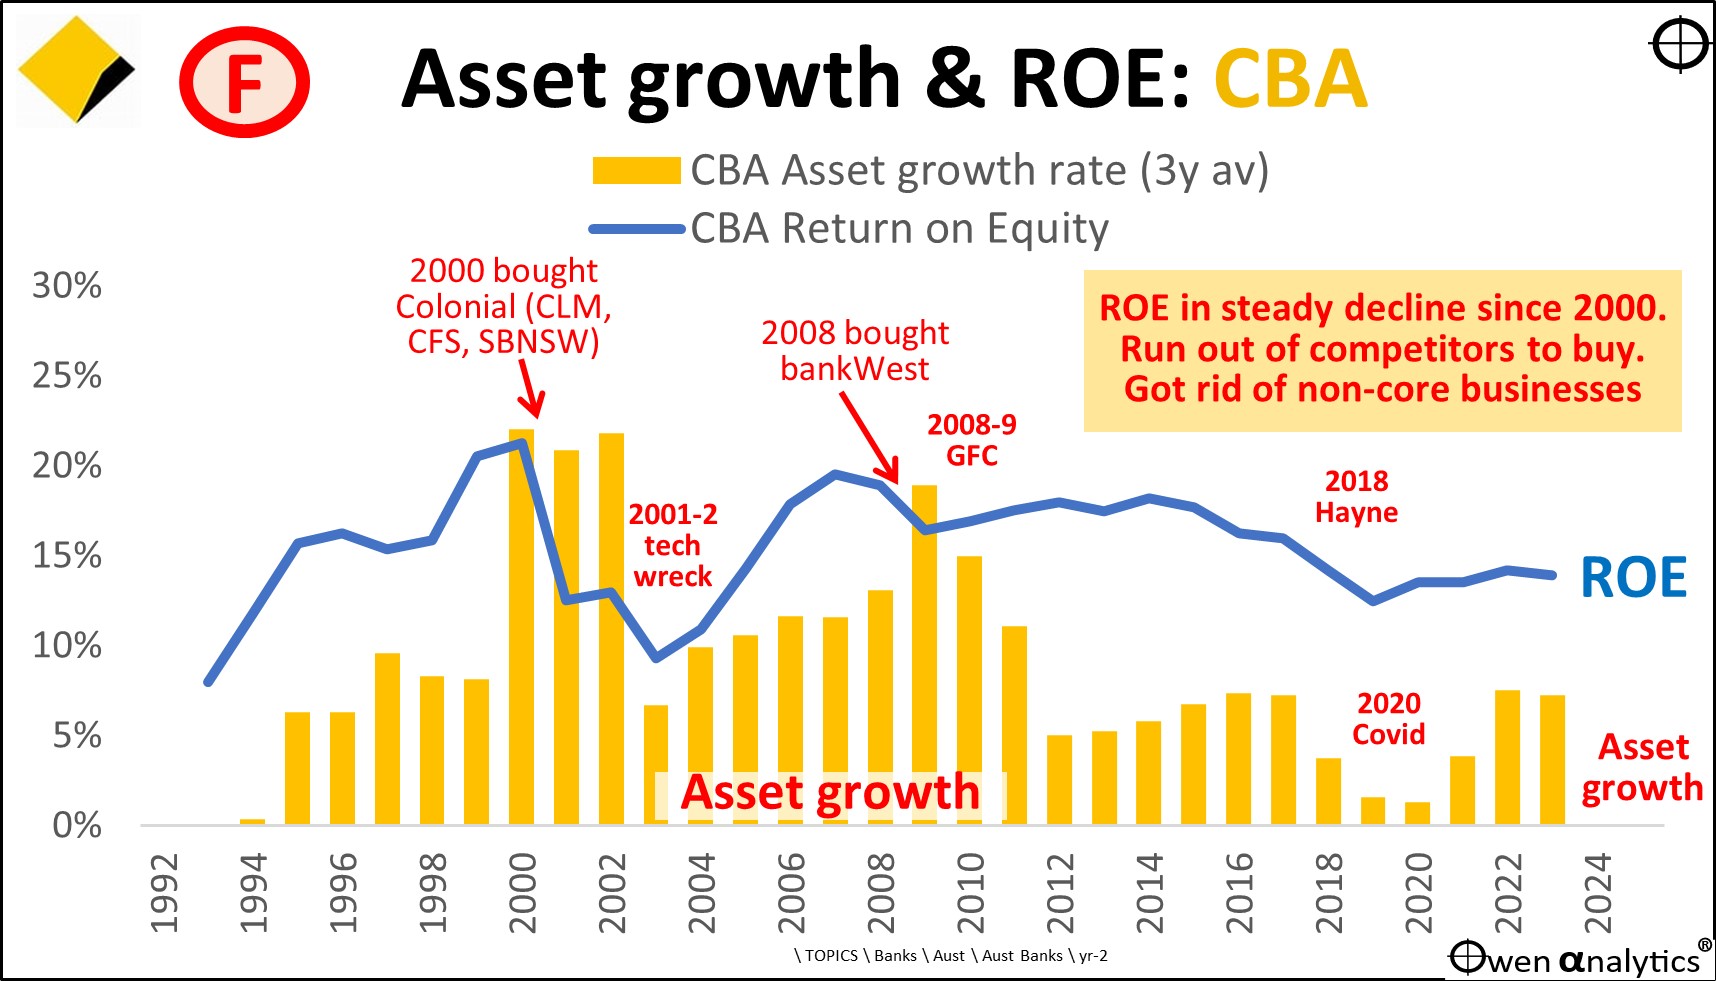
Returns on equity (blue line) have been declining for the past 25 years. ROE peaked at more than 20% in 2000, but is down to a rather ordinary 13-14% pa in recent years.
Asset growth rates (yellow bars) have also been declining for the past 25 years. CBA has run out of things to buy, and has been forced to shed its non-core, conflicted, cross-selling businesses. Asset growth rates in recent years have barely kept pace with inflation.
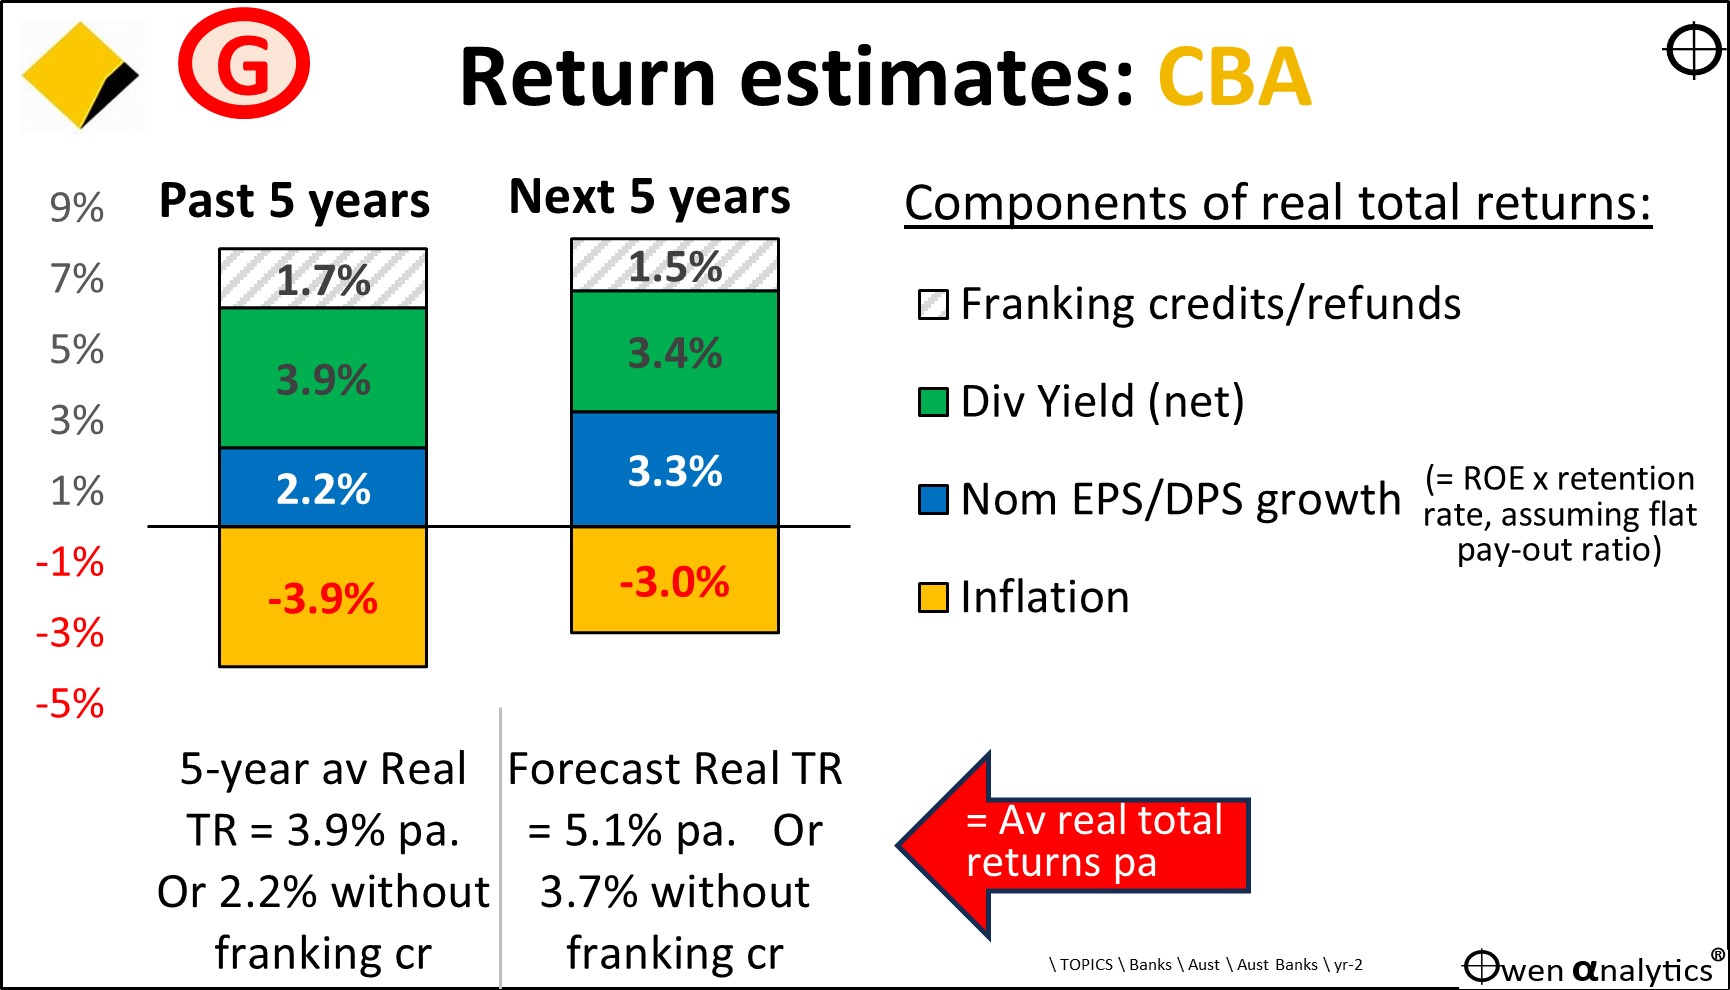
Chart G - Outlook? – better than recent years, but the early glory days are over
This chart breaks down returns from CBA (based on underlying fundamentals) into its main components, for the past five years (left bars) and the likely future five years (right bars):
(For the purpose of this outlook, I ignore short-term impacts like recessions – where profits, dividends, and share prices would fall temporarily but then rebound, with little or no long-term damage).
This approach estimates real total returns at around 5% pa over the next five years. The components are:
-
-
- Current trailing cash dividend yield of 3.4%
- Plus franking credits of 1.5%
- Plus likely nominal earnings growth of around 3.3% pa
- Less likely CPI inflation of around 3.0% pa.
- = real total returns of around 5% pa ignoring any share price reversion to fair pricing
Or, excluding franking credits to zero-tax investors, a real total return of around 3.7% pa. That’s very ordinary.
NB. This assumes that the current level of over-pricing can be maintained. If the share price falls back to more reasonable levels relative to profits and dividends, this would reduce total returns. For example, based on the very ordinary fundamentals, a ‘fair price’ would be well below $100.
The key variable here for long term returns is likely future earnings growth. I assume that future sustainable ROE is going to be around 13% at best (the average in recent years). If CBA retains just 25% of its earnings (ie continues to pay out 75% in dividends), then that caps EPS growth to just 3.3% pa. That’s barely above inflation.
And that doesn’t allow for likely increases in regulatory and compliance costs, nor any increase in competition (future competition from the US big tech is the main threat here, not the other local banks).
The ‘good news’ from this chart – particularly for retirees who are relying on dividends rather than share prices - is that dividends per share may be able to at least keep pace with inflation – which is a lot better than the past decade when dividends lagged inflation (chart B).
What to do?
Potential buyers would need to ask – why pay $22 (or anything above say around $15) per dollar of profits for a low-growth, highly geared, highly cyclical, highly political, bloated building society, with rising compliance and regulatory costs, increasing competition on all fronts, and limited growth potential?
For existing shareholders, much would depend on their cost base and potential capital gains tax on sale. Even for shareholders in zero tax environments, it is always difficult to put aside the emotional attachment gained through years of great returns. However, it is important to look behind the share price gains and focus instead on what is going on with the underlying fundamentals.
For those who do sell or sell part, the equally important question then becomes: how do you invest the proceeds to better achieve your objectives.
Personally, I have not been a CBA shareholder for several years. My main concern is not whether to buy or sell. The issue for me is CBA’s heavy weighting in the local share market, and what the current over-pricing and likely poor future returns mean for asset allocation decisions in diversified portfolios.
Extreme concentration of risk factors
Australia has an extraordinarily broad and diverse economy and business landscape, but decisions about allocations to Australian shares in diversified portfolios come down to two very narrow factors that dominate the local share market - the current over-pricing and likely poor performance of the big banks (led by CBA), and iron ore profits.
Those two very narrow and specific questions dominate the fate of the overall local share market, and diversified fund returns.
Certainly does focus the mind!
See also:
· Which Bank? . . is winning the Battle of the Banks? (17 July 2024)
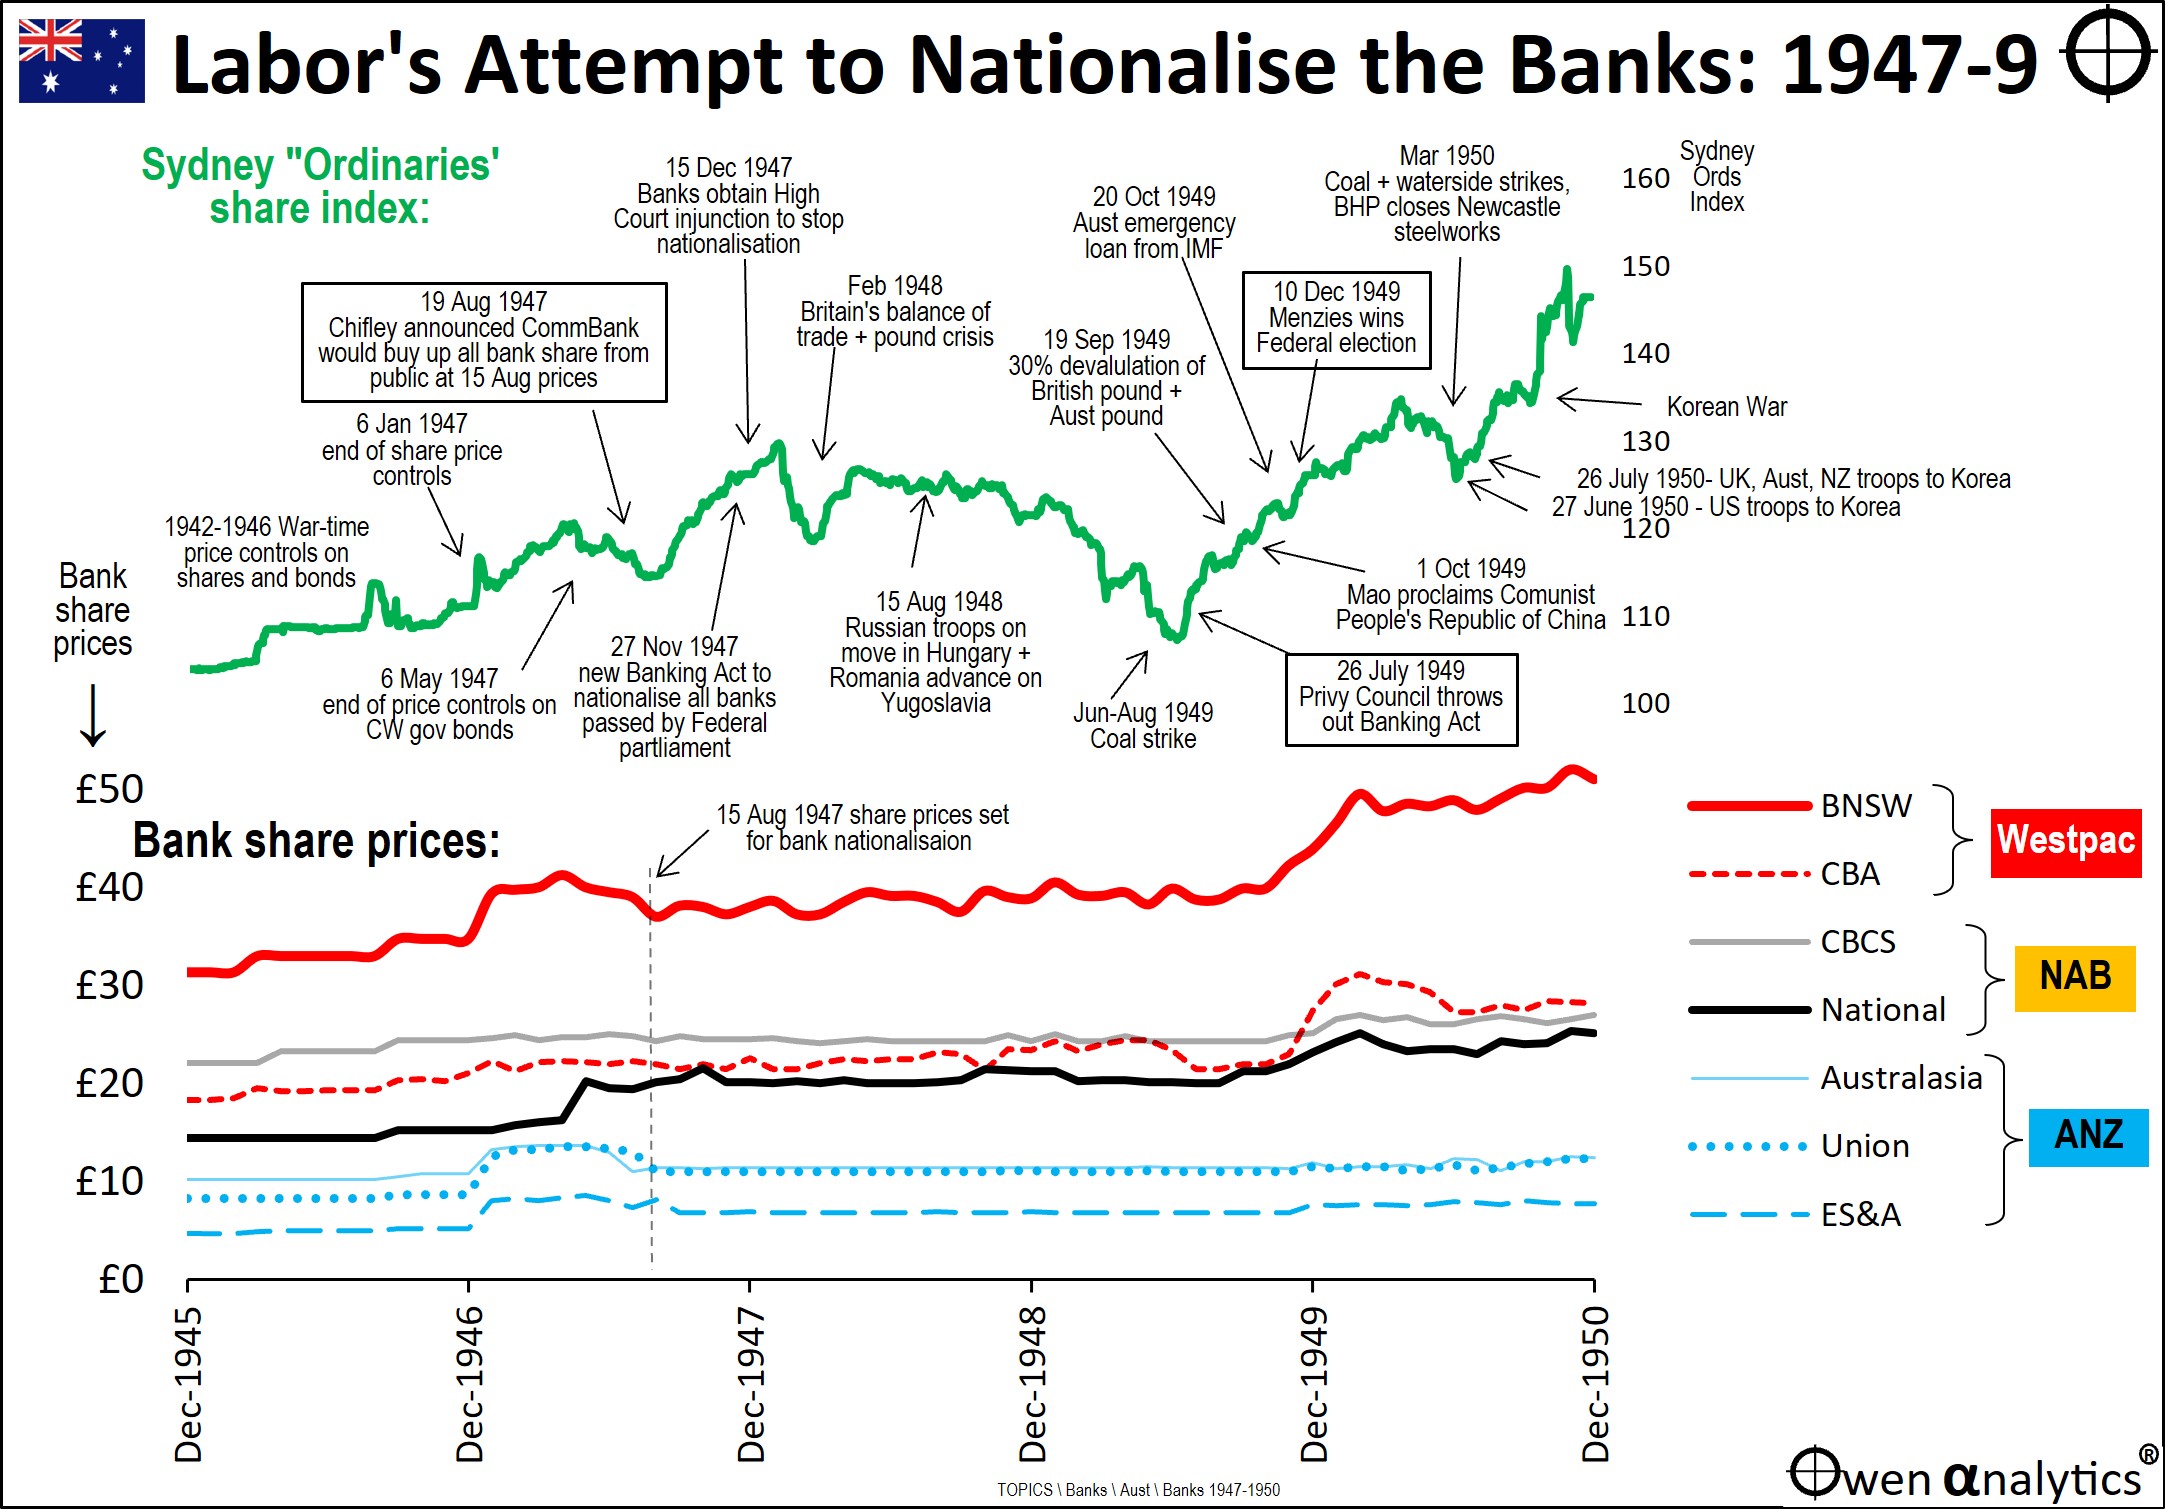
· Labor’s attempt to nationalise all banks in Australia! (21-7-2024)
‘Till next time – happy investing!
Thank you for your time – please send me feedback and/or ideas for future editions!
Disclosure: In the past I have owned shares in CBA, but do not now (aside from indirect holdings via passive/active funds). Readers should NOT imply or assume anything from this, as my past holdings reflect past decisions, and this may or may not reflect a similar decision today.
As always, my analysis is fact-based and intended to be as dispassionate as possible, regardless of whether or not I am a buyer, a seller, or holder. This quick, initial snapshot is no substitute for more detailed research.
This is intended for education and information purposes only. It is not intended to constitute ‘advice’ or a recommendation to buy, hold, or sell and stock or security or fund. Please read the disclaimers and disclosures below.