Key points:
-
-
- This is Part 3 of my 6-part series on global share market pricing.
- Not only do global share markets appear expensive relative to reported profits, dividends, and book values (Parts 1 & 2), the ‘forward’ price/earnings ratios are even higher, as they assume outlandishly high profit growth for the coming year.
- This appears to be a double-layer of over-pricing – overly ambitious pricing per dollar of current profits, plus overly ambitious assumptions of future profit growth.
- It is not just the US – most of the main global share markets have overly ambitions multiples based on overly ambitious profit growth assumptions.
- In fact, the US profit outlooks are probably more achievable than most other countries, including Australia, where pricing is off with the pixies in fairyland!
- I also take a look at the positive and negative forces driving global profits. The media always focus on the negatives, but actually there are quite a few positives, and so far, the positives are winning.
- What are the risks and where are the cracks likely to appear?
This series so far -
This article is Part 3 in my 6-part series on share market pricing. The articles in this series are:
Also take a look at my explanation in Part 2 of why I do this stuff, and why it is important for investors to understand pricing and how it affects returns and future wealth.
This series is designed to be read in sequential order, so most readers would probably get more out of today’s article if they have already read the prior articles via the links above.
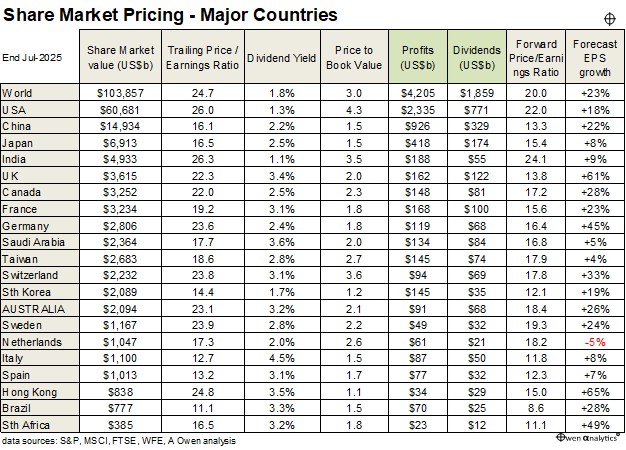
Before going to today’s charts, first let’s re-cap on why we are talking about pricing in the first place. Here are charts 1, 2, and 3 from the ‘Part 2’ article in this series, highlighting the apparent expensive pricing of most world share markets on three key measures – trailing price/earnings, dividend yields, and price-to-book values -
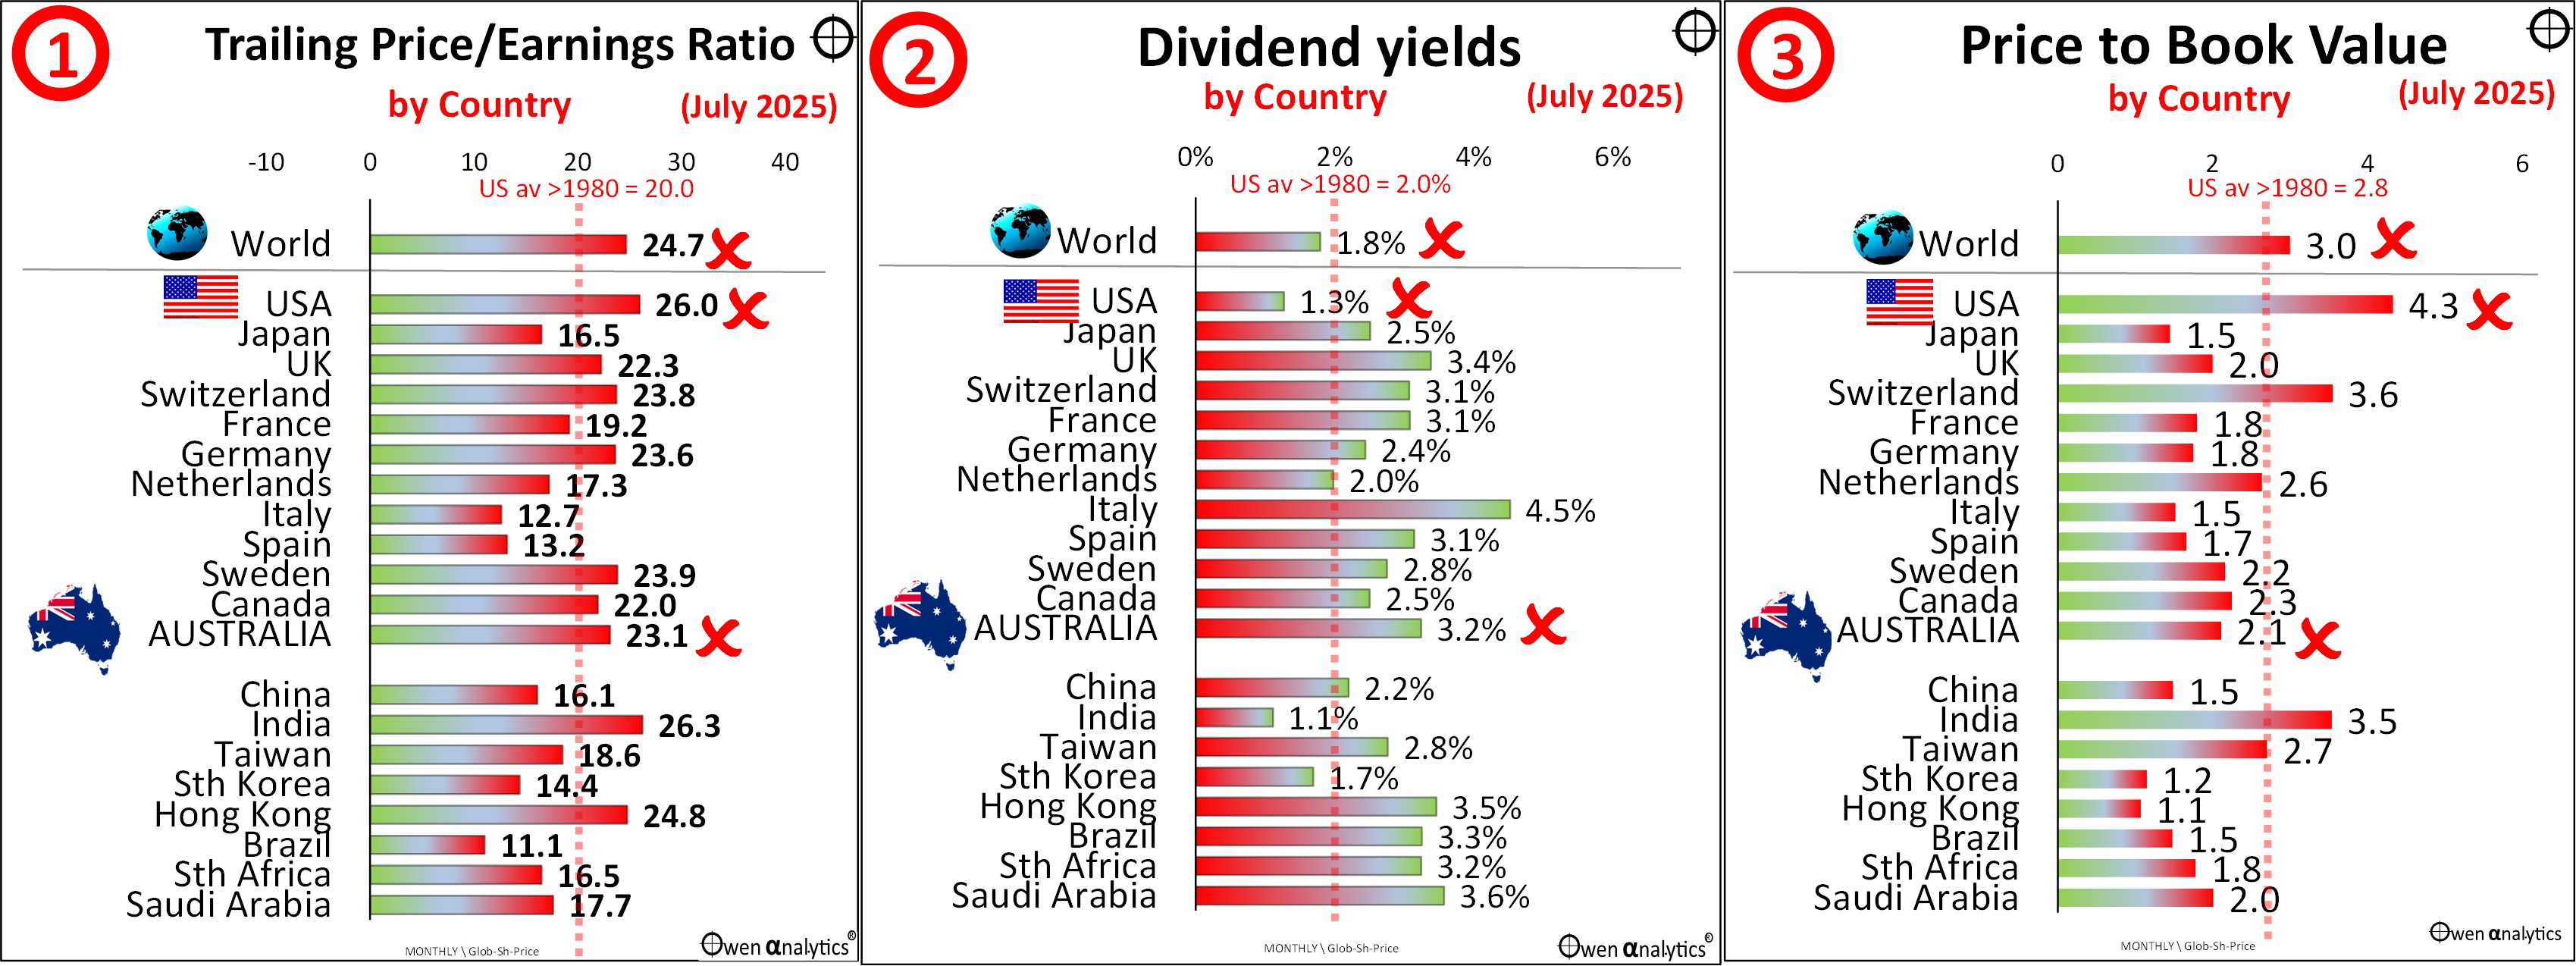
Charts 4 & 5 – Forward P/E ratios and Earnings growth assumptions
Today’s charts show two further pricing measures – ‘Forward’ price/earnings ratios, and forward earnings growth assumptions on which they are based – for the same 20 largest share markets in the world covered in the other articles in this series. (All data is to end of July 2020 for consistency):
‘Forward’ -v- ‘Trailing’ price/earnings
The ‘trailing’ price/earnings ratio (used in chart 1, and covered in Parts 1 and 2 of this series of articles) is the current market value divided by the most recent actual reported aggregate profit from the market (how many dollars am I paying per dollar of actual profit).
However, the ‘forward’ price/earnings ratio is the current market value divided by the forecast next year’s aggregate profit from the market (how many dollars am I paying per dollar of expected next year’s profit).
Why next year’s forecast profits?
Looking at the expected profit over the coming year head should be more important than profit reported for the most recent year because that is in the past, and may have been affected by events and conditions that may no longer be present or relevant.
For example, if I have money to invest for a year and I was looking at a bank term deposit, I’m not really interested in what the bank paid on a 1-year term deposit over the past year because that year has gone. Instead, I would ask the bank what they are going to pay on a 1-year term deposit for the coming year starting from today. In the case of a bank term deposit, the bank locks in a specific rate they will pay for a specific future term, so I know the return in advance.
However, with the share market, future profits are unknown and unknowable in advance. Tens of thousands of highly paid share analysts around the world spend their entire working lives trying to forecast future company profits, and they almost always get it wrong – often by huge margins.
These analysts’ profit forecasts for every major company in every major share market around the world are all collated by research houses (like MSCI, S&P, FTSE/Russell, Morningstar, and others) and they end up in the published calculations of ‘forward’ or ‘prospective’ price/earnings ratios each month.
Problems with ‘Consensus’ forecast earnings
Ben Graham (the ‘father of value investing’, and also Warren Buffett’s professor, first boss, mentor, and lifelong collaborator) warned against using analysts ‘consensus’ earnings forecasts, and instead recommended using the average of the past three year’s actual earnings (in order to smooth out temporary seasonal and one-off effects).
The advice is worth repeating here verbatim -
“Incredibly, the prevailing practice on Wall Street today is to value stocks by dividing their current price by something called the “forward P/E ratio”. But its nonsensical to derive a price/earnings ratio by dividing the known current price by unknown future earnings.
Investing your money on the basis of what these myopic soothsayers predict for the coming year is as risky as volunteering to hold up the bulls-eye at an archery tournament for the legally blind. (emphasis added)
Instead, calculate a stock’s price/earnings ratio yourself, using the current price divided by average earnings over the past three years.”
(Benjamin Graham’s ‘The Intelligent Investor’, 4th edition, 1973, revised 2003, page 274.)
As an aside, whenever I am asked to recommend reference books for serious investors and finance students, I start with these two:
-
-
- Ben Graham’s ‘The Intelligent Investor’. First published 1949. (I have the 1949 and 1973 editions, revised 2003)
- Graham & Dodd’s ‘Security Analysis’. First published in 1934 (I have the 5th edition, 1988)
The former is aimed at self-directed individual investors. The latter has been the bible and daily go-to reference for professional investment analysts the world over for many decades. It was, and still is, the basis of much of the CFA curriculum (The CFA Institute and its education programs were originally conceived and designed by Graham and Buffett).
Earnings growth assumptions
Taking another look at the global price/earnings ratios, it is tempting to say: “Gee, the trailing P/E is rather high at 25 times global earnings (chart1) but, hey, it is only 20 times forecast forward earnings, and a forward P/E of 20 is much more reasonable right?”
Problem is that a forward P/E of 20 is only lower than a current P/E of 25 (which is based on actual profits) because it assumes that profits will be 25% higher next year. That’s a massive assumption!
I find that most investors, advisers, and even most analysts focus too much on the reasonableness of the forward P/E ratio (‘A P/E of 20 is not that bad is it?’), and far too little on the reasonableness of the profit growth assumption it is based on.
You will notice that the ‘forward’ p/e ratios (in chart 4) are almost always lower than the ‘trailing’ p/e ratios (in chart 1) because analysists almost always predict that company profits will rise over the coming year.
No stock analyst ever predicts a decline in company profits except in rare cases – like an expected correction from an unusual temporary spike in commodities prices (like the iron ore miners in 2025), or an expected big write-off of an acquisition or project.
I cannot remember the last time analysts forecast an overall market-wide profit decline in any market, in any era, ever. In their defence, they would argue that future bad events are impossible to forecast. Of course they are –but that applies to all future events – good and bad!
Forward P/E ratios still too high
The problem at the moment is that, not only are ‘trailing’ price/earnings ratios very high (my conclusion in Part 2), but the ‘forward’ price/earnings ratios (chart 4) are even higher again, because they are based on mostly very ambitious profit growth in the coming year (chart 5).
Overall, for 15,000 listed companies in 50 countries, the consensus analysts’ forecast is for aggregate profits to grow by 23% over the coming year.
This is simply crazy. Where is this profit growth going to come from? (apologies to the nit-pickers: ‘From whence will this profit growth come?’)
It is not as if the world is rebounding from a big slump in profits, like it was in 2021 following the Covid lockdown losses in 2020, or in 2010 following the GFC losses in 2008-9.
Profit forecasts appear overly ambitious
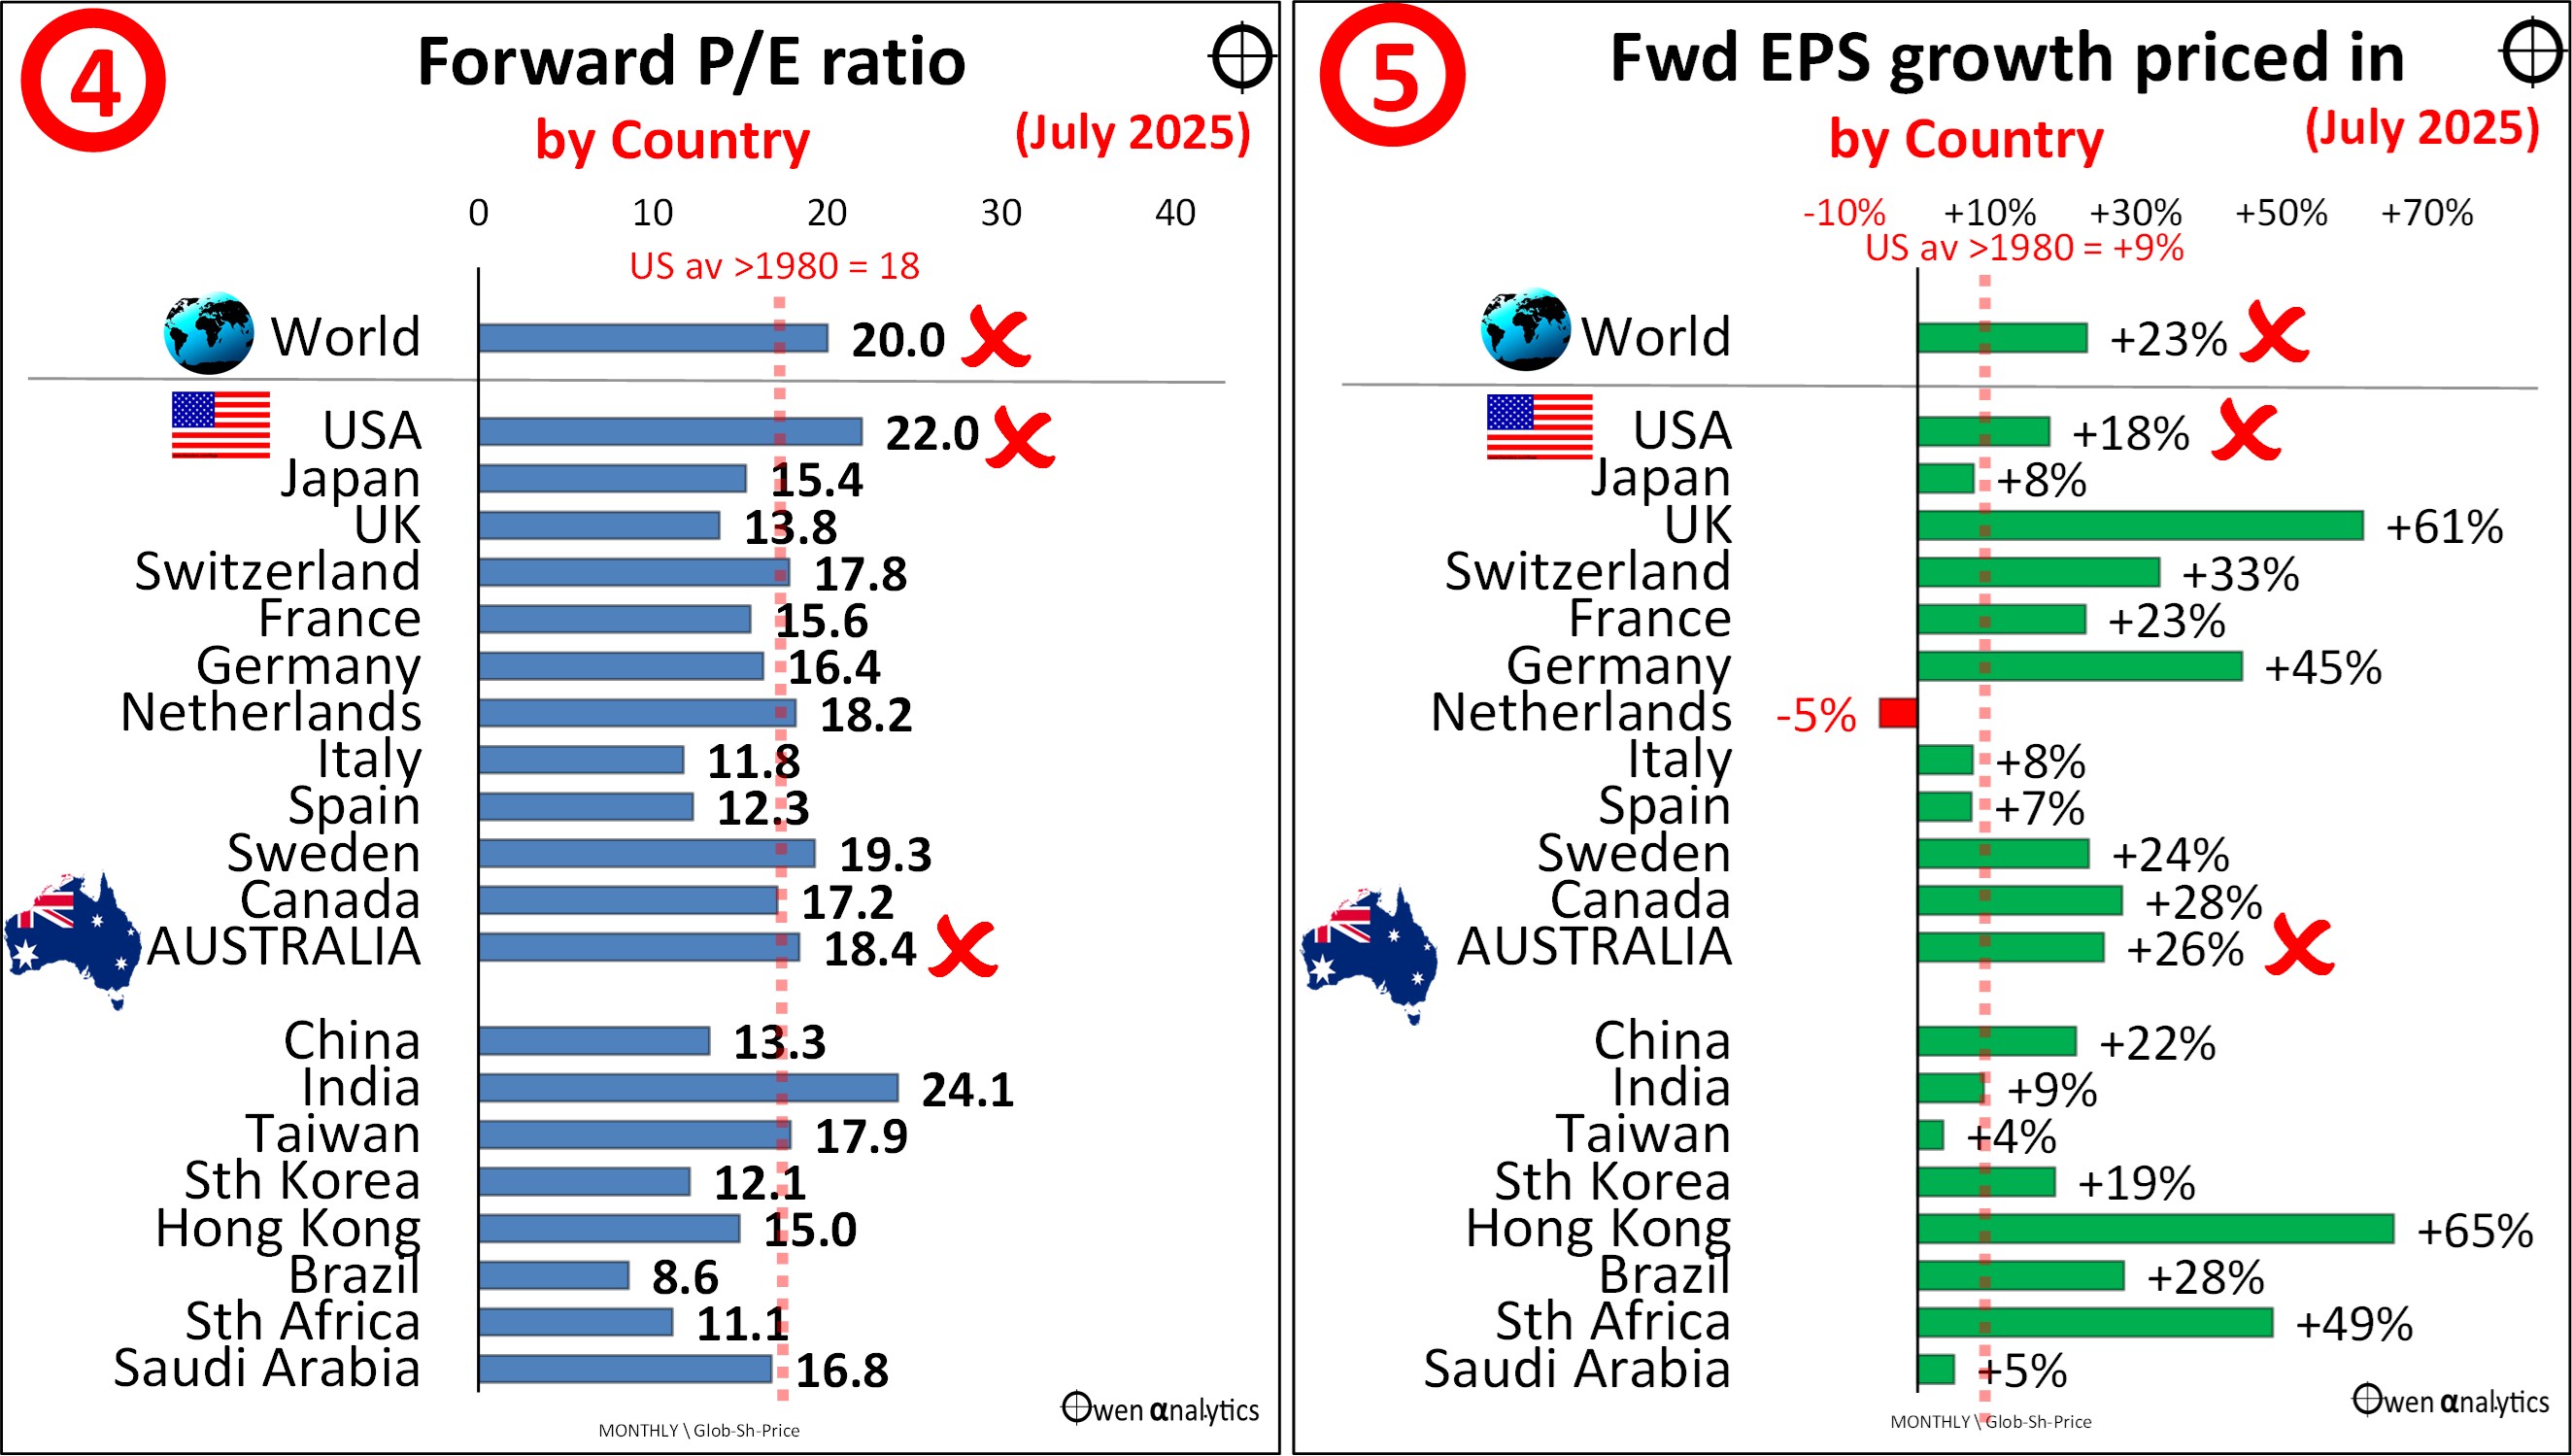
Here is a picture of aggregate annual global listed company profits (based on historical earnings per share numbers on the 15,000 global stocks across 50 countries) since pre-Covid 2018 and 2019 –
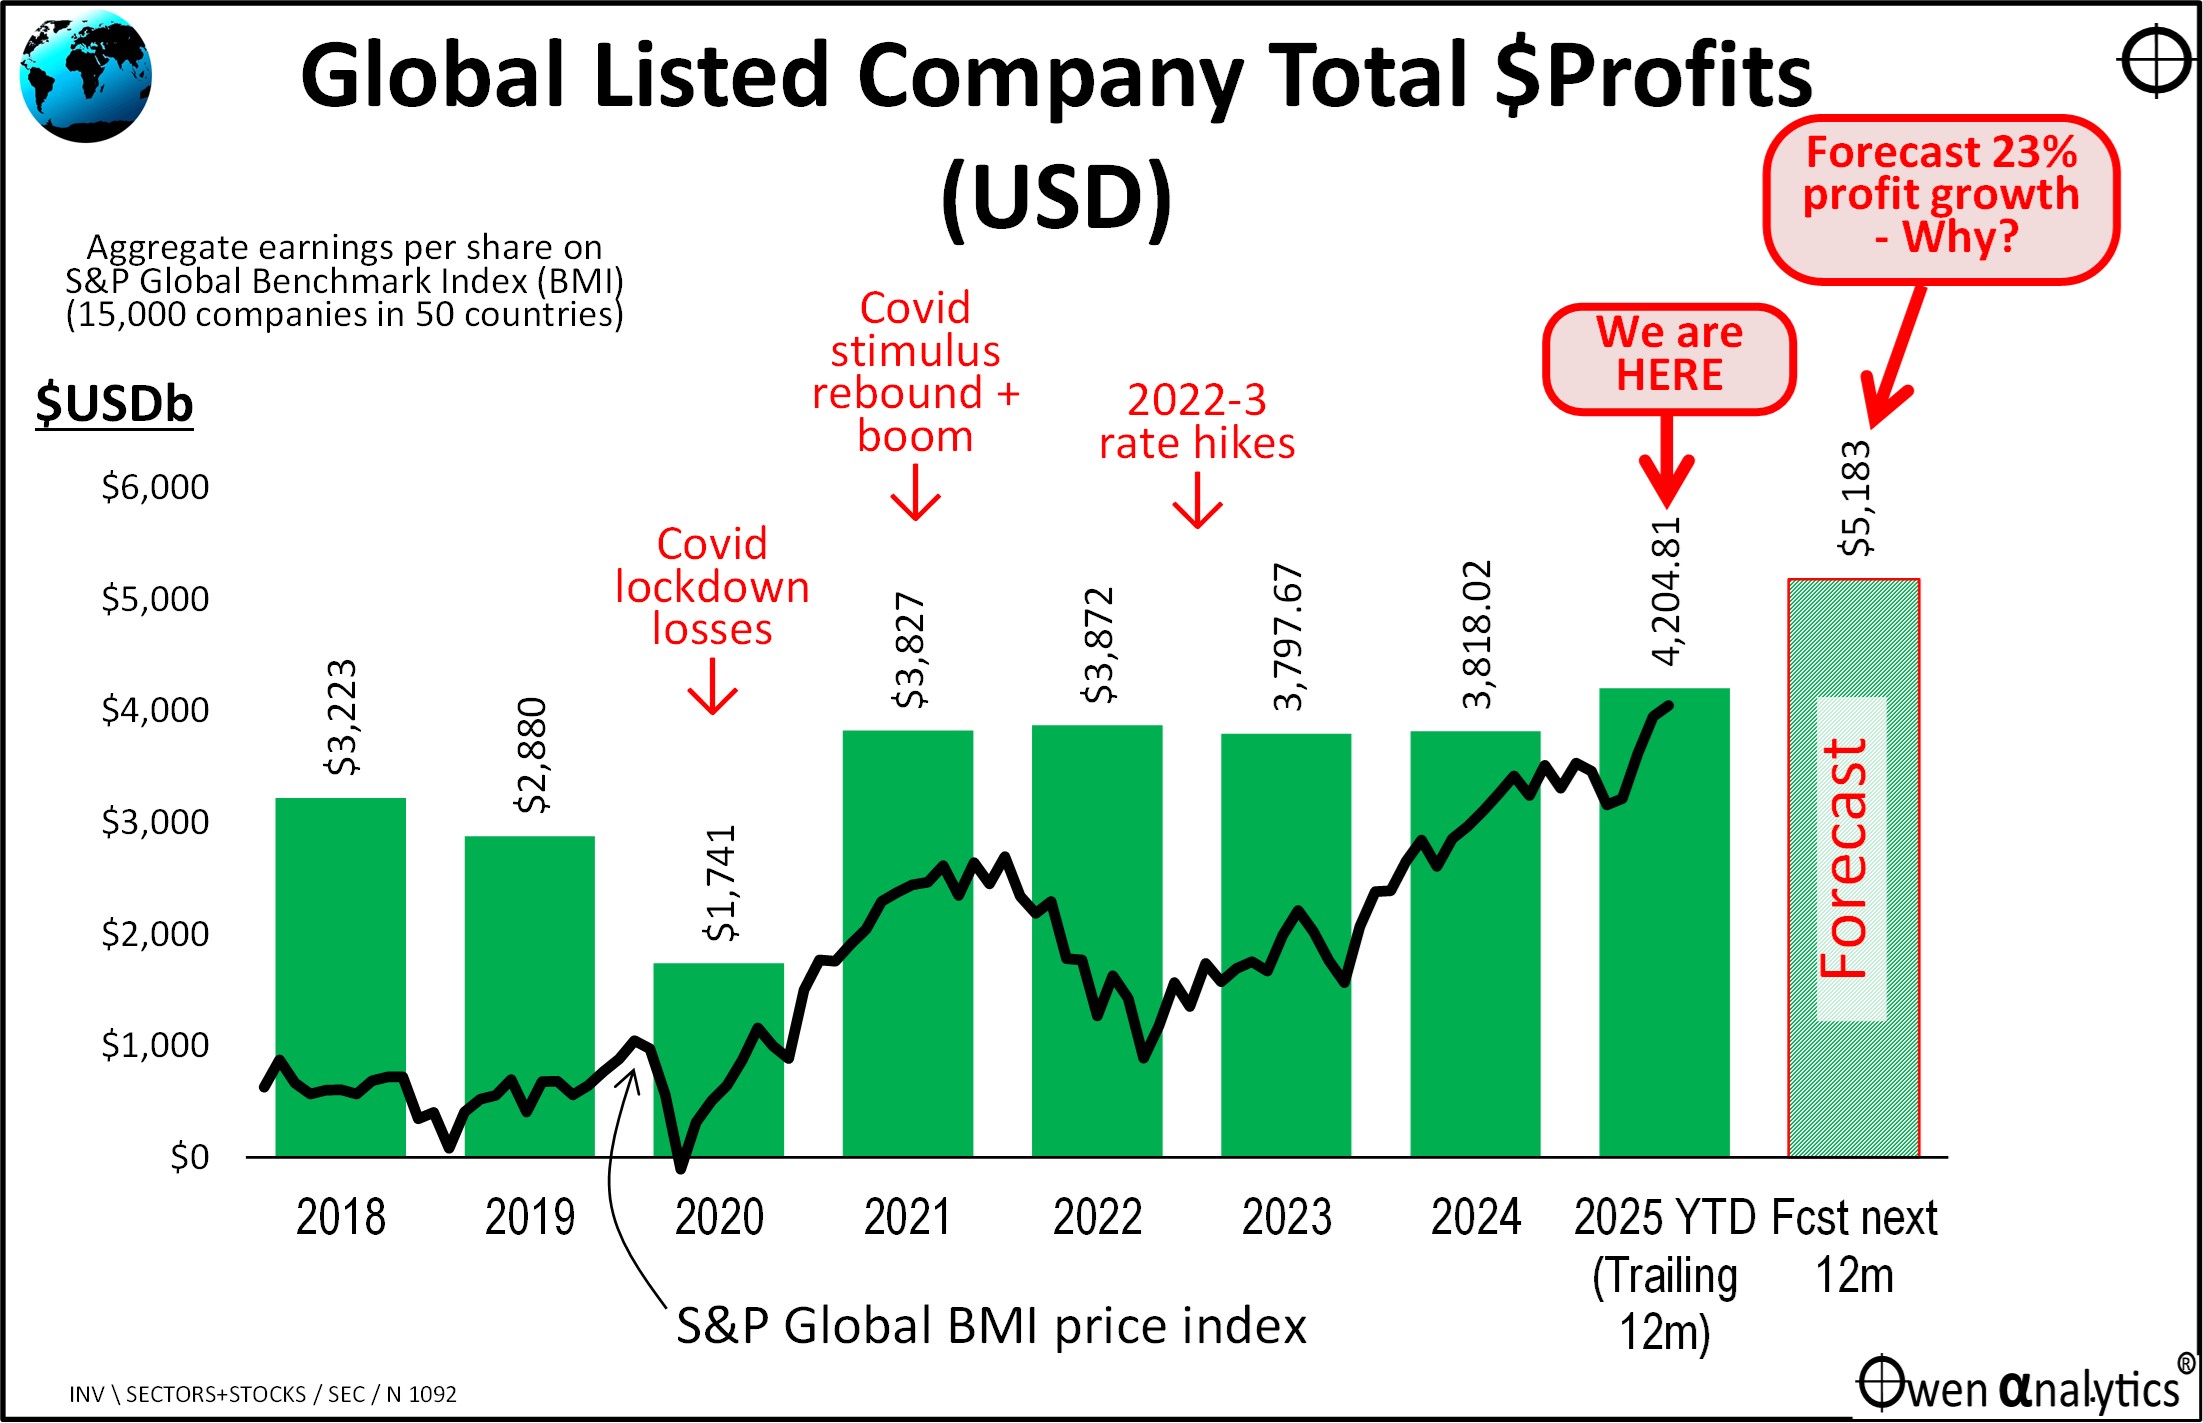
The most recent solid green bar is for the 12 months to July 2025, and the shaded bar at the right is the forecast next 12 months earnings. For some reason this is going to magically jump by +23%!
We can see that global profitability collapsed by -40% in 2020 in the Covid lockdown crisis. But profits rebounded strongly in 2021 thanks to overly generous the monetary stimulus (zero short-term interest rates plus ‘QE’ bond buying to artificially depress long-term interest rates), and fiscal stimulus (governments literally throwing ‘free’ money at anything and everything that moved).
Much of that Covid stimulus money went straight through to corporate profits, so aggregate global profits in 2021 were 33% (or just short of 1 trillion US dollars) above 2019 pre-Covid levels.
After the 2021 profit rebound year, aggregate global profitability was more or less flat in 2022, 2023, and 2024, during the central bank rate hikes to attack inflation that central banks created, then denied, and then ignored before finally waking up to inflation.
After three years of virtually flat profits, aggregate corporate profits have risen +10% in the 12 months to July 2025 – with Nvidia, Microsoft, and Facebook being among the largest contributors.
The problem is that global profits are now being forecast to jump suddenly by an additional +23% or $987 billion in the next 12 months. Why? What is the reason for the current hyper-bullishness on corporate profits?
Future conditions affecting corporate profitability
On the positive side we have –
-
-
- Assumptions of further deep interest rate cuts by central banks (but no recession)
- Prospects of Trump’s tax cuts boosting personal spending and corporate profits
- The ‘TACO trade’ continues – ie Trump backs down when share/bond markets panic sell off
- Hopes of a permanent end to the Russia-Ukraine war, or at least it remains contained
- Hopes that ‘ai’ will dramatically cut corporate costs (staff) and boost profits
- Governments backtracking or delaying expensive and inflationary energy transition policies
- Governments continuing to run big deficit spending programs – much of which ends up directly or indirectly in company profits
On the negative side we have –
-
-
- Inflation remaining above target ranges, slowing further rate cuts
- Slowing economic growth
- Rising unemployment may slow spending/profits and/or escalates civil unrest
- Trump’s continued frenzied tariff announcements, deferrals, side-deals – consumers & companies delay spending, investing, hiring
- Ballooning government deficits/debts send bond yields higher & triggers a major share sell-off
- Rising geopolitical tensions, increasing risks of an accidental escalation into war
Despite the general media negativity, there are actually quite a few positives there. To date, the positives are outweighing the negatives, supporting share price rises over the past year.
I have been over-weight global/US shares in advised portfolios (including my own published ‘10-4 all-weather’ ETF portfolio), on the basis of the positive factors outweighing the negatives.
Profits up by 30% since start of 2018, but share prices have doubled
The black line running through the above chart is the global share price index (S&P Global Benchmark Index). The first and most obvious observation is that global share prices are 97% higher now than at the start of 2018, but aggregate earnings per share (the most recent 12 months to July 2025) are just 30% higher than they were in 2018.
Global share prices have already run well ahead of profit growth, and now analysts are predicting profits will grow by another 23% in the next 12 months alone?
It appears to be a double-layer of over-pricing – overly ambitious pricing per dollar of current profits, plus overly ambitious assumptions of future profit growth.
US profit outlooks are actually more reasonable
Here is the same picture for the US share market (here I use the US S&P500 index) -
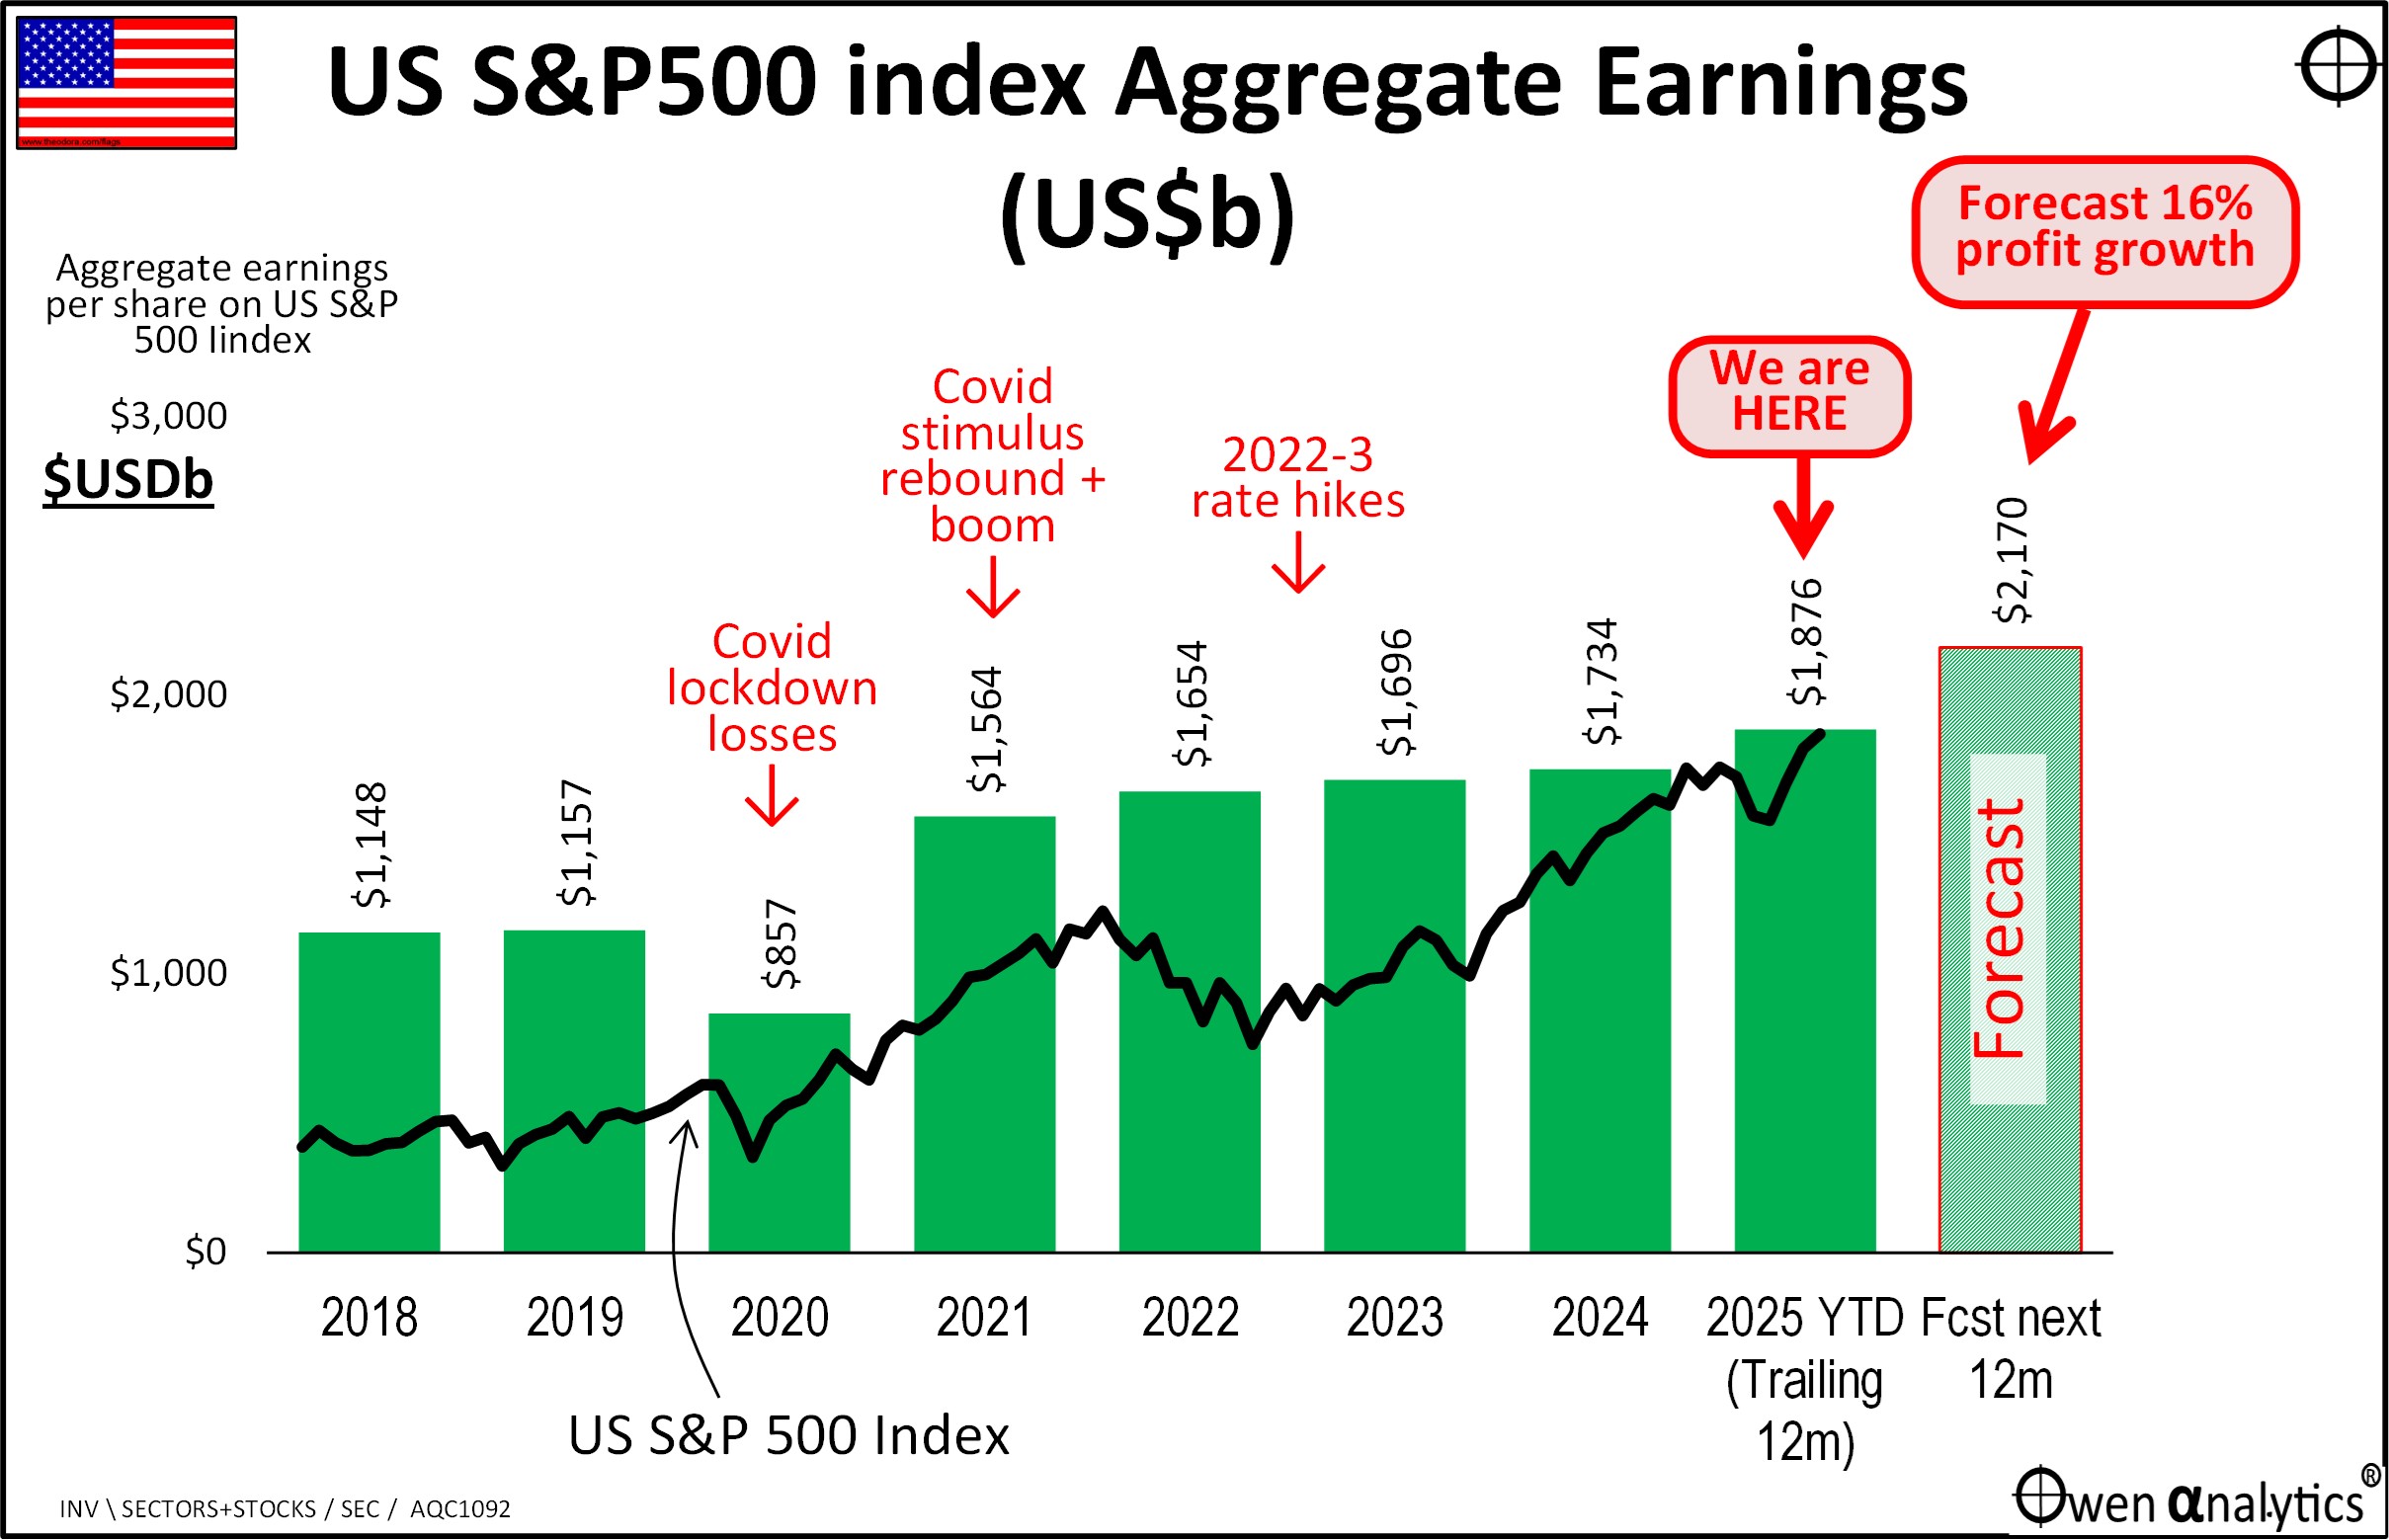
Whereas overall global profitability was flat in 2022, 23, and 24 (previous chart), aggregate earnings in the US have been rising steadily since the 2021 covid rebound year.
In the most recent 12 months to the end of July, US earnings per share rose +8% over the previous 12 months, and are being forecast to rise by an additional 16% in the next 12 months. These are being led by the US tech giants of course.
Note that on chart 5 (forward earnings outlooks) I have put a red dotted line running vertically down the chart. This shows 9% average annual growth in aggregate earnings per share in the US market since 1980. The growth in earnings over the past five years, including the forecast growth in the coming year, is consistent with this long-term 9% average annual growth rate.
So, US companies are just doing what they do best – they just keep churning out aggregate profit growth through all sorts of economic and political conditions.
Not only does the US profit outlook appear less ambitious than the overall global forecast profit rise of +23%, it is actually not entirely unreasonable in light of the current running rate for the Mag-7 (except Tesla of course).
For my review of the Mag-7 stocks – see:
Australia
While the US picture looks almost reasonable, the Australian picture is off with the pixies in fairyland!
Broker analysts are forecasting profits in Australia to magically jump by 26% in the coming year, which is simply crazy. (Note that this was current at the end of July 2025, before the August reporting season for June results. The ASX reporting season has now kicked of – much of it bad news).
The Australian listed market is dominated by the big banks and big miners, The big banks will probably grow earnings by around 4% or 5% over the next year if they are lucky, and that is mostly just inflation. The big banks peaked a decade ago in 2015 in terms of profits and dividends (yes, including CBA), so their recent share price growth has been unsupported by underlying fundamentals.
See my story on CBA –
The big miners are dominated by iron ore, where profits are likely to decline by at least 15% to 20% in the coming year, given iron ore prices are down from last year and volumes are flat, with China still having to export surplus steel it produces (to keep uneconomic steel miss running and keep workers quiet). Further depressing iron ore prices will be new supply from Guinea. Similar story for Woodside & Santos (oil/gas).
On the iron ore miners – see:
Aside from the big banks and miners, the rest of the ASX market is mainly mature, low-growth domestic behemoths like Telstra, Woollies, Coles, Transurban, IAG, ASX, etc. True, there are some global players but for every Brambles that is doing reasonably well on the profit front, there is a CSL with big problems.
Summary
-
-
- Not only do global share markets appear expensive relative to reported profits, dividends, and book values (Parts 1 & 2), the ‘forward’ price/earnings ratios are even higher, as they assume outlandishly high profit growth for the coming year.
- This appears to be a double-layer of over-pricing – overly ambitious pricing per dollar of current profits, plus overly ambitious assumptions of future profit growth.
- It is not just the US – most of the main global share markets have overly ambitions multiples based on overly ambitious profit growth assumptions.
- In fact, the US profit outlooks are probably more achievable than most other countries, including Australia, where pricing is off with the pixies in fairyland!
- When we look at the main positive and negative forces driving global profits, the media always focus on the negatives, but actually there are quite a few positives, and so far the positives are winning.
See other articles in this 6-part series -
‘Till next time . . . . safe investing!
Data for today’s chart: