- Just 7 companies make up 19% of the combined value of the entire 15,000+ companies listed on world share markets, but they produce just 12% of total world profits, and they pay just 3% of total world dividends.
- They are over-priced on just about every measure, but are they worth it? What justifies their astronomical pricing?
- There is a fairly obvious odd-one-out here – which is it?
Together the ‘Mag-7’ make up 30% of the total US stock market value, and the US is 64% of the combined value of all world stock markets. If the combined ‘Mag-7’ were their own separate country, it would be worth more than the next largest country stock market – China, and every other country on the planet.
(NB this story was written after the 27 Jan 2025 mini-sell-off following the release of China's DeepSeek)
Chart A shows how the Mag-7 stack up against the 25 largest stock markets in the world -

In terms of share market values (chart A), The combined Mag-7 come in as the largest country (apart from US itself), worth a combined US$18 trillion.
Individually, Apple, Nvidia, and Microsoft are each worth more than every other country, apart from China, Japan and India. Amazon and Alphabet/Google are in the middle of the table, and Meta/Facebook and Telsa are in the lower one third of countries. (I cover about 70 country stock markets, these are just the largest 25 shown here.)
(Note that I use the term ‘worth’ to describe their market value. My aim in this story is to shed some light on what these companies might really be worth – ie their intrinsic or underlying values. But their current share prices represent the combined knowledge and decisions of millions of investors around the world, so that is what 'the market' thinks they are ‘worth’.)
Where does Australia rank? In terms of share market value, Apple, Nvidia, Microsoft, Amazon, and Alphabet/Google are EACH worth more than the combined 2,000 companies listed on the ASX. .
Profits
While the Mag-7 make up 19% of total world market value, they generate only 12% of total world profits.
Chart B shows the latest 12 months profits for each company and country, ranked in the same market value order as Chart. All numbers are in US dollars to allow comparisons.
Together, the Mag-7 produced US$460b in profits, but that was only half the total US$ profits produced by Chinese listed companies, and only a fraction ahead of the Japanese market.
Apple, Microsoft and Google are all near US$100b in annual profits, which is mind-boggling, and a testament to their monopoly pricing powers, delivering incredibly high profit margins.
Dividends
The Mag-7 pay only around one tenth of their profits out in dividends (Chart C). Stock buy-backs are the preferred method of distributing their enormous cash profits as buy-backs reduce the number of shares on issue and boosts earnings per share.
No self-respecting high-growth tech company pays dividends. It is a sign that they have run out of new ideas or out of room to grow. Usually it is when the founder dies or retires, and the company shifts from a founder-led growth star, to a mature, manager-led behemoth. All except Nvidia (and probably Tesla) have made this shift from founders to managers.
Pricing = off the charts expensive
Chart D shows trailing price/earnings (‘p/e’) ratios (current price divided by the most recent 12 months profits – ie how many dollars am I paying per dollar of reported profits). As a rule of thumb, a p/e of anything above above around 20 is getting expensive (ie paying more than $20 per $1 of profits).
On Chart D, each of the Mag-7 is trading on higher (more expensive) p/e ratios than every country.
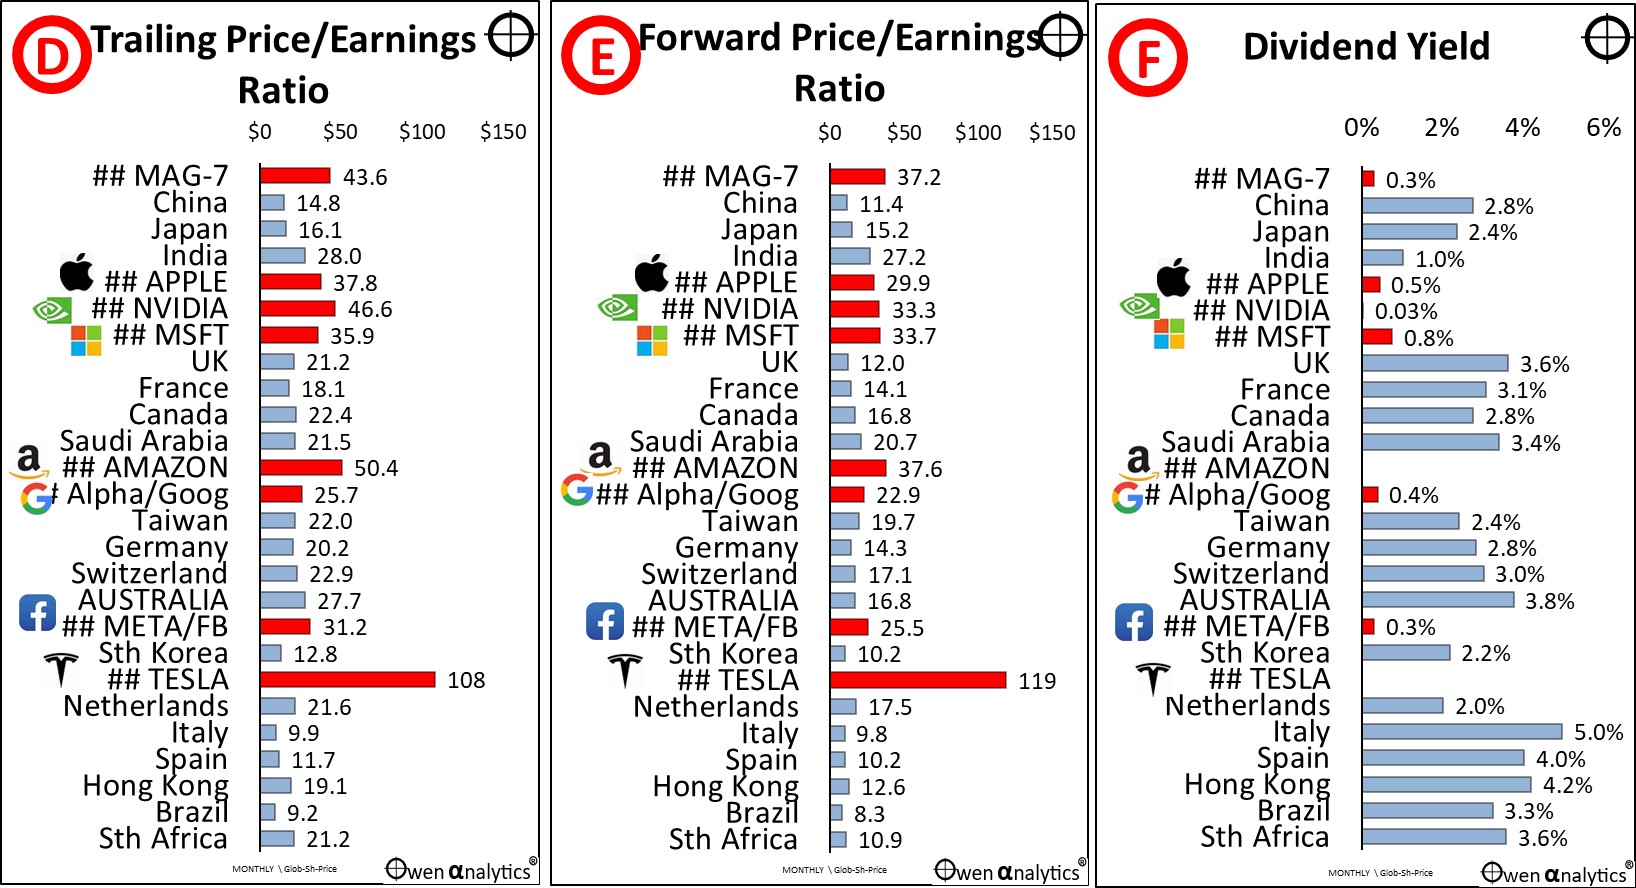
Chart E is another measure of pricing – the ‘forward price/earnings’ ratio – which is the current price divided by forecast next 12 month’s profits. Logically this makes more sense as a measure of value because when I am buying a share in a company, I am buying it for its future profits, not past profits.
Again, the forward p/e ratios for the Mag-7 are also higher than every country stock market.
Chart F shows the dividend yields – you’ll need a microscope to see the Mag-7!
Why are people willing to pay $30, or $40, or even $100 per dollar of profits (earnings)?
Returns on Equity
The answer is in Chart G - returns on equity. What I am buying is not just one year of the company’s profits, it is the company’s overall profit generating ability. Most companies can generate returns on equity averaging around 10-15%. If returns on equity were higher than that, competitors would compete away the margins, and new competitors would be enticed into the market to increase supply and lower prices and profits back to ‘normal’ levels.
The Mag-7’s returns on equity dwarf the rest of the world -
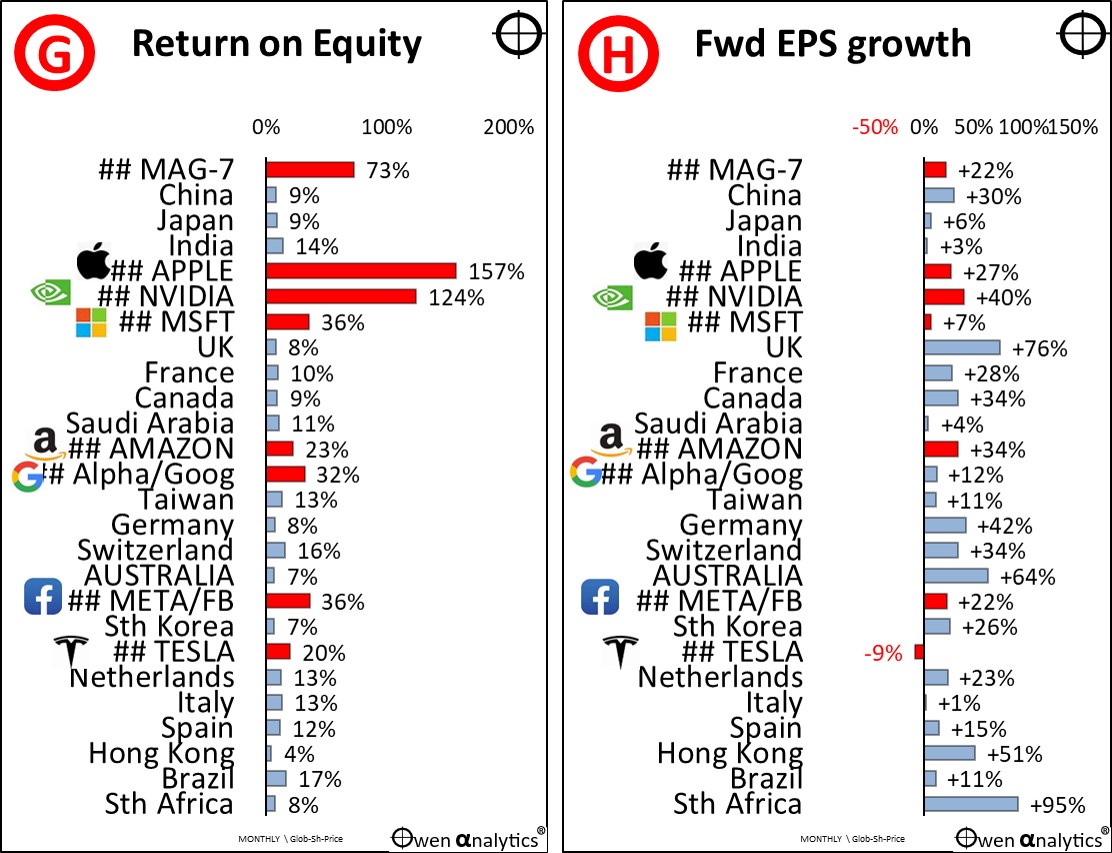
The incredibly high returns on equity for the Mag-7 are a function of several factors – high margins, high levels of brand marketing, monopoly pricing, market power over suppliers, and very low capital requirements. Their main assets are not land, buildings, factories, or inventory, all of which require large amounts of capital. Their main assets are their brands (and resultant pricing power) and intellectual knowhow.
The Mag-7 returns on equity are astronomically high. As a group, they are generating 73% return on their combined equity – ie generating $73 of profit for every $100 of capital on balance sheet. Where do the profits go? Out of that $73 of profits, around one tenth is paid out in dividends (Amazon and Tesla do not pay divs), they buy back their own shares with another third of the cash, and they plough the rest back into the business – in marketing, buying up competitors, paying off politicians, legislators, and regulators, and most-importantly, investing in future growth (the current fad is ‘a.i.’).
Future growth – very pedestrian, given their pricing!
Chart H shows the expected growth in earnings (profits) next year. Shareholders are paying $30-$50 per dollar of profit (ie 30-50 price/earnings ratios) in the Mag-7 companies because they have been using their high returns on equity to invest in future growth.
However, this is where the Mag-7 story starts to run out of steam. Those profit growth numbers in Chart H are not very inspiring. As a group, their expected profit growth is only 22%, which is more or less what most other countries are doing, and most countries stock markets are stacked fully of old, mature or decaying dinosaur companies, like the ASX. (In the case of the ASX, the 60%+ profit growth next year is mainly expected boost in iron ore profits from BHP / RIO / FMG, plus also good profit growth expected from the big banks, which is highly unlikely!)
US companies on the whole have a long history of around 70-75% of companies beating their earnings numbers each reporting season, but it looks increasingly like the high-growth founder-led days are numbered. They are simply running out of room to grow at the same pace as their younger, founder-led days. That is to be expected of course, as they have now grown into global giants that dominate their respective markets. The problem is that they are still priced as if they will continue their earlier growth phases into the future, forever!
Conclusion
I like their super-high returns on equity. Most can probably continue to obtain very high profit margins thanks to their enormous branding and marketing power. They are facing anti-trust (anti-monopoly) actions on several fronts and also face Chinese threats – trade restrictions and competition. They may struggle to extract the promised returns on the hundreds of billions being spent on ai.
The problem is pricing – for the quite modest rates of growth. There is little or no margin for error – and certainly no ‘margin of safety’.
Spot the Odd one out?
It is easy to spot which of the Mag-7 does not really belong. Telsa is by far the most over-priced, but it has the lowest returns on equity, and its growth has hit a wall. Elon Musk is somewhat distracted by a dozen other things.
Initially the market priced Tesla as a ‘tech’ stock and its share price skyrocketed in the 2020-21 covid stimulus /tech boom. Then investors realised it was just another car maker, and its share price tanked in 2022-3 and into 2024 (while Toyota doubled). But then Tesla roared back, more than doubling in late 2024 as Musk bought himself a President. I guess the market is banking on Musk getting the government (ie himself) to clear the regulatory barriers to Tesla’s planned driverless cabs across the US. And who knows what else.
‘Till next time – safe investing!
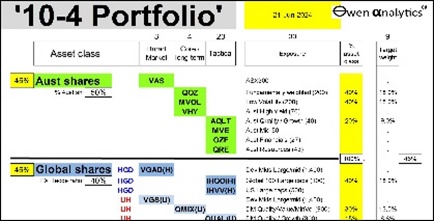
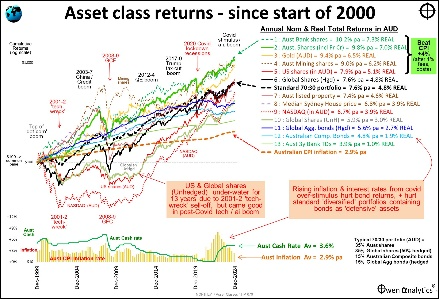
I have been bullish on US/global shares in the current boom – see my actual long term ETF portfolio here -
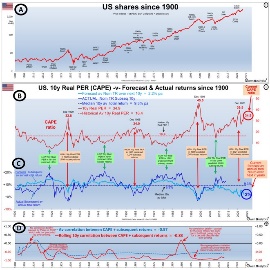
For more on the pricing of the US share market, see -
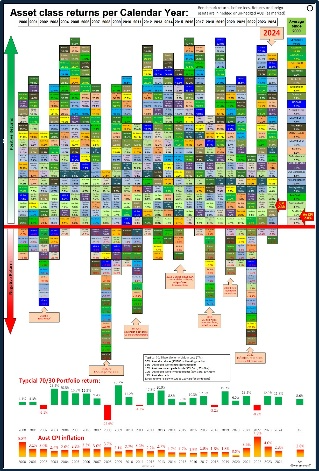
For my end of year wrap-up on asset classes -
Or visit my web-site for a wealth of fact-based articles on a wide range of relevant topics for inquisitive long-term investors.