Key points:
-
-
- Most share markets – including US and Australia in particular - appear to be very expensive on three widely-used pricing metrics – price/earnings ratios, dividend yields, and price-to-book value ratios.
- Each indicates high pricing relative to historical averages, and also relative to underlying fundamentals like profitability and sustainable growth rates.
- The US in particular stands out as being expensive on these measures, even after allowing for its stronger fundamentals relative to other markets.
- Given the Australian market’s much weaker underlying fundamentals, Australia is probably even more over-priced than the US at current levels.
- These simple pricing indicators are not a bad starting point, but they gloss over a host of differences in each market, like returns on equity, dividend pay-out ratios, earnings growth rates, buy-backs, sector mix, and economic conditions – which are explored in later articles in this series.
This article is Part 2 in my 6-part series on world share market pricing. The articles in this series are:
-
-
- Part 1: Share market Pricing per country – How does your country rate? (11 Aug 2025)
- Part 2: P/E ratios, Dividend Yields, Price-to-Book value (today’s article)
- Part 3: Forward P/E ratios and Earnings growth assumptions (coming soon)
- Part 4: Growth rates for Profits & Dividends (coming soon)
- Part 5: Profit Margins & Returns on Equity (coming soon)
- Part 6: PEG ratios & Buffett/Graham’s 8.5 rule – what price growth? (coming soon)
This series is intended to be read in sequential order, so most readers would probably get more out of today’s article if they have already read the prior articles via the links above.
Why do I study share market pricing, and why is it important?
This is not just some idle exercise I do to fill in time. I do it because making judgements and decisions about likely future relative returns is the second most important part of portfolio construction and management (most important is Risk). The importance of understanding pricing and valuations is based on a very important set of beliefs that runs counter to accepted finance theory (dogma).
Specifically, I believe that pricing has a material bearing on likely future returns. Eg if you buy any asset at a vastly over-valued price at the top of a frenzied boom, you will invariably achieve lower than overall average returns from that asset. Conversely, if you buy at a vastly over-sold price in the depths of a panic sell-off, you will invariably achieve better than average returns, and certainly better returns than those who bought the exact same asset for a much higher price only a short time ago at the top of the boom before the bust.
The above may be obvious to you and I, but it runs against the foundations of academic finance and portfolio management theory over the past half century (the ‘Efficient Markets Hypothesis’), which denies the very existence of over-priced booms or over-sold busts, and denies that any asset is ever either ‘cheap’ or ‘expensive’, but is at all times at a ‘fair value’ price arrived at solely as the result of completely rational, logical calculations of dispassionate investors who all take into every piece of relevant information that is available instantly and freely to every investor in the world.
There are so many elements of the above statement that every sane investor knows full well are complete nonsense, but let’s not forget that it is still the dominant theory that has spawned countless PhDs, shelves full of finance textbooks, quite a few Nobel Prizes, and thousands of academic careers to this day. (Trust me, I taught this stuff!)
In the real world, valuations and timing matter. We all know that there are frenzied booms that lure people into paying too much (or worse still, borrowing to buy in a boom), and we all know that there are frenzied busts where people panic and sell out too cheaply.
In the real world, nobody ever gets the ‘average’ or ‘median’ return. Half of all investors get higher than the overall ‘median’ return, and sometimes quite a lot higher; and the other half of investors will get lower than the median return, and often quite a lot lower. The difference is when they buy and at what price.
Timing and valuations are everything. (And, no, ‘Dollar Cost Averaging’ does not solve this. When you start, and whether it is in a boom or a bust, are still the most important determinant of returns even with DCA.)
Three simple pricing ratios to start with
Today’s chart shows three widely used pricing measures – Trailing price/earnings ratios, Dividend yields, and Price to Book value ratios – for the 20 largest share markets in the world. (All data is to end of July 2025):
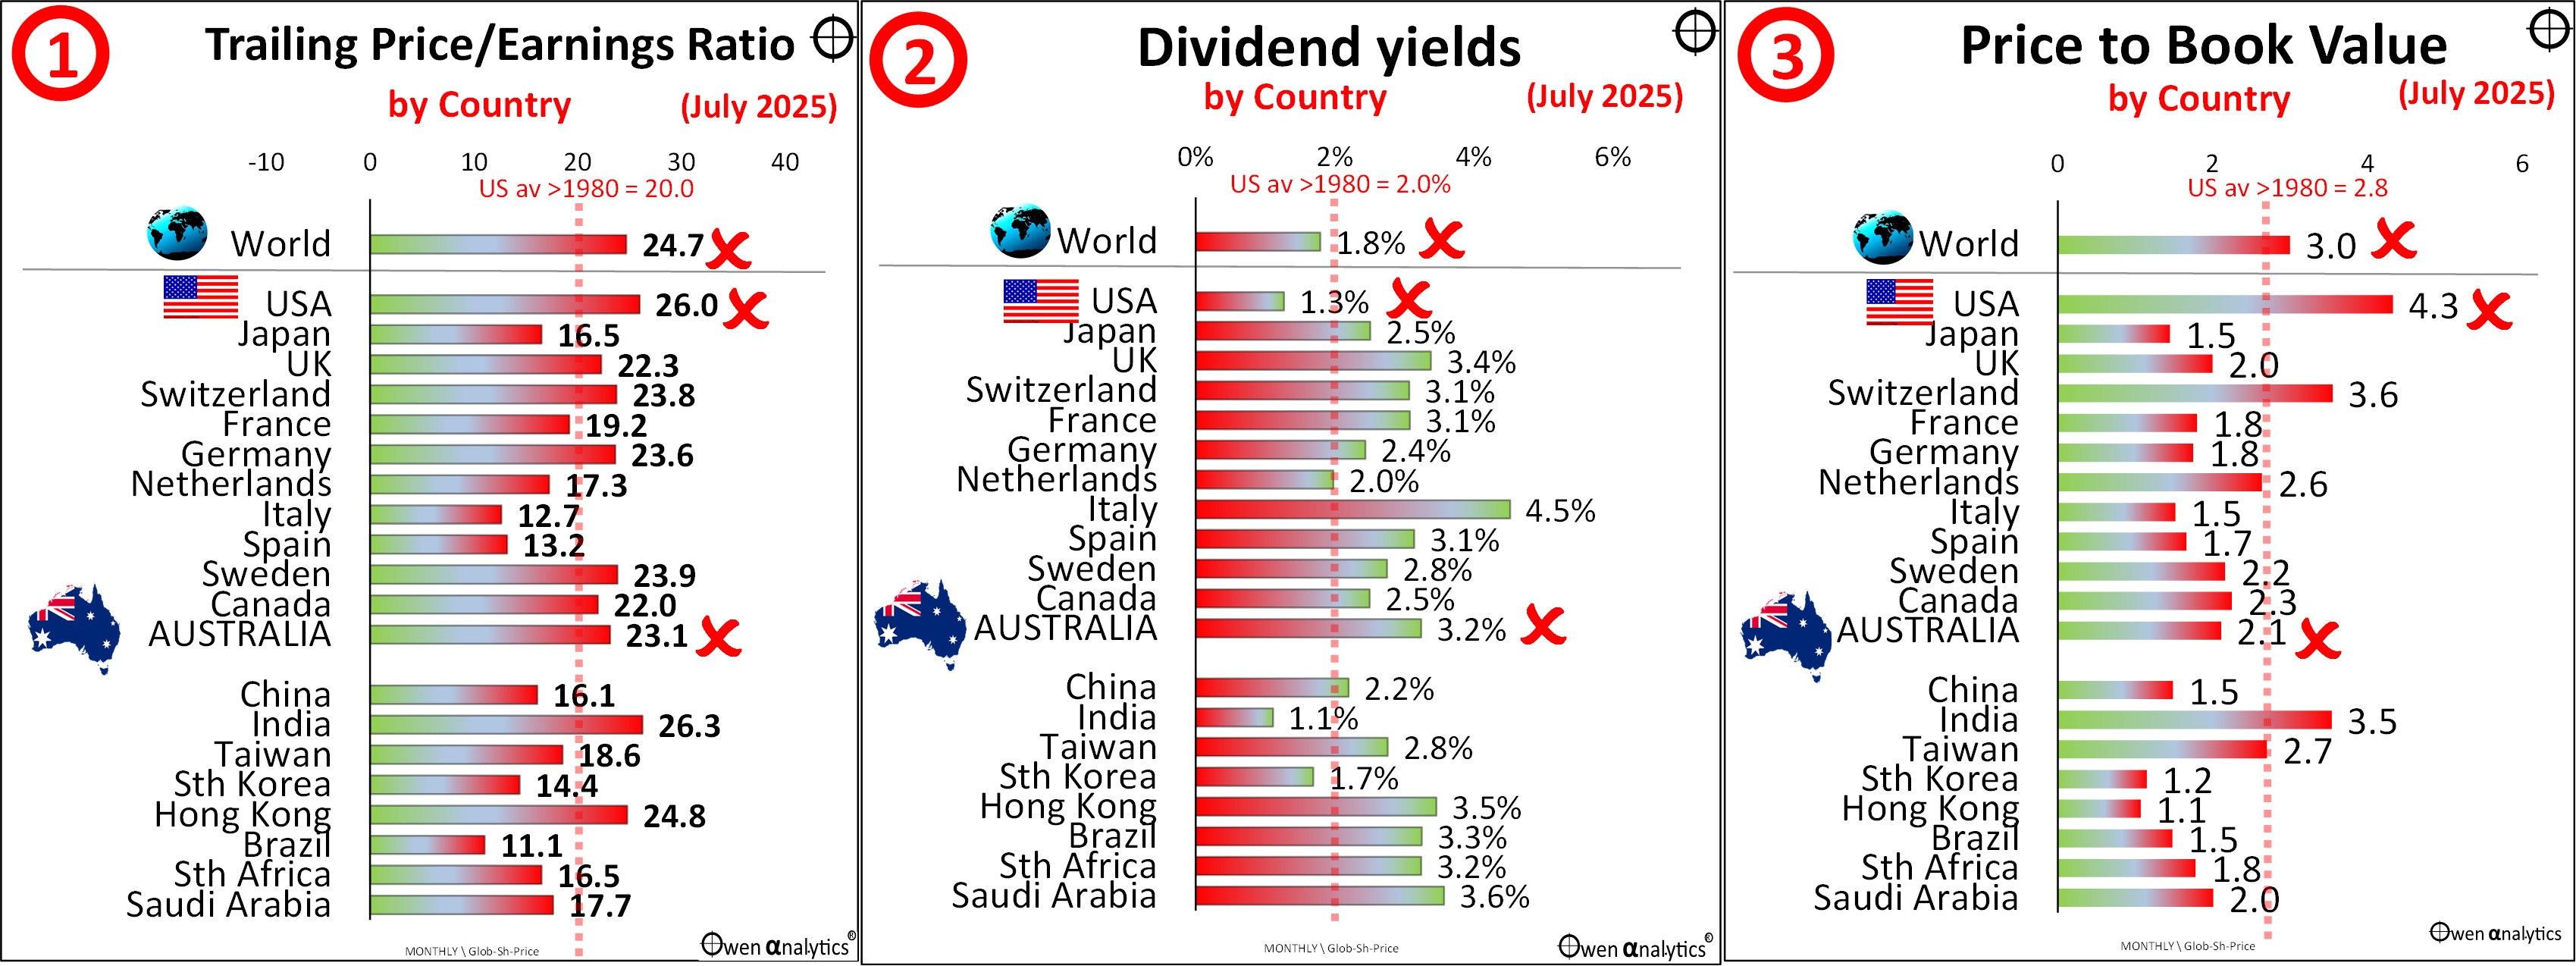
The data in the left chart (P/E ratios) and middle chart (dividend yields) are the same that I used in the chart in Part 1 - Share Market Pricing per Country – how does your country rate? (and, for consistency, in other Parts in this series).
In these charts I have not placed country share markets in their strict size order. The upper dozen markets are ‘developed’ (or rich world) countries, starting with the US as the largest, Japan, UK, then European countries in order of size.
I show Canada (6th largest market in the world) and Australia (12th largest) at the bottom of the rich world group as they are most like commodities/emerging markets. Each of the charts in this story has the same country order.
Countries in the lower section are generally classified as ‘emerging’ (or ‘developing’, although definitions vary), and they are in descending order of size, starting with China.
US -v- US historical averages
In each chart, in addition to bars for each country, I show the US average or median since 1980 as a red dotted vertical line, to highlight current position of the US relative to its historical experience, as the US is the main driver of global markets, not just in values and volumes, but also in market sentiment.
It is immediately evident from the three charts that the US market is currently significantly more expensive than its own historical averages since 1980 on all three measures – higher price/earnings ratio, lower dividend yield, and higher price/book value ratio.
Later articles in this series explore whether or how the fundamental structure of the US market has changed over time that may justify higher ratios (‘This time is different!’ – but is it?). But for now, the initial picture from this quick snapshot is that the US market (and most other countries here) appear very expensive on all measures.
Chart 1 – Price/Earnings ratio
The P/E ratio is probably the most common, and simplest, indicator of pricing of a company or sector or whole country.
It is the current market value divided by aggregate profits from that company, sector, country, etc for the most recent 12 month period. The word ‘trailing’ refers to the fact that it is based on the actual profits reported over the most recent (ie past) period.
NB. The term ‘earnings’ and ‘profits’ are interchangeable in this context. ‘Earnings’ means reported after-tax profits from the company, or aggregated across an entire sector, country, region, etc.
‘Trailing’ -v- ‘Forward’
NB. The ‘trailing’ P/E ratio is quite distinct from the ‘forward’ (or ‘prospective’) P/E ratio, which is based on the forecast profits over the coming year. The forward ratio is covered in the next article in this series (chart 4).
Where a report or article refers to just a ‘price/earnings ratio’ without specifying whether it is ‘trailing’ or ‘forward’, it is generally safe to assume that it is referring to the ‘trailing’ P/E.
The trailing P/E ratio is a measure of how many dollars (or euro or yen, etc) people are currently paying per dollar (euro, yen, etc) of profits. If the share price is $100, and earnings per share are $5 per share, the trailing P/E ratio is 20. The market is paying $20 per $1 of earnings.
(Warren Buffett and Ben Graham preferred trailing earnings over forecast earnings, because forecasts are vague and almost always wrong. They also favoured using 3-year average trailing earnings to smooth out short-term/temporary distortions.)
As the P/E ratio is the most common and simplest indicator of pricing, it is subject to a number of difficulties. For example, it glosses over a host of differences within each country, eg different sector mix, tax rules, regulatory regimes, economic conditions, interest rates, political climate, weather events, etc.
What is a high/expensive P/E ratio?
Later articles in this series look at this further, as what is a ‘fair’ or ‘justified’ value per dollar of earnings depends on factors unique to each company and market, including dividend pay-out ratios, returns on equity, earnings growth rates, cost of equity, discount rates, and required equity risk premia.
However, one simple rule of thumb for starters is 20. Despite all of the differences between different conditions in different markets, and differences over time, I have found in my 43 years in financial markets, that a P/E ratio higher than 20 is an initial red flag that it is likely to be expensive on other more detailed analysis.
A company or country, etc with a P/E ratio above may be expensive for good (justifiable) reasons, but anything above 20 is a red flag for me.
High P/E does not always mean expensive
There are exceptions to this rule that a high P/E is a sign of expensive pricing. The most obvious one is that a company or sector or market can have a very high price/earnings ratio when earnings are temporarily depressed after big losses.
For example, after the huge losses and cuts to profits in the 2008-9 GFC, the US S&P500 index was trading at an overall market P/E ratio of 123 in early 2009. That was at the bottom of the market crash when the market was actually very cheap, despite its extraordinarily high P/E ratio.
Likewise, after the big Covid lockdown losses posted in mid-2020, the US market was trading on P/E ratios above 40 (and the ASX was above 60), when share markets were actually cheap after the Covid lockdown sell-off, not expensive.
The lesson is – the P/E ratio is not just about pricing (the ‘P’), it is also just as much about the level of earnings (the ‘E’), especially after big losses or profit cuts.
US historical median P/E ratio
This rule of thumb P/E of 20 just also happens to be the median trailing P/E ratio for the US share market since 1980 (vertical red dotted line on Chart 1). The current trailing P/E for the US market is 26, which is well above the median 20.
Note that for this exercise I use the S&P1500 Composite index (1,500 large, medium, and small companies) as it offers a more comprehensive picture of the overall US share market than the much narrower S&P500 index which is just the largest 500 companies. At the end of July 2025, the trailing P/E ratio for the narrow S&P500 index was actually a significantly higher (more expensive) 29.3, compared to 26.0 for the broader S&P1500 index.
What is a low/cheap P/E ratio?
Conversely, any P/E ratio below say 10 looks like it might be cheap. But it also may be cheap for a reason – like lousy assets, lousy products, lousy management, lousy prospects, or political unrest or hyperinflation in the case of a country, etc.
Bottom line – high P/E ratios do not mean ‘Sell’, and low P/E ratios do not necessarily mean a bargain.
Currently, Brazil is cheapest with a rather low P/E of 8.6. It is also dominated by sectors that should rightfully have low P/E ratios – commodities producers (mainly iron ore, oil/gas) and banks.
Current P/E ratios are too high in most countries
The overall world share market price/earnings ratio is a very high 24.7, and the main culprit is the US.
The US market at 26 is 30% higher than its historical average (and the narrower S&P500 index of US large companies is even higher at 29). This does not automatically mean the US market is 30% over-priced, as this only one very crude measure, and is taken further in later articles in this series. But it is certainly an initial red flag indicating possible/likely over-pricing.
On other ways of assessing the US market pricing – see:
Australia also gets a red flag ‘X’ because its P/E ratio is well above its historical median P/E of 16.6 since 1980. It should have a P/E well below 20 for the same reason as Brazil – its share market is dominated by the same two sectors that should trade at low P/E ratios (eg no higher than say 15) –
- banks (due to their extreme leverage, high sensitivity to interest rates and economic cycles, political / regulatory/ compliance risks, and heavy concentration in one market – housing mortgages), and
- miners, which are essentially leveraged bets on commodities prices (operational leverage from high fixed cost bases, and financial leverage from debt), and they are at the whim of global commodities demand and prices over which they have no control.
Later articles in this series also point out that the Australian share market has a lower justified or fair-value P/E ratio than the US market because of its fundamentally lower returns on equity, higher dividend pay-out rates, and lower earnings per share growth than the US market.
Chart 2 - Dividend yields
The dividend yield is total annual dividends divided by the market price (market value) for a company, sector or country.
Just as with Price/Earnings ratios, dividend yields are also subject to all sorts of differences between markets, and differences over time.
For example, Australia’s current dividend yield of 3.2% is one of the highest in the world, but it is actually very low (ie expensive in terms on the price paid per dollar of dividends) compared to the history of the Australian share market. Consequently I give it an ‘X’ to indicate a sign of over-pricing of the local ASX market, despite it being a relatively high dividend yield in world terms.
Even when we add the benefit of franking credits on dividends from Australian companies to Australian investors (which was 1.1% for the ASX300 index in 2024/5FY), the current yields are still near record lows for the local market.
Conversely, Japan’s current dividend yield is much lower than Australia’s, but it is very high relative to most of Japan’s history, largely as a result of a host of changes in the macro economy (eg much lower Yen, QE, low interest rates, etc), as well as micro reforms (including reforms to governance and market structure).
For more on Australia’s dividend yields, see -
On chart 2, I have given an ‘X’ to the overall world dividend yield, and to the US market, as both are at very low (ie very expensive per dollar of dividends) in historical terms.
The 1.3% dividend yield for the US market is well below its post-1980 median of 2.0%. The only time overall dividend yields in the US market were lower than today was at the end of 1999 at the top of the late 1990s ‘dot-com’ boom right before the 2000-2 ‘tech-wreck’ crash and US/global recessions.
Chart 3 - Price to Book Value
This is the market value of a company or market divided by the net value of its assets (ie assets less liabilities on balance sheet). As with price/earnings ratios and dividend yields, it is also just a quick, relatively crude measure that is subject to a host of differences between industries and markets, including different accounting and tax rules, eg relating to capex, depreciation, goodwill, and other intangibles.
For example, banks should generally trade at prices not far above their book values because of their extremely high gearing levels, their high sensitivity of the value of their assets (mainly loans) and securities for loans (mainly real estate) to interest rates and economic cycles, and their liquidity mismatch (banks borrow short and lend long on illiquid assets that are hard to sell in a rush), making them vulnerable to panic ‘runs’ on deposits.
Also, because bank deposits are guaranteed by governments in most countries, banks face huge regulatory burdens, constraints, and costs.
Consequently, countries in which banks make up a large proportion of their share market (like Australia and most emerging markets) should trade a relatively low overall price to book ratios.
‘Asset-lite’ companies
On the other hand, some companies have very little in the way of assets on balance sheet but rely more on intellectual property (knowhow, innovation), brand power, and/or virtual monopoly pricing power. Most of the US tech giants are like this. Nvidia is priced at 53 times its book value, Apple is on 51, Microsoft is on 12, Meta/Facebook is on 10, Tesla is on 14.
What makes these high price/book value ratios even more extraordinary is the enormous amount of cash some of these companies are carrying on balance sheet. This current tech boom is very different to the late 1990s dot-com boom when the price/book value ratio reached 5.0. Today it is almost that high at 4.3.
These giants have pushed the overall price/book ratio of the US share market to more than 4, which is extraordinarily high in historical terms. Ordinarily, a price/book ratio above around 2 is a red flag. For Warren Buffett and Ben Graham, any price/book ratio above 1.5 was a sign of likely over-pricing. It is an indicator not just of high pricing per dollar of net assets, but also an indicator of likely artificial over-valuation of asset on balance sheet.
The big question mark over the high US price/book ratio is whether the hundreds of billions being spent on ai / data centre infrastructure will generate sufficient returns on the enormous capex being spent. History is littered with over-investment booms and busts involving euphoria created by new technologies – canals, railroads, radio, mainframe computers, the internet, collateralised housing debt instruments, etc. Too much money being thrown at world-changing ideas always lead to euphoric over-priced booms and devastating busts.
Australia
The Australian share market is trading at more than 2 times book value, which is also a big red flag given it is dominated by the big banks and big miners. Both sectors are ‘capital-heavy, highly leveraged, and highly cyclical, and should trade not far above book value (ie price/book ratio of 1) for the same reasons they should trade at relatively low price/earnings ratios.
The price/book ratio for the overall Australian market did get above an all-time high of 3.2 in late 2007, right before the 2008-9 GFC crash. Australia’s price/book ratio reached 2 in mid-1968 at the top of the late 1960s speculative mining boom just before the early 1970s crash. It also reached 2 in September 1987 at the top of the 1980s speculative take-over boom right before the October 1987 crash. The current level is certainly a red flag, especially given the sector mix dominated by banks and miners.
This chart shows price to book value ratios for the Australian and US share markets since 1990, highlighting extreme pricing once again in the US, and relatively modest levels in Australia –
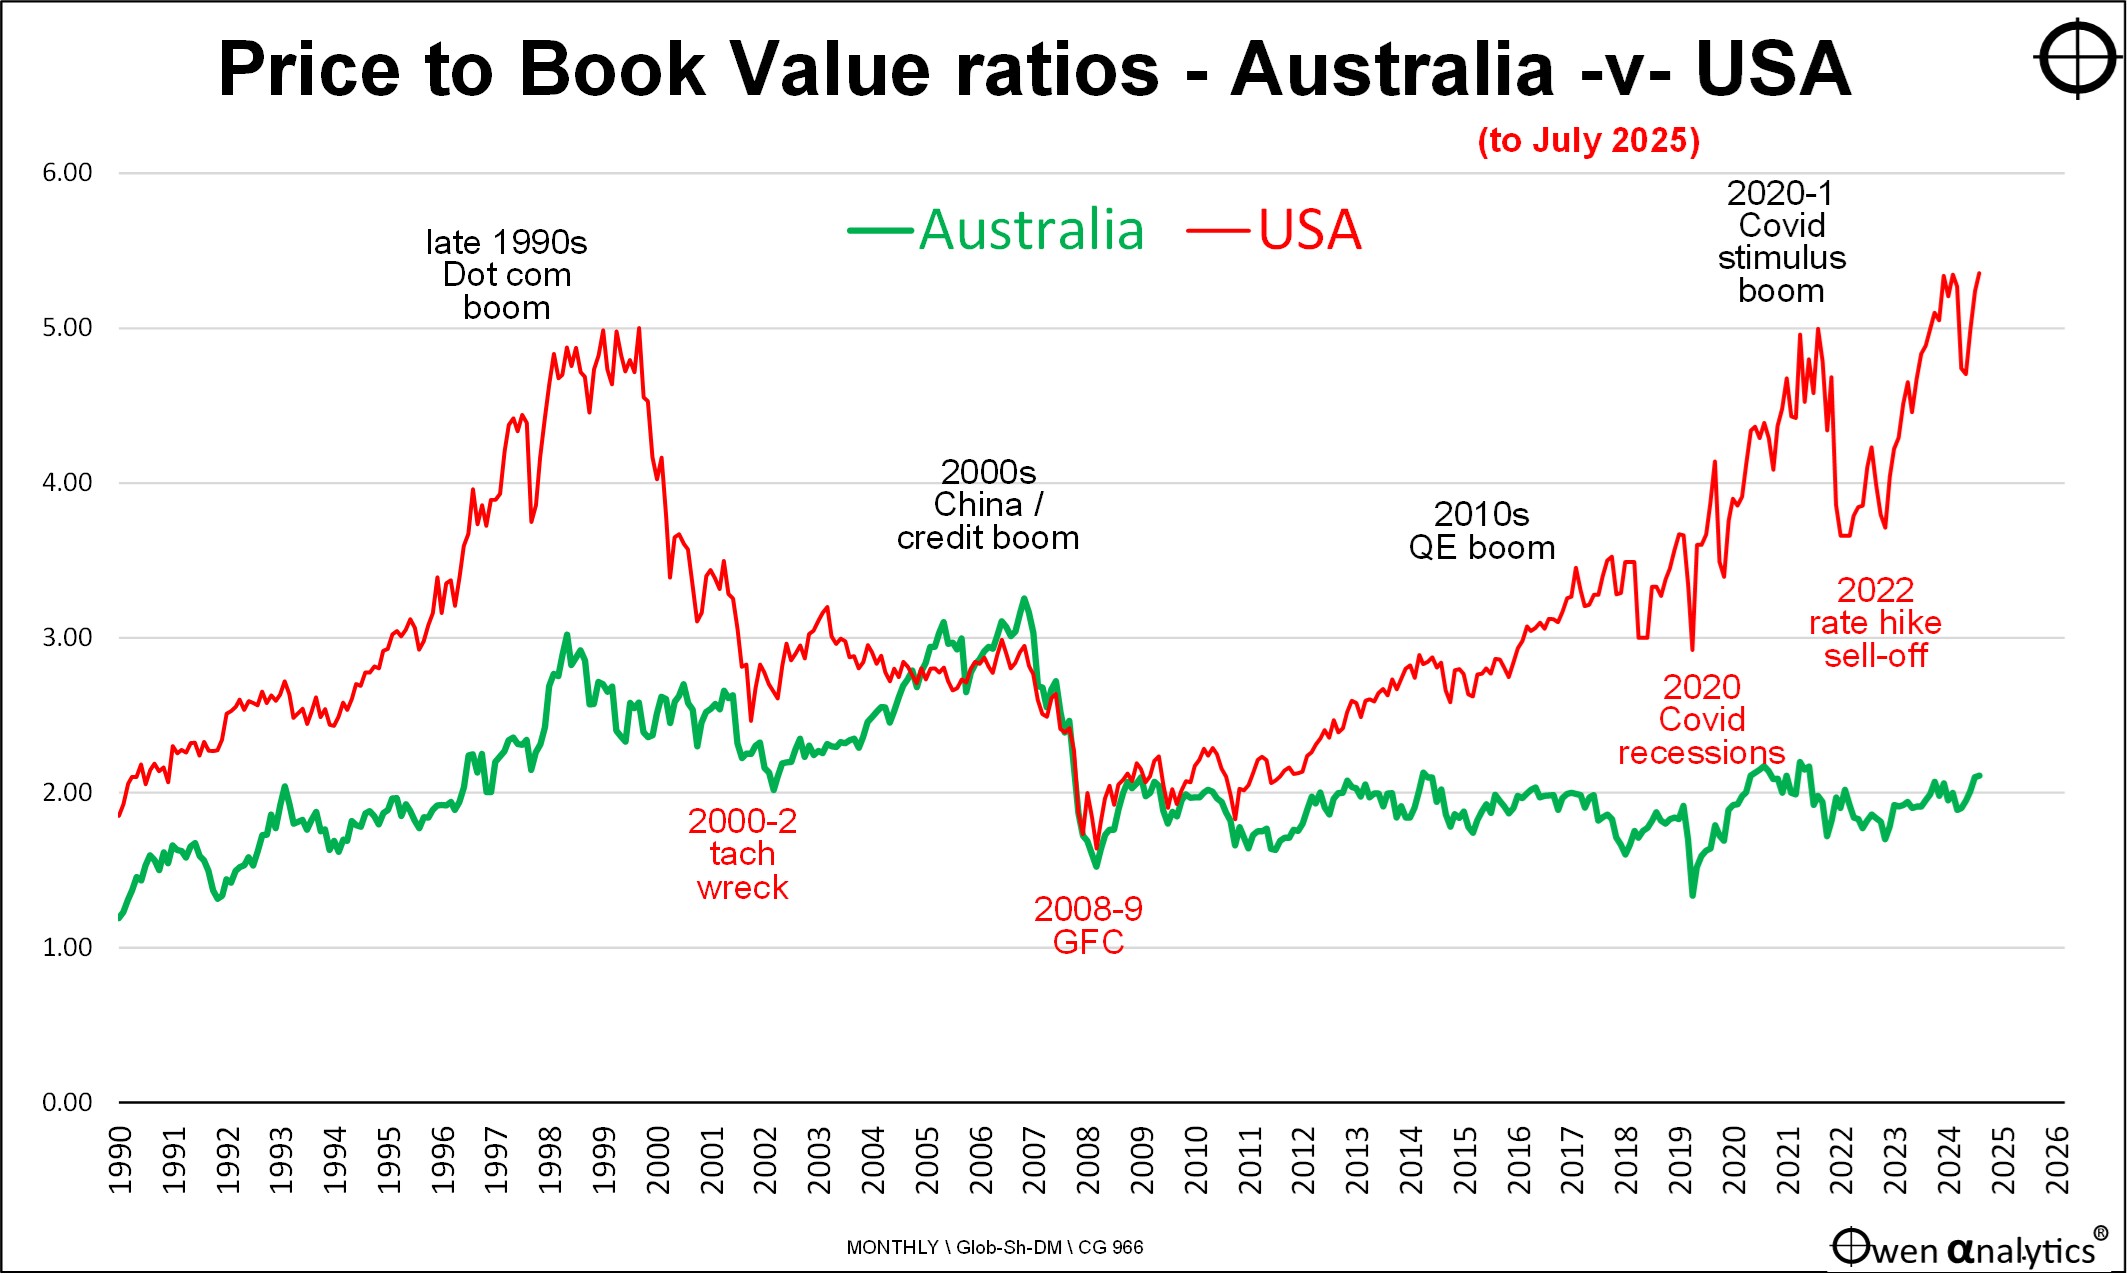
The overall world share market as a whole is trading at three times the value of its net assets (book value). This is mostly because of the US of course, but several other markets, including Australia, are also on unusually high price/book ratios for no apparent or justifiable reason.
Summary
-
-
- Most share markets – including US and Australia in particular - appear to be very expensive on three widely-used pricing metrics – price/earnings ratios, dividend yields, and price-to-book value ratios.
- Each indicates high pricing relative to historical averages, and also relative to underlying fundamentals like profitability and sustainable growth rates.
- The US in particular stands out as being expensive on these measures, even after allowing for its stronger fundamentals relative to other markets.
- Given the Australian market’s much weaker underlying fundamentals, Australia is probably even more over-priced than the US at current levels.
- These simple pricing indicators are not a bad starting point, but they gloss over a host of differences in each market, like returns on equity, dividend pay-out ratios, earnings growth rates, sector mix, and economic conditions – which are explored in later articles in this series.
‘Till next time . . . . safe investing!
Data for today’s chart:
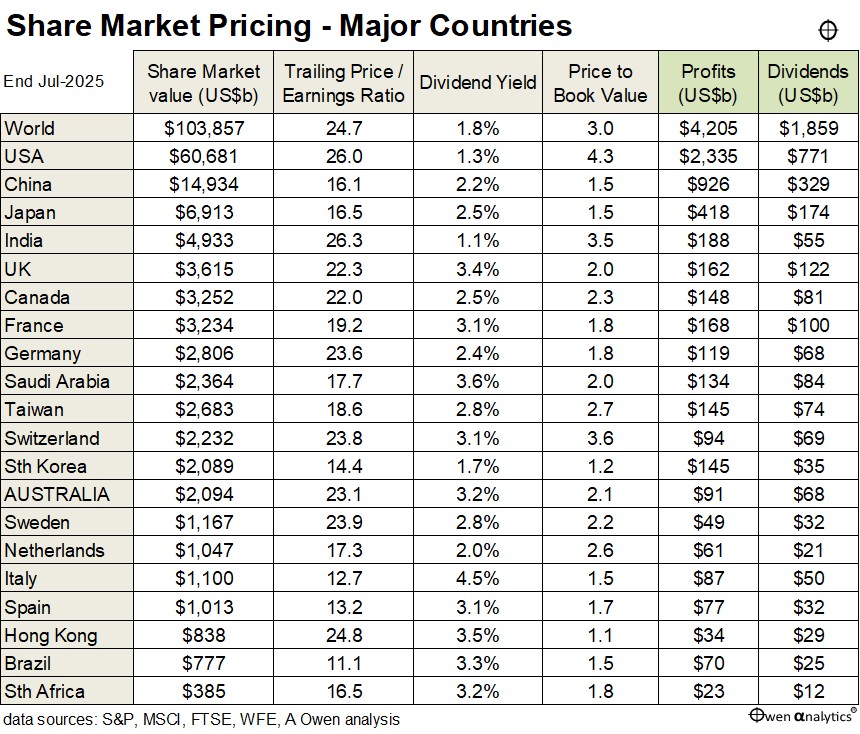
Note that MSCI’s definition of ‘World’ includes around 5,200 companies in only a couple of dozen ‘developed’ markets. For a better ‘World’ picture I use S&P Global BMI which includes around 15,000 companies in 48 countries.
See other articles in this series -
-
-
- Part 1: Share market Pricing per country – How does your country rate? (11 Aug 2025)
- Part 2: P/E ratios, Dividend Yields, Price-to-Book value (today’s article)
- Part 3: Forward P/E ratios and Earnings growth assumptions (coming soon)
- Part 4: Growth rates for Profits & Dividends (coming soon)
- Part 5: Profit Margins & Returns on Equity (coming soon)
- Part 6: PEG ratios & Buffett/Graham’s 8.5 rule – what price growth? (coming soon)
For my most recent monthly update on local & global markets for Aussie investors: