Key points:
-
- Another month of good gains on global share markets across almost all industry sectors and countries, despite Trump’s frenzy of deals, adjustments, backflips, side-deals.
- Inflation continues to ease, but central banks remain cautious and reluctant to cut rates further for now. But bond yields rose at the long end, reflecting fears of higher inflation ahead.
- Global growth, spending, and employment all remain reasonably strong – defying wide-spread predictions of slowdowns & recessions.
- On commodities markets, oil and gold kept rising on inflation and Middle East troubles. Iron ore was finally boosted by much-awaited Chinese stimulus.
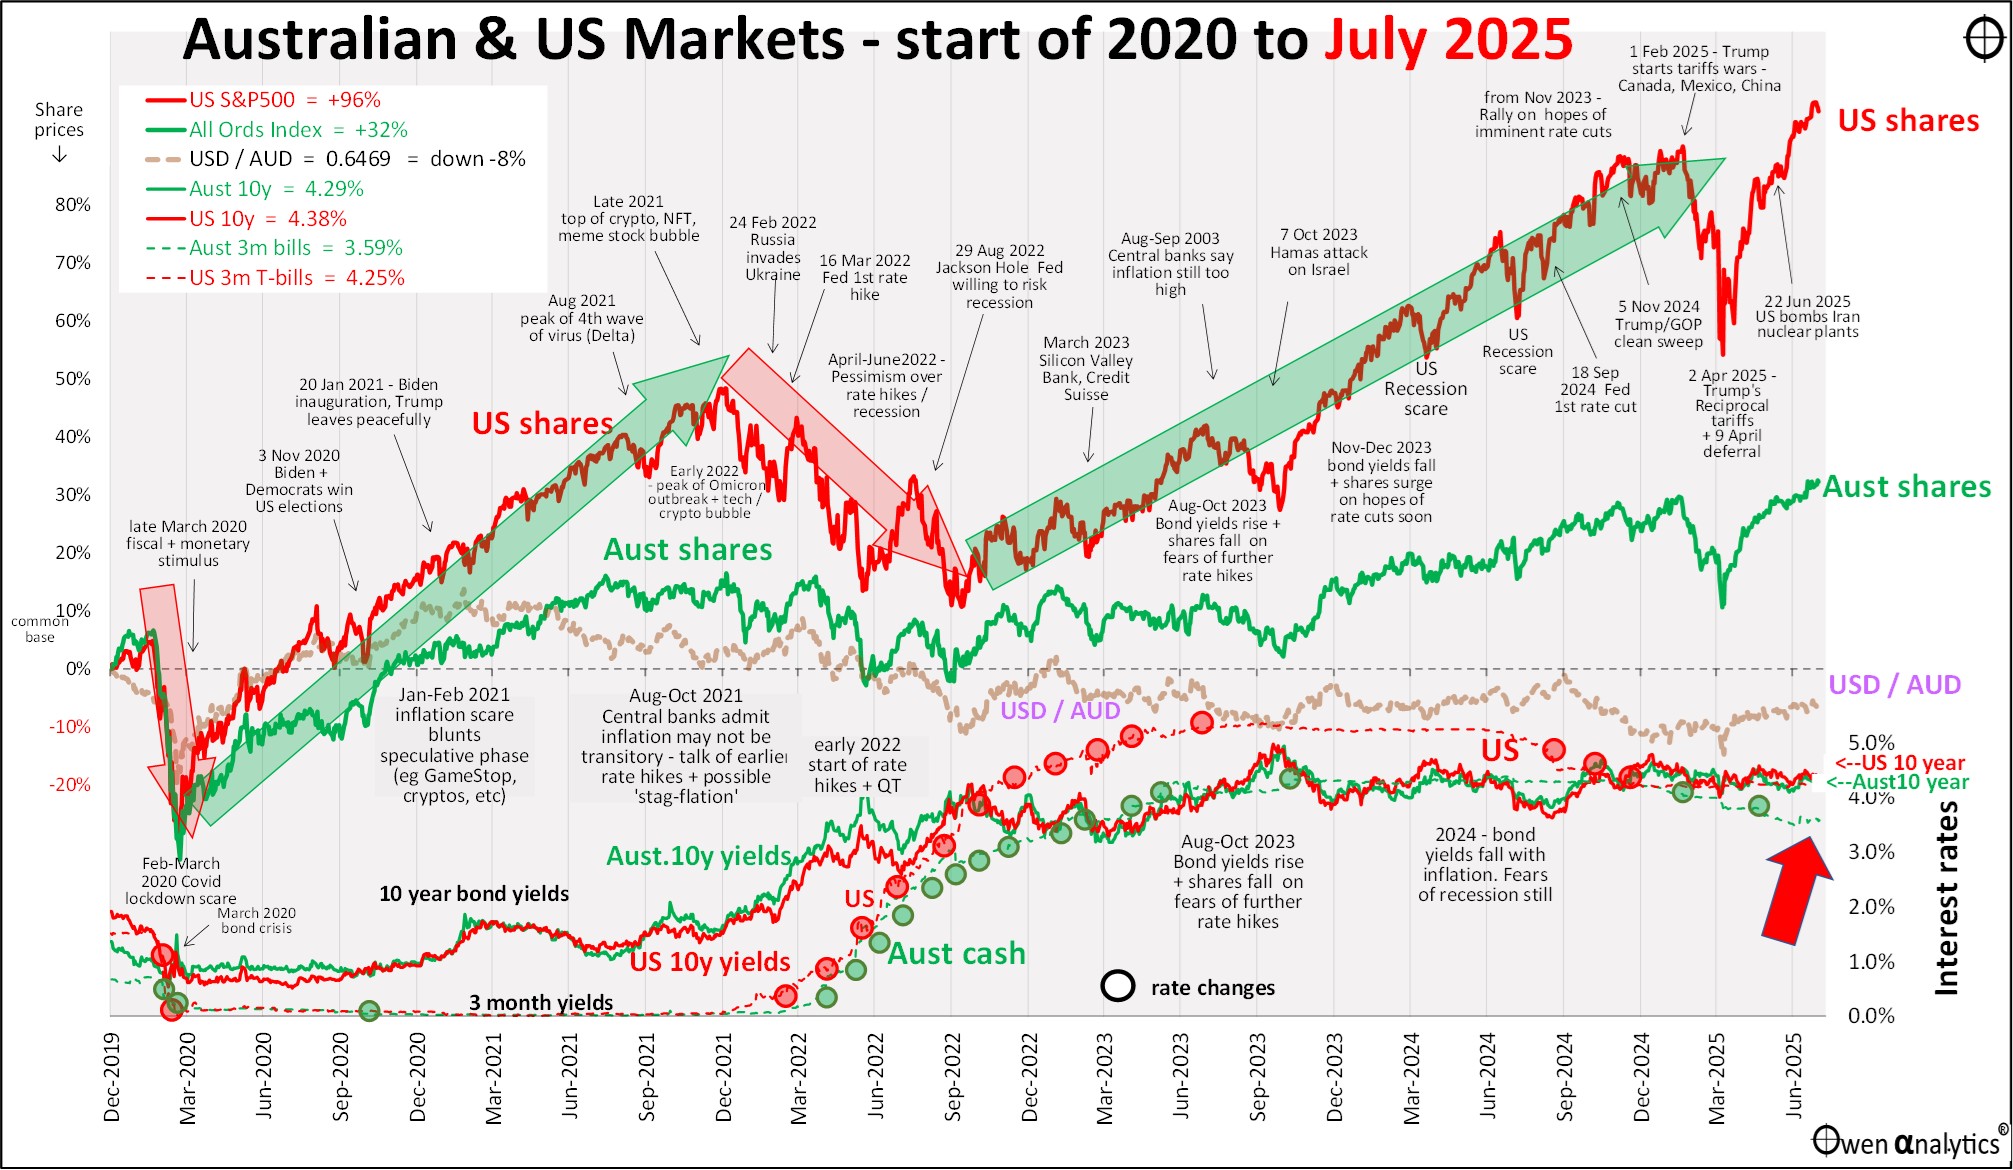
First - my essential 1-page snapshot chart - covering Australian and US share markets, short and long-term interest rates, inflation, and the AUD/USD exchange rate. As usual, there are two versions – first is the traditional version on a single chart:
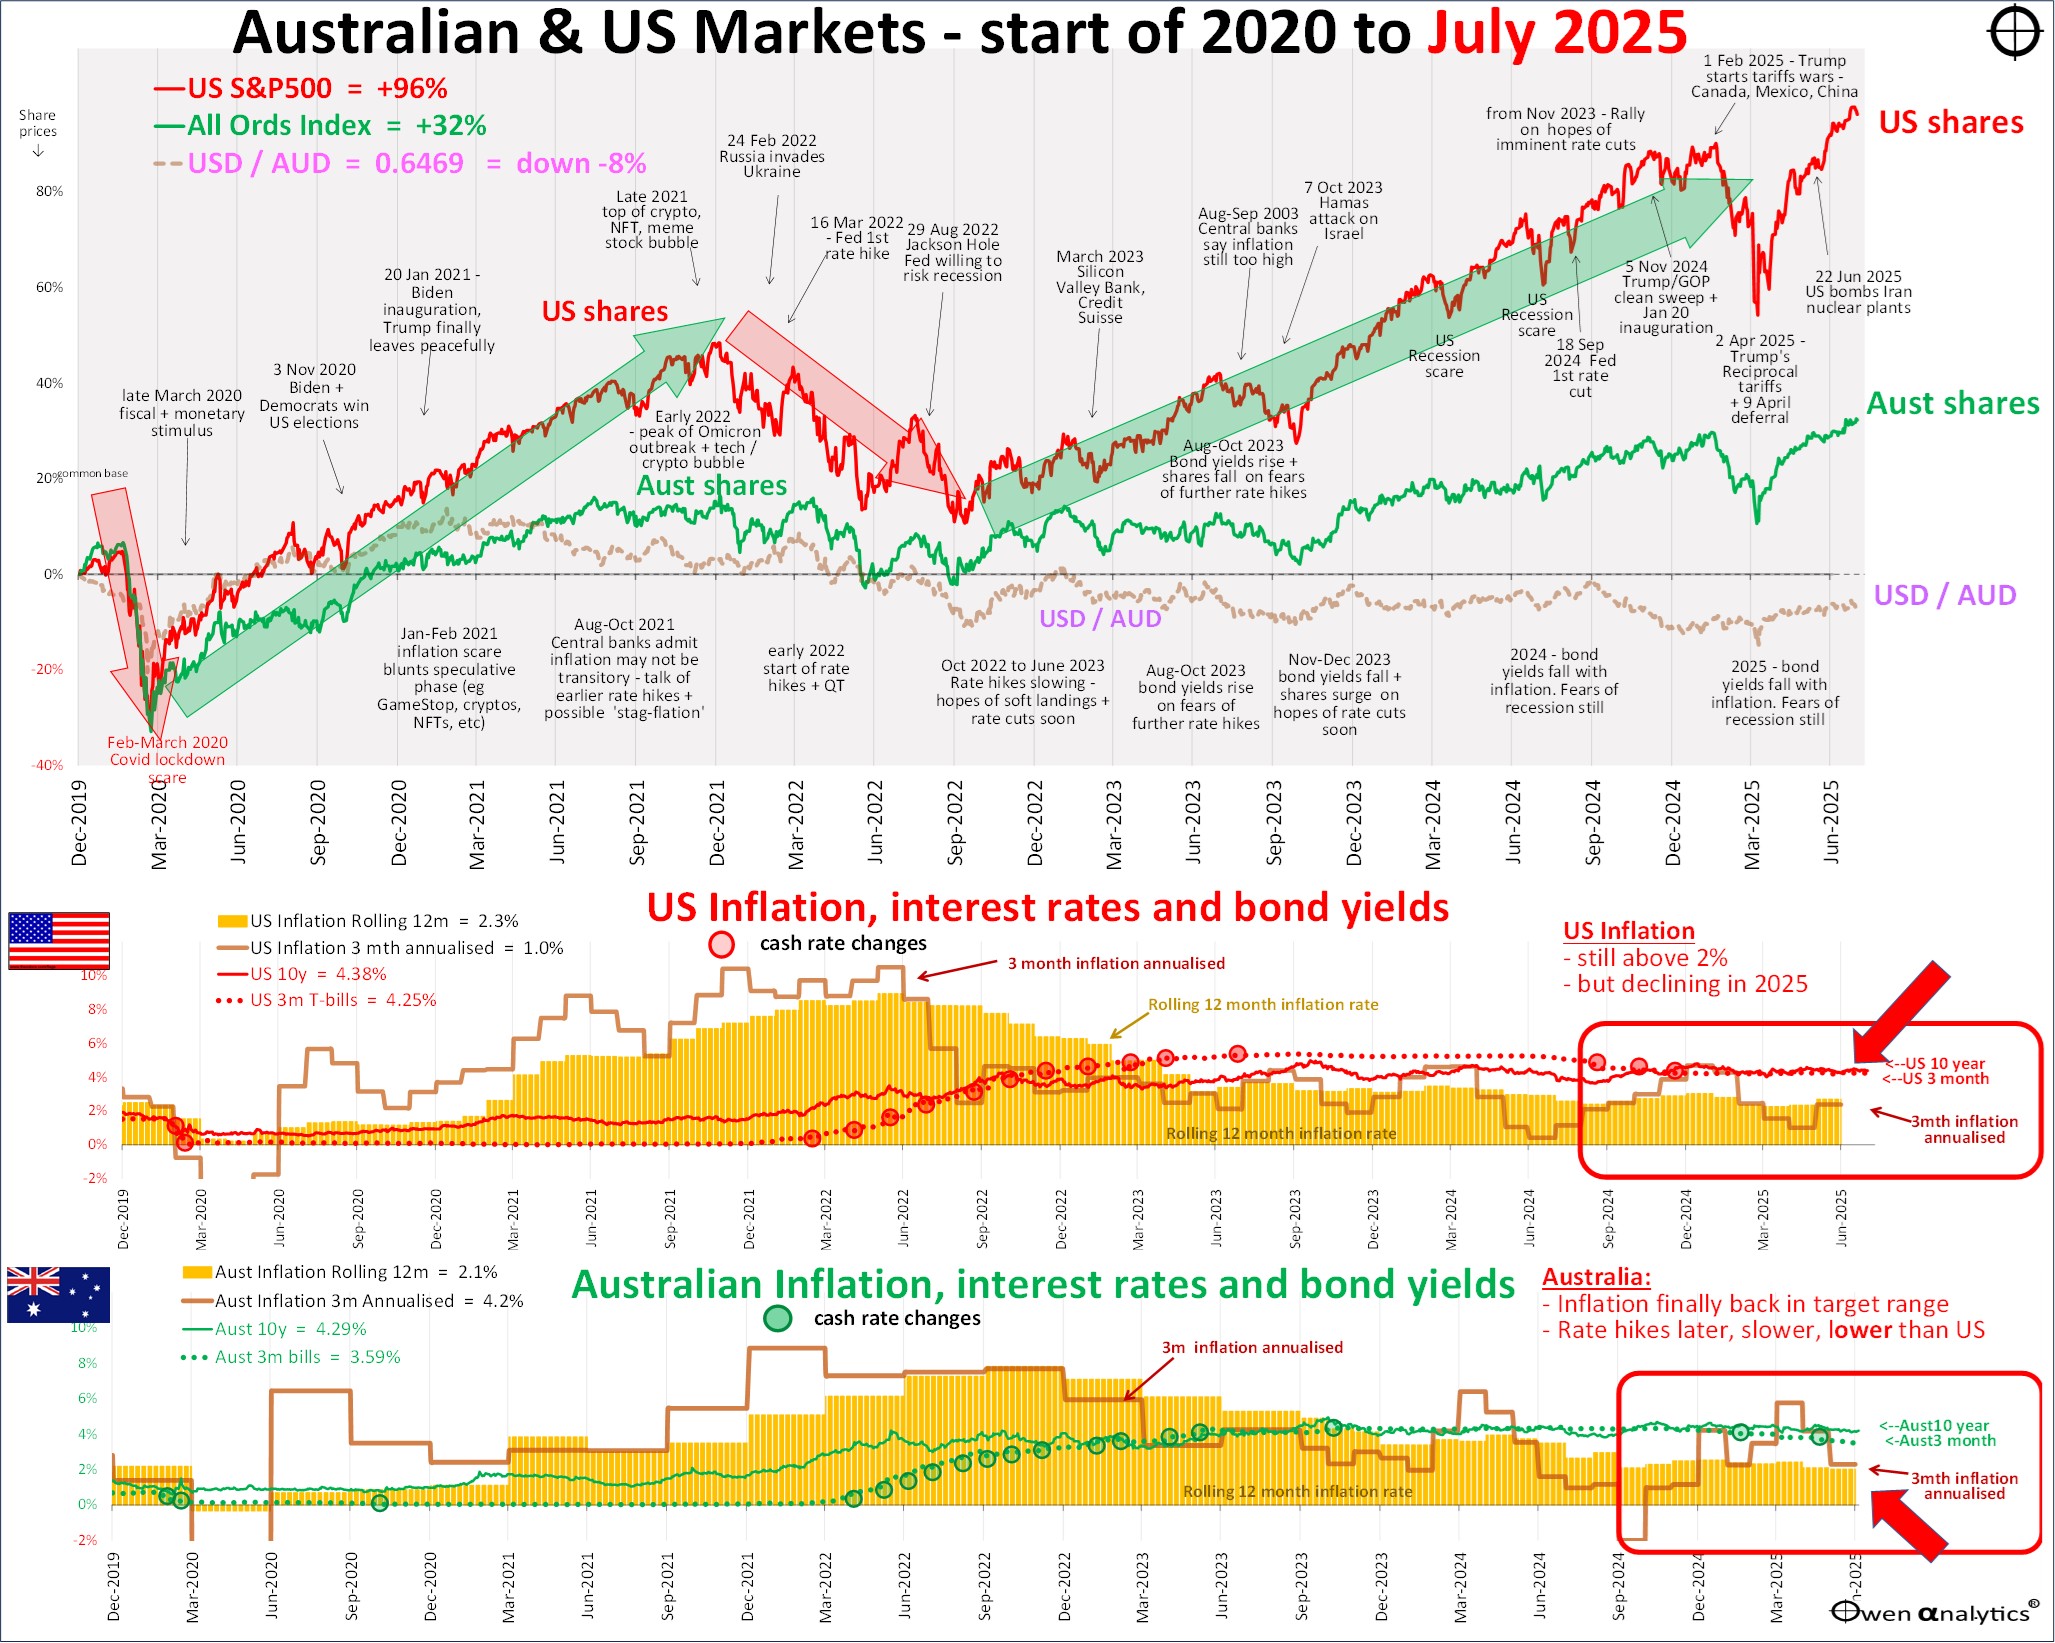
Plus the alternate version below, requested by several advisers - showing Australian and US inflation separately in the lower sections:
Share markets
Global share markets rose for a fourth straight month. That’s not unusual - we had two runs of 5 straight months of gains in the prior couple of years.
Most markets, including Australia and the US, have now more than recovered from the sharp Trump tariff sell-off in April. The US market (S&P500) posted 11 new all-time record highs during July, and the Australian market (All Ords) posted eight.
However, the US market continues to beat the local ASX by a country mile. One key feature of the above charts is that US share prices (S&P500) have doubled since the start of 2020 (pre-Covid), but the Australian market is up by just 32% over the same period.
But two thirds (21%) of that 32% gain is just cumulative inflation!
The main drag on the local market has been the big miners (discussed later), and our tiny tech sector.
Industry Sectors
Most of the main global industry sectors were up in July:
-
-
Tech (led by Nvidia +13%, Samsung Electronic +19%, Oracle +16%)
-
Energy (fossil fuels - almost all up on higher oil prices)
-
Industrials (Boeing +6%, Raytheon +8%, Caterpillar +13%)
-
Discretionaries (Amazon +7%, Toyota +8%, Alibaba +5%)
-
Comms (Alphabet/Google +9%, Meta/Facebook +5%, Tencent +9%)
The healthcare sector was down a fraction, dragged lower by the continued slide in Denmark’s Novo Nordisk (maker of Ozempic & Wegovy), which is now down more than 70% from its peak a year ago.
The only main share sector down for the month was Consumer Staples, mostly on trade/tariff fears (eg. Nestle -10%, P&G -6%, Philip Morris -10%).
Major stocks
Here is the picture for the largest global stocks in July (all of which are US based):
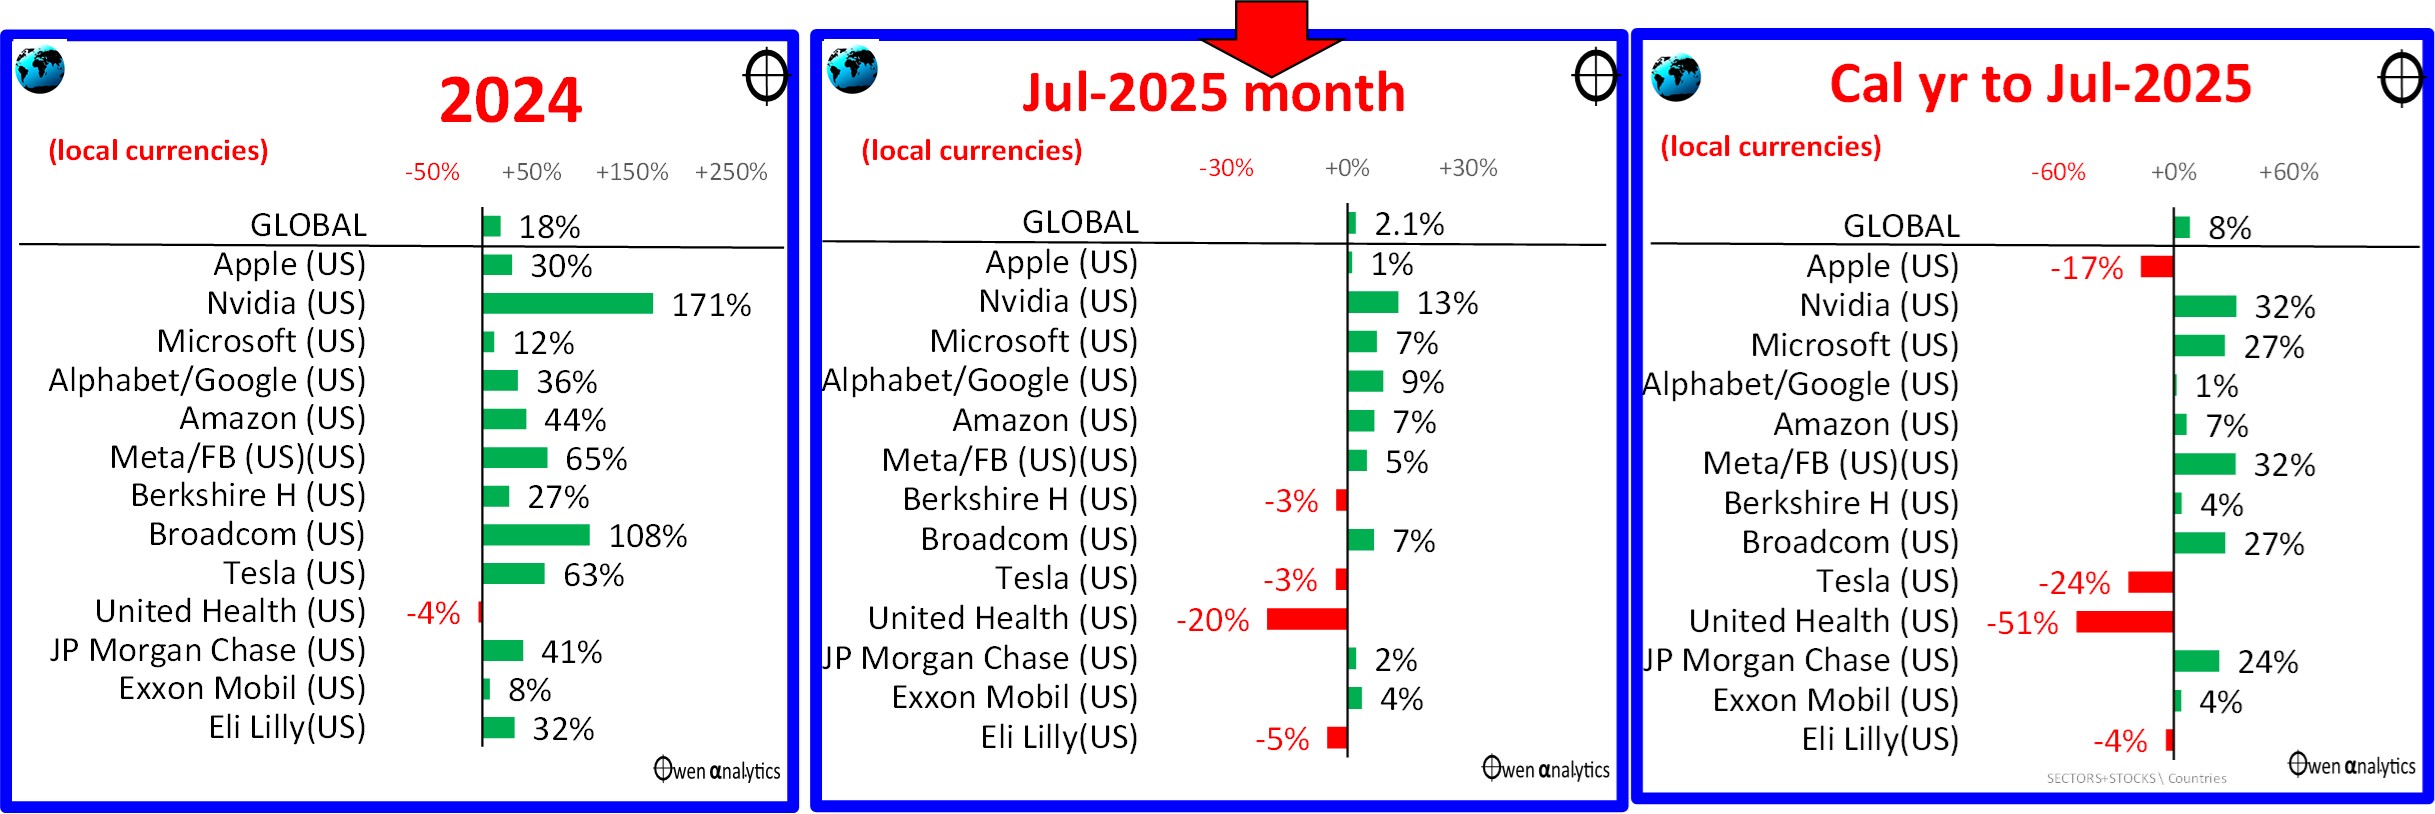
After the strong gains in July (middle chart), most are ahead for the calendar year to date (right chart). Leading the pack are the (current) perceived winners from ai: Nvidia, Meta/Facebook, Microsoft, and Broadcom (ex-HP). Leading the banks is JP Morgan after its recent 180-degree policy backflip on crypto.
The main global majors down this year include:
-
-
Apple (growth/tariff concerns),
-
Tesla (Trump’s removal of subsidies for EVs, plus consumer boycotts),
-
United Health (a host of self-inflicted wounds),
-
Eli Lily (main competitor to Denmark’s Novo Nordisk, which is also down heavily)
-
Alphabet (Google search being eaten alive by ai).
Mag-7 update
For context, here are the share price charts for the so-called ‘Magnificent Seven’ stocks over the past decade (plus China’s Alibaba and Tencent):
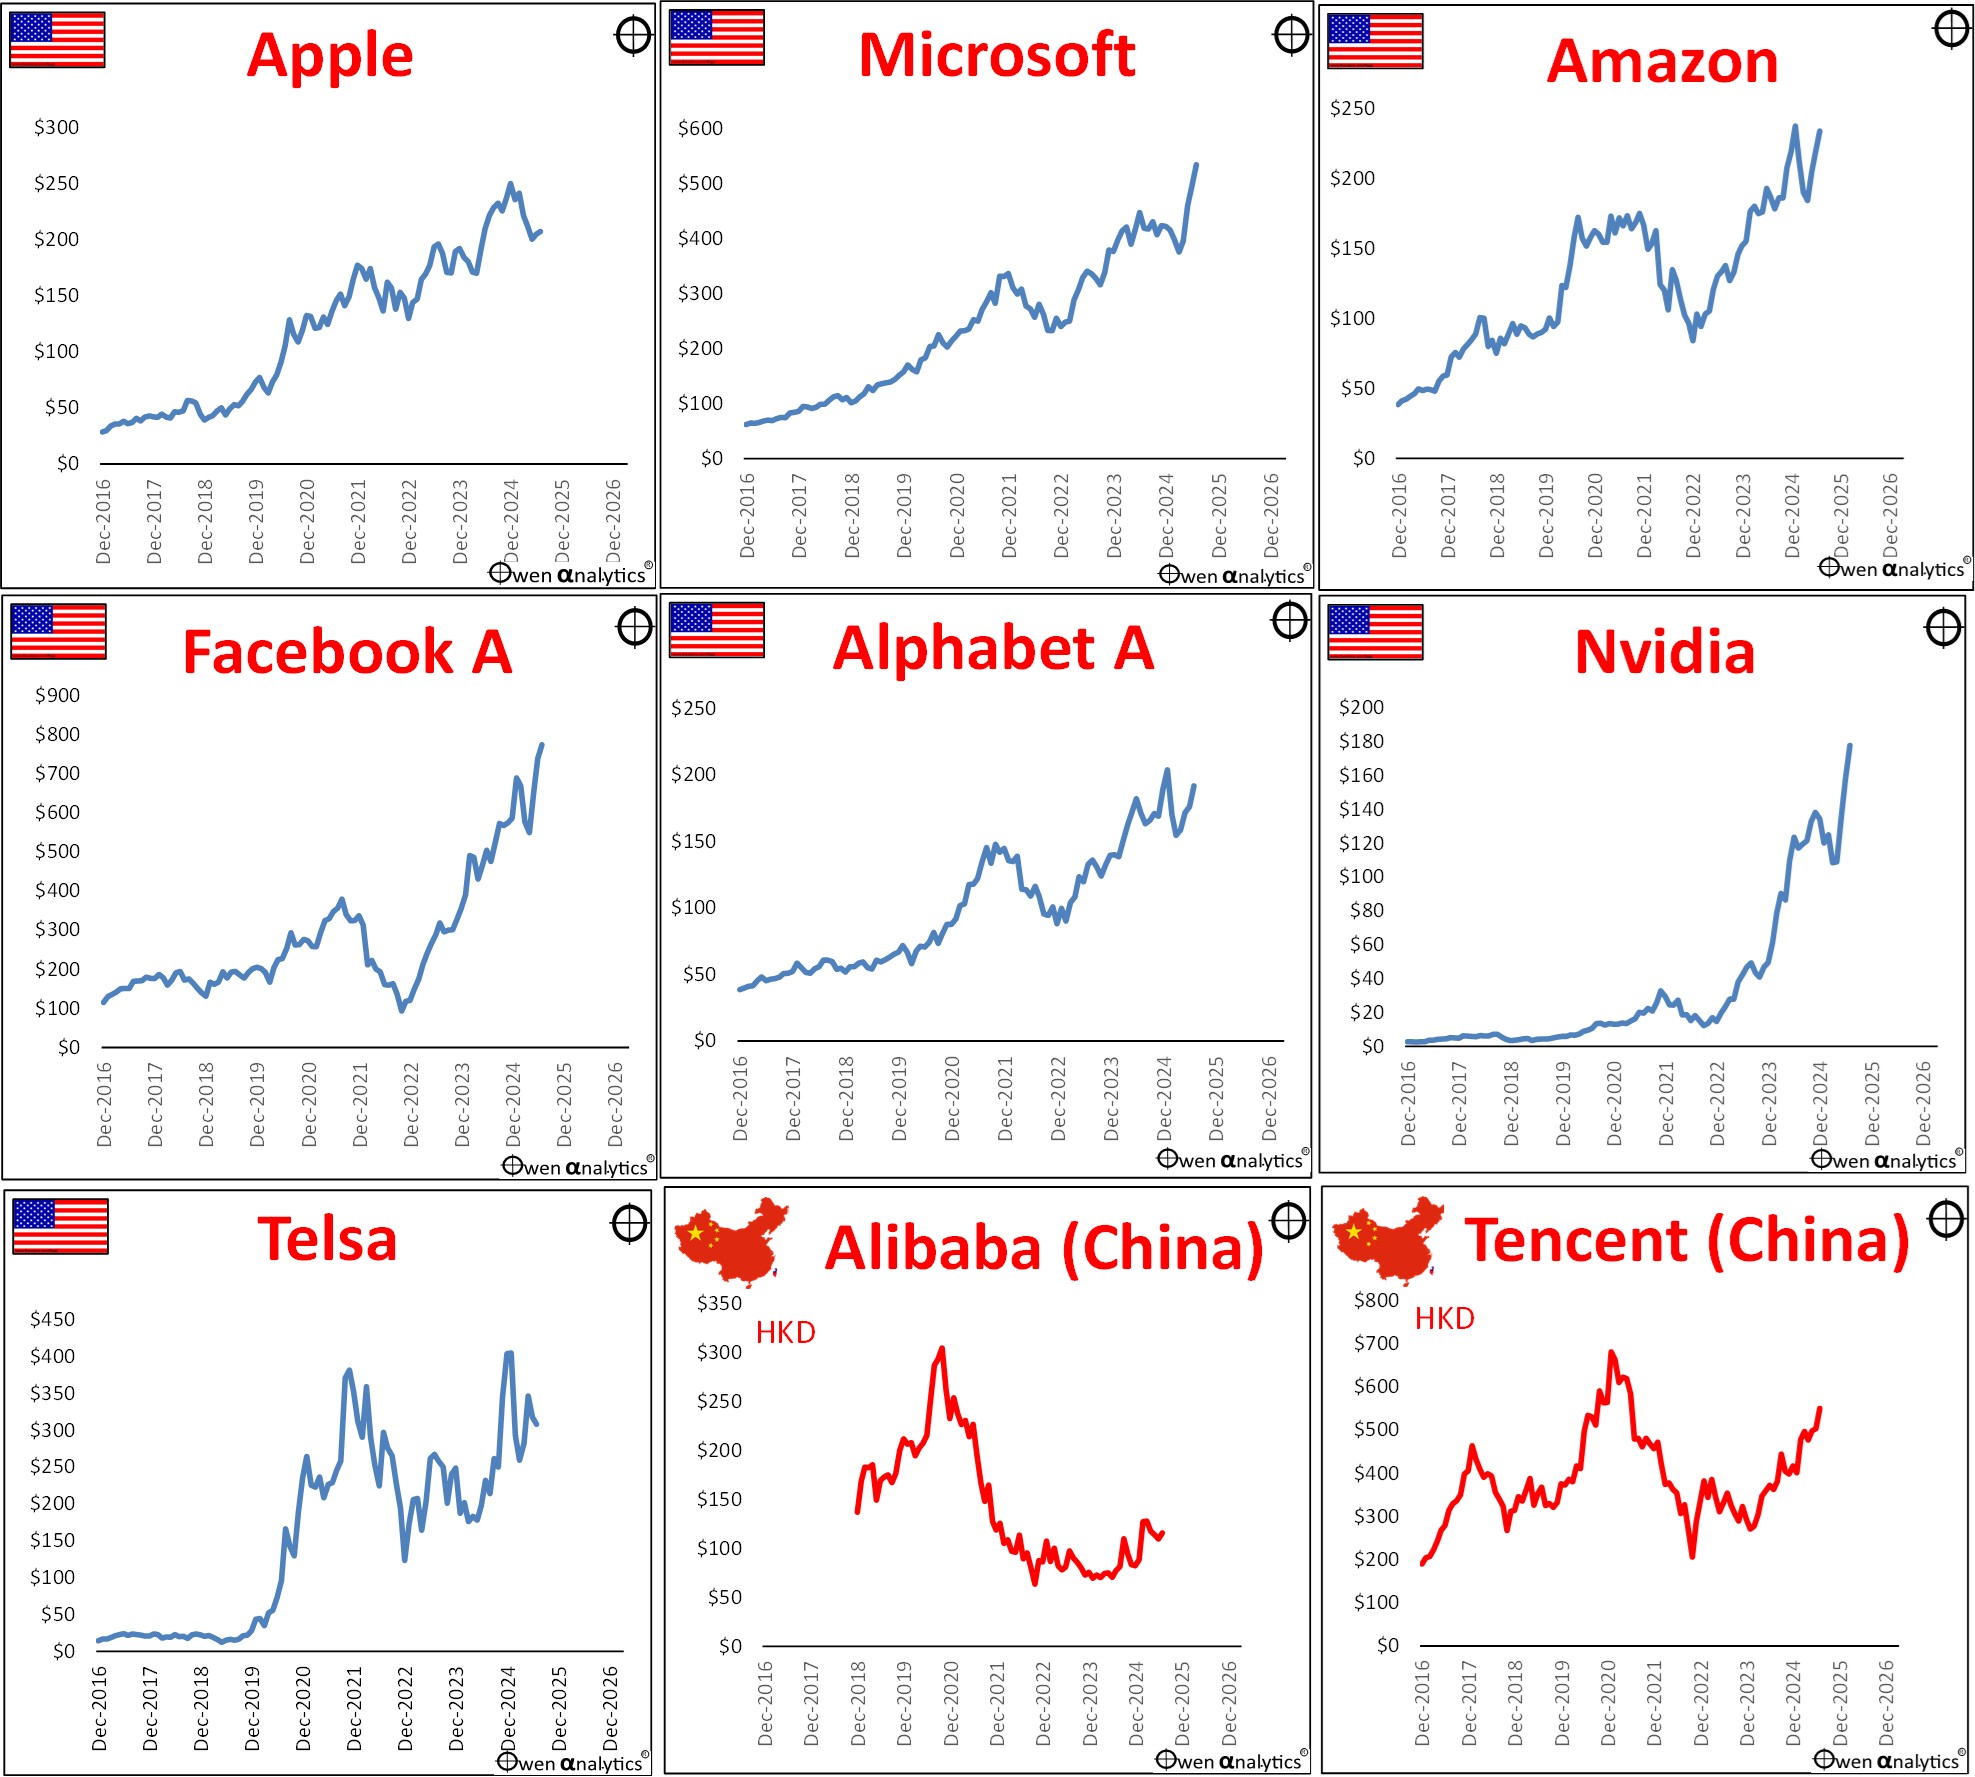
I have not used any y-axis scale trickery here – the vertical y-axes all start at zero, and have regular, nominal scales, which highlights the explosive share price growth of the US giants from very low levels in the past decade.
China’s Alibaba and Tencent are up strongly in the Chinese rally this year, but both are still well below their 2021 peaks. By comparison, all of the US majors are well above their previous peaks in the 2021 Covid stimulus boom.
(The obvious odd-man-out here is Tesla, which should never have been in the ‘Mag-7’ in the first place, as it continues to suffer from very poor margins and returns on equity.)
The US tech giants are still very expensive on a range of metrics. See my recent report on how they stack up individually on revenues, profits, dividends, and pricing -
Profits and Pricing
We are now at the start of the reporting season for the June 2025 quarter, so it is too early to get a comprehensive picture. However, in the last profit reporting quarter (March 2025), S&P500 companies in aggregate posted good earnings growth of +13% for the past 12 months, following decent +9% growth in the previous 12 months.
Consensus forecasts for the next two years have been cut over the past month (tariff impact fears), but they are still forecasting +14% earnings to growth in calendar 2025, plus another +16% growth in 2026. That’s still incredibly ambitious.
The problem is that S&P500 pricing is a very bullish 29 times trailing (past 12 months) earnings, and 26 times next year’s ambitious earnings forecasts. These are very optimistic multiples on very optimistic, accelerating earnings outlooks – a double layer of over-confidence, and highly vulnerable to negative shocks.
But so far, investors have shrugged off Trump’s tariffs, weak GDP growth, Moody’s US credit downgrade, and escalating Middle East troubles. Are US company earnings and investor optimism invincible?
For my full story on US profits and pricing – see:
Major country share markets
Most of the main global share markets continued their upward march in July (middle chart), and most are heading for good returns again for the 2025 calendar year (right chart) –
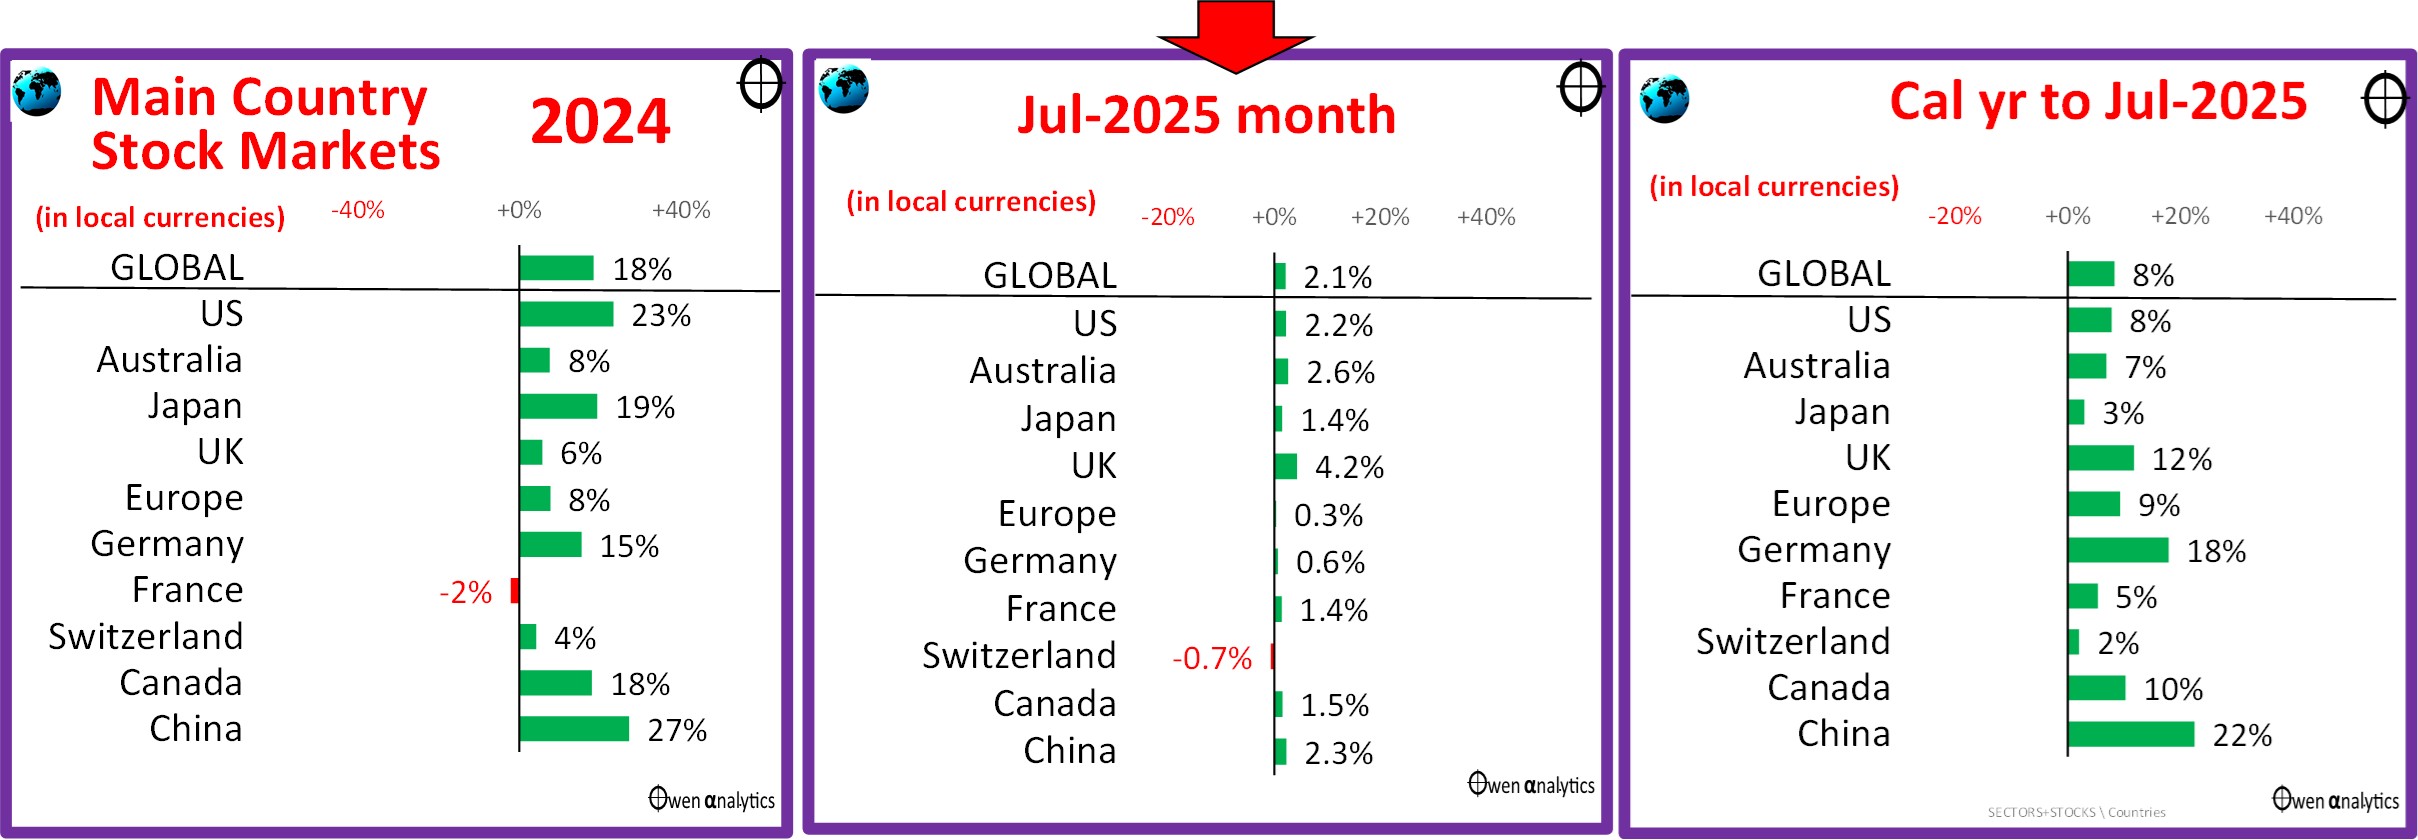
It is essentially a sea of green ink – continuing to defy the perennial doom-sayers who prattle on about imminent global recessions caused by Trump’s tariffs.
One interesting feature in July was the difference in returns from the UK market, which is a perceived ‘winner’ with Trump’s trade deal, compared to Europe, which was a major loser in its Trump deal. However, as with all of Trump’s deals, there were numerous exceptions and side-deals – and the ‘deals’ could be revoked or reversed or deferred or changed unilaterally by Trump on a whim at any time.
I know a lot of people who switched from US to European share markets in the last couple of months, thinking US falls and Europe’s rise would continue. It may have been a premature shift. The only thing going for Europe is the fact that it is cheaper than the US, and so it should be for a host of fundamental and structural reasons. Problem is, it is probably not cheap enough yet.
Australian shares
The local share market was up with the rest of the world in July (middle chart below). Here are the main stocks:
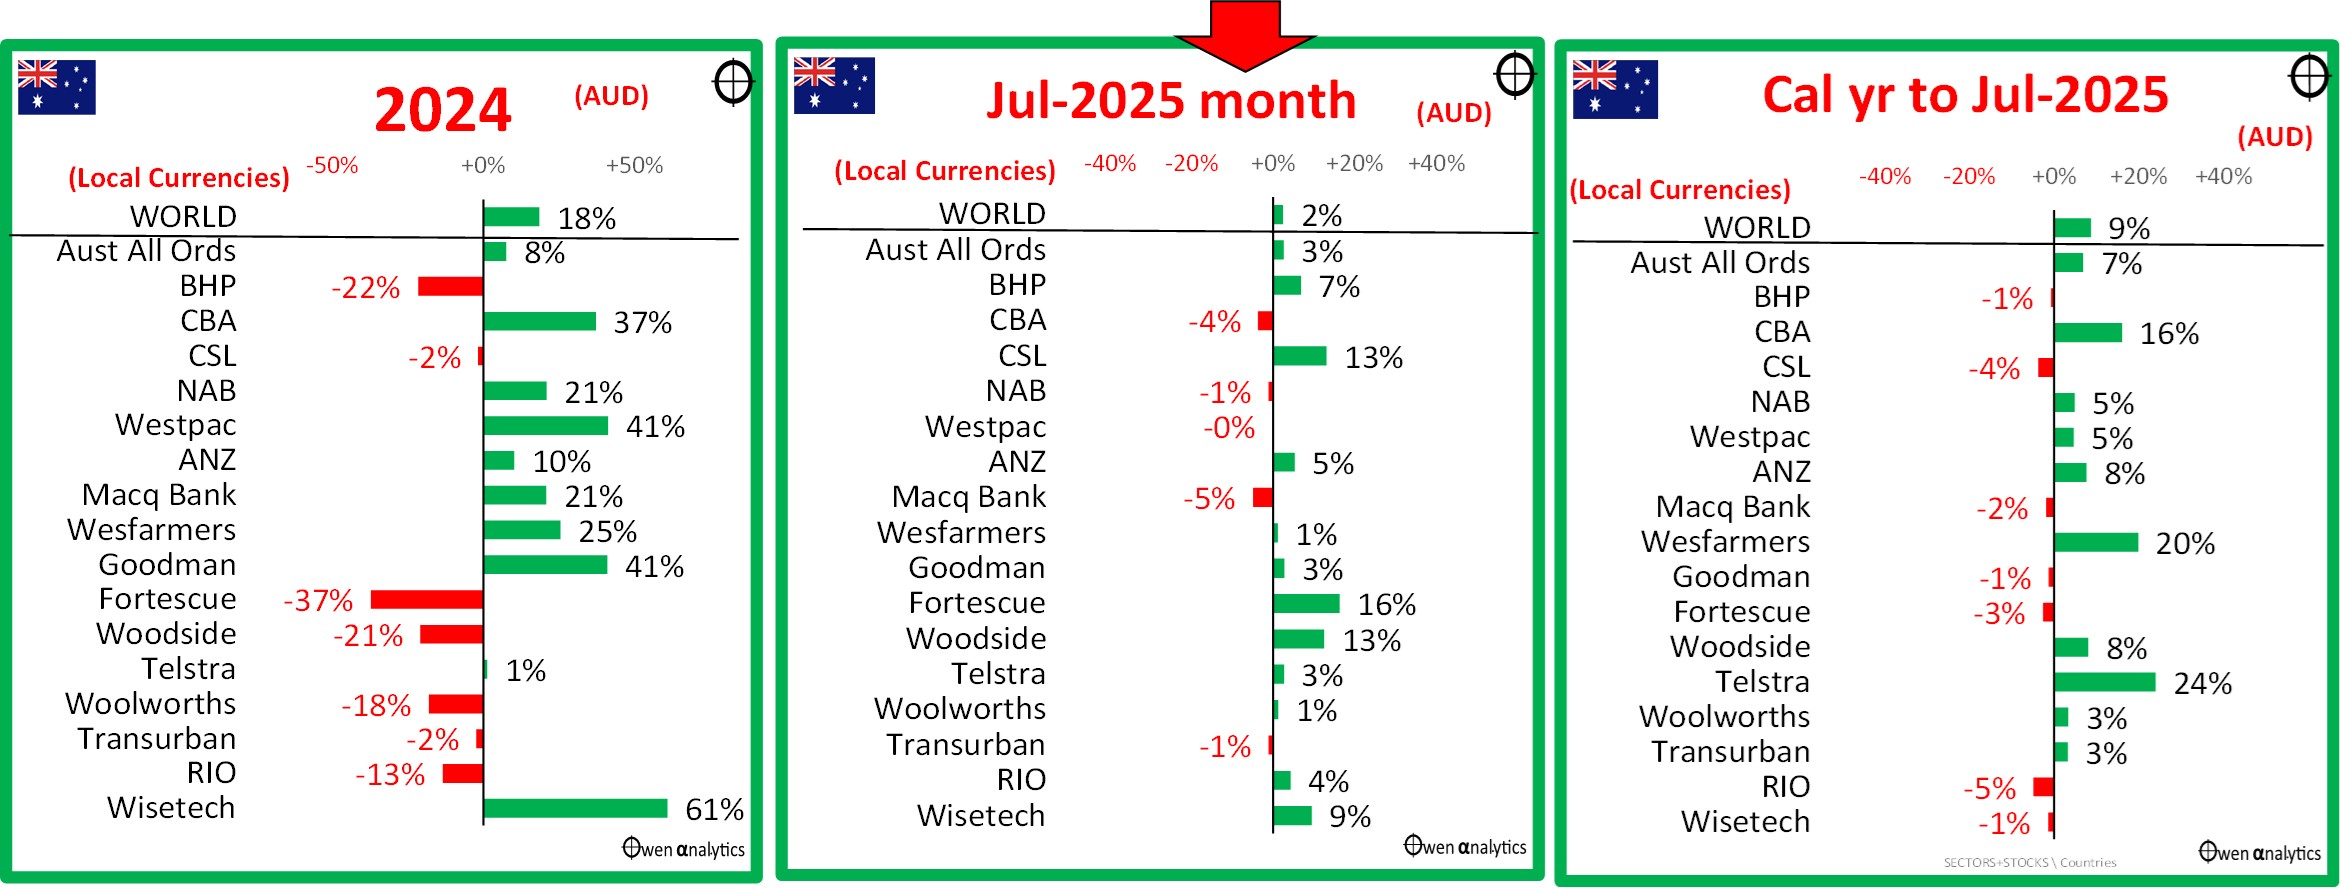
The stars this year (in share price terms anyway) have been CBA and Telstra – for mysterious reasons. They are hardly growth stocks – they are the opposite of growth. CBA’s earnings per share and dividends per share are lower in real (inflation-adjusted) terms than they were a decade ago. Telstra’s earnings per share and dividends per share are lower than they were 25 years ago, not just in real terms but in nominal dollar terms as well! Shareholders seem happy to keep bidding up the share prices of these decaying dinosaurs!
The big miners (mainly iron ore) have been in the doldrums in recent years due to weak iron ore prices with the China slowdown since 2021 and slowing global growth outlooks. But commodities in general, and iron ore in particular, got a boost in July with China’s announcement of the world’s largest dam/hydro project in Tibet. This boosted commodities prices and increased optimism about further Chinese stimulus announcements.
We may possibly be at the start of the next global commodities cycle, which will see a great rotation out of over-priced banks and into the under-priced miners. I will write about this in future articles.
Personal holdings
Personally, I am horribly overweight Aussie bank shares, for legacy reasons (mostly bought in the early-mid-1990s at very low cost bases and large embedded CGT if sold). I have not bought any more bank shares since the emergency deep-discounted GFC capital raisings in 2009.
I generally off-set my over-weighting to the dinosaur Aussie banks by favouring high-beta US shares, rather than Aussie miners.
The last time I weighed heavily into Aussie miners was in 2003, right at the start of the 2003-2011 China boom. Commodities were dirt cheap after the late 1990s ‘dot-com’ boom and 2000-2 ‘tech wreck’ / recessions, and you literally couldn’t give away mining stocks. My against-the-herd bets on mining stocks turned into a huge success, and included my only ever ‘1,000-bagger’ stock pick – Fortescue Metals, plus a bunch of others that did very well, including several that taken over at crazy boom-time prices in the 2000s China / commodities / mining boom.
Having ridden the 2000s mining boom from the start, I have been out of Aussie miners for the past decade, but I am now looking into whether we might be at or near the start of the next big commodities / mining cycle. The long-term fundamentals seem to be building, but there is a lot of short-term noise – notably the market distortions caused by Trump’s frenzied tariff announcements. More on commodities markets below.
For my take on CBA see –
Inflation & interest rates
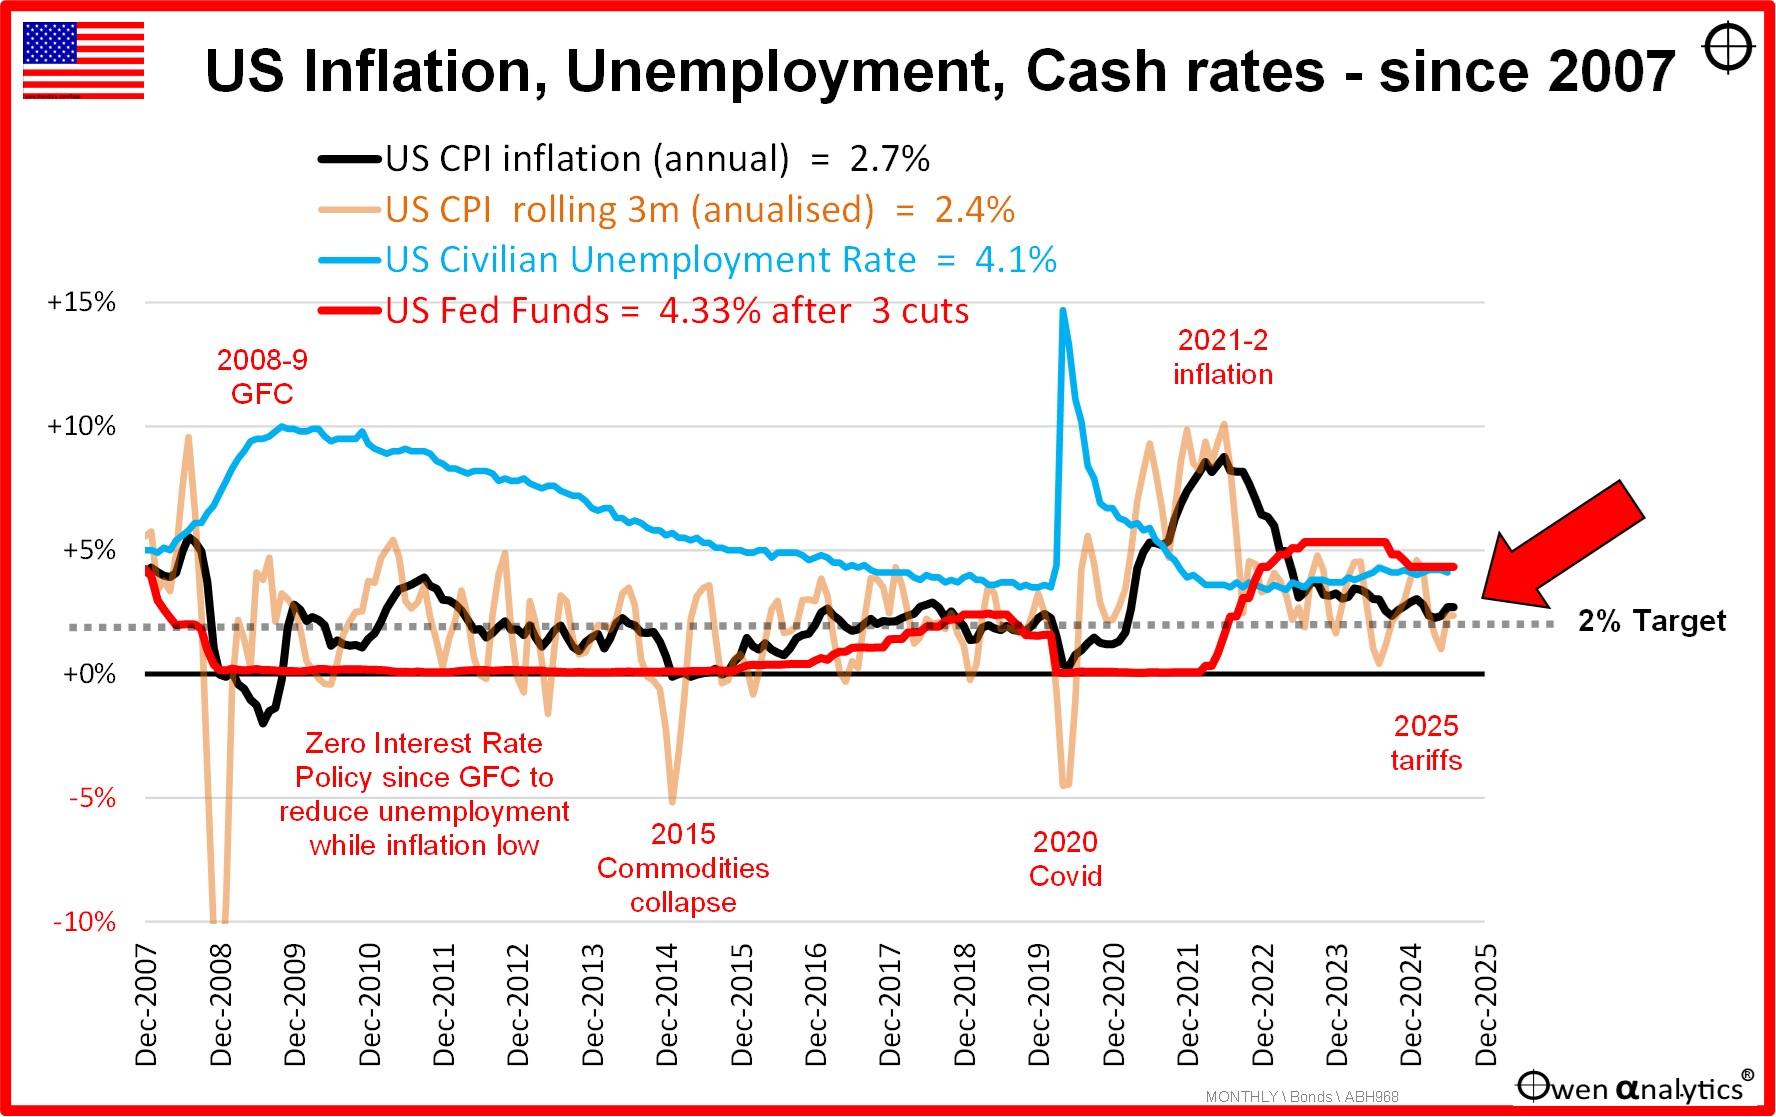
First, to the US market because the US drives all global markets including the ASX. After three rate cuts in September, November and December of 2024, the Fed hit the pause button and said they are in no hurry to cut rates further, despite a barrage of criticisms and personal attacks aimed at Fed Chair Powell from Trump and his stooges.
The 12-month inflation rate to June has risen back up to 2.7%, including some elements of tariff impacts, and the annualised 3-month rate is 2.4%. The Fed’s preferred measure, Personal Consumption Expenditure (PCE) is now 2.3%, which is encouraging, but still higher than target.
The US jobs market remains surprisingly strong. The unemployment rate is still at a relatively low 4.1%, having dropped back from 4.2% in prior months. Here is the US picture:
Tariff impacts
Fed chair Jerome Powell initially suggested that tariff-induced inflation in the US may be ‘transitory’, but he has since retracted that idea following increasing criticisms and personal attacks from Trump. It is early days yet, but price rises are thus far having only limited effects on US inflation numbers and consumer spending levels.
There are probably two main ways in which tariffs can impact US consumer spending. The first is if consumers reduce spending as prices rise due to the tariffs, and a second likely impact would be US consumers delaying spending due to the unpredictable nature of Trump’s tariff announcements. Both impacts have the potential to lead to lower spending and employment in the US.
It is a full-time job keeping up with Trump’s blizzard of Tariff changes – but today it looks like something like this - Brazil 50%, Cambodia 36%, Canada 35%, Mexico 30%, China 55%, India 25%, South Korea 25%, Vietnam 20%, Japan 15% UK 10%. In addition, Trump’s ‘deals’ involve additional tariffs for particular industries (eg steel, aluminium, copper, car parts), and many also include undertakings to invest more in the US and buy more US exports. In addition, it is evident that there often some secret side deals in a number of cases.
However, Trump’s ‘deals’ are never set in stone and are often suspended or deferred within days or hours of being announced. Hence the risk that the uncertainty of prices prompts Americans to just delay spending until the picture is clearer.
Here is one useful on-line tariff tracker - https://tariffcheck.org/countries
Who ‘pays’ the tariffs?
Trump supporters parrot the Trump line that foreigners pay the tariffs (“We are collecting hundreds of billions of dollars in tariffs from foreigners!”), but the rest of the world knows that US tariffs on foreign imports are paid by the US importers, and are either absorbed by the US importers (ie passed on to their mostly US shareholders in the form of lower profits and dividends), and/or passed on to US consumers in the form of higher prices.
However, it is also true that foreign exporters may choose to cut their prices to the US to try to maintain sales volumes and profits. For example, we can see this happening with Japanese car exports to the US, which are down in both unit volumes and revenues. Another impact is that exporters can shift exports to other countries, with the additional supply often lowering prices in those markets, putting pressure on domestic producers.
Where foreign exporters receive lower prices and lower volumes, those losses are borne by the foreign exporters’ shareholders and jobs in the exporting country. So, in reality, US tariffs are likely to result in a global slowdown in global trade volumes, consumer spending, profits, and jobs.
A worst case scenario would be that tariffs slow spending, output, and employment, but the Fed is unwilling to cut rates much further (which is the usual stimulatory tool in recessions and slowdowns) because inflation remains high. This is the nightmare ‘1970s stagflation’ scenario. However, today there are several deflationary factors at work that were not present in the 1970s – for example declining and aging populations.
Tariffs -v- ‘inflation’
It is important to understand that a one-off increase in prices due to tariffs (or other taxes) is NOT necessarily ‘inflationary’ that central banks would counter with rate hikes. For example - the one-off rise in Australian consumer prices across the board due in July 2001 with the introduction of the 10% GST was NOT ‘inflation’. It was just a one-off rise in prices. A rise in CPI does NOT equal ‘inflation’.
Why? Price rises due to taxes like tariffs only become ‘inflationary’ if they lead to a sustained ratcheting up of prices via retaliatory tariff hikes or wages. Central banks are not worried by one-off price rises. They are worried if the price rises turn into an upward spiralling of prices. The problem is that price rise spirals can quickly get out of control and change consumers’ expectations and spending patterns.
No doubt part of the general bullishness of global investors this year is that Trump’s initial blizzard of sky-high tariffs are turning out to be just a negotiating tactic, with the actual tariff levels being much lower in the final deals. The ‘TACO’ trade idea is holding up for now.
Australian inflation, interest rates, unemployment
Australian inflation also remains problematic, but for different reasons. The RBA has only made two cuts in this cycle (Feb and May 2025), while most other countries have made several more cuts as inflation has edged down. (For example, there have been 8 rate cuts in Europe, 7 in Canada, 6 in NZ, 4 in UK, 3 in US).
Here is the Australian picture:
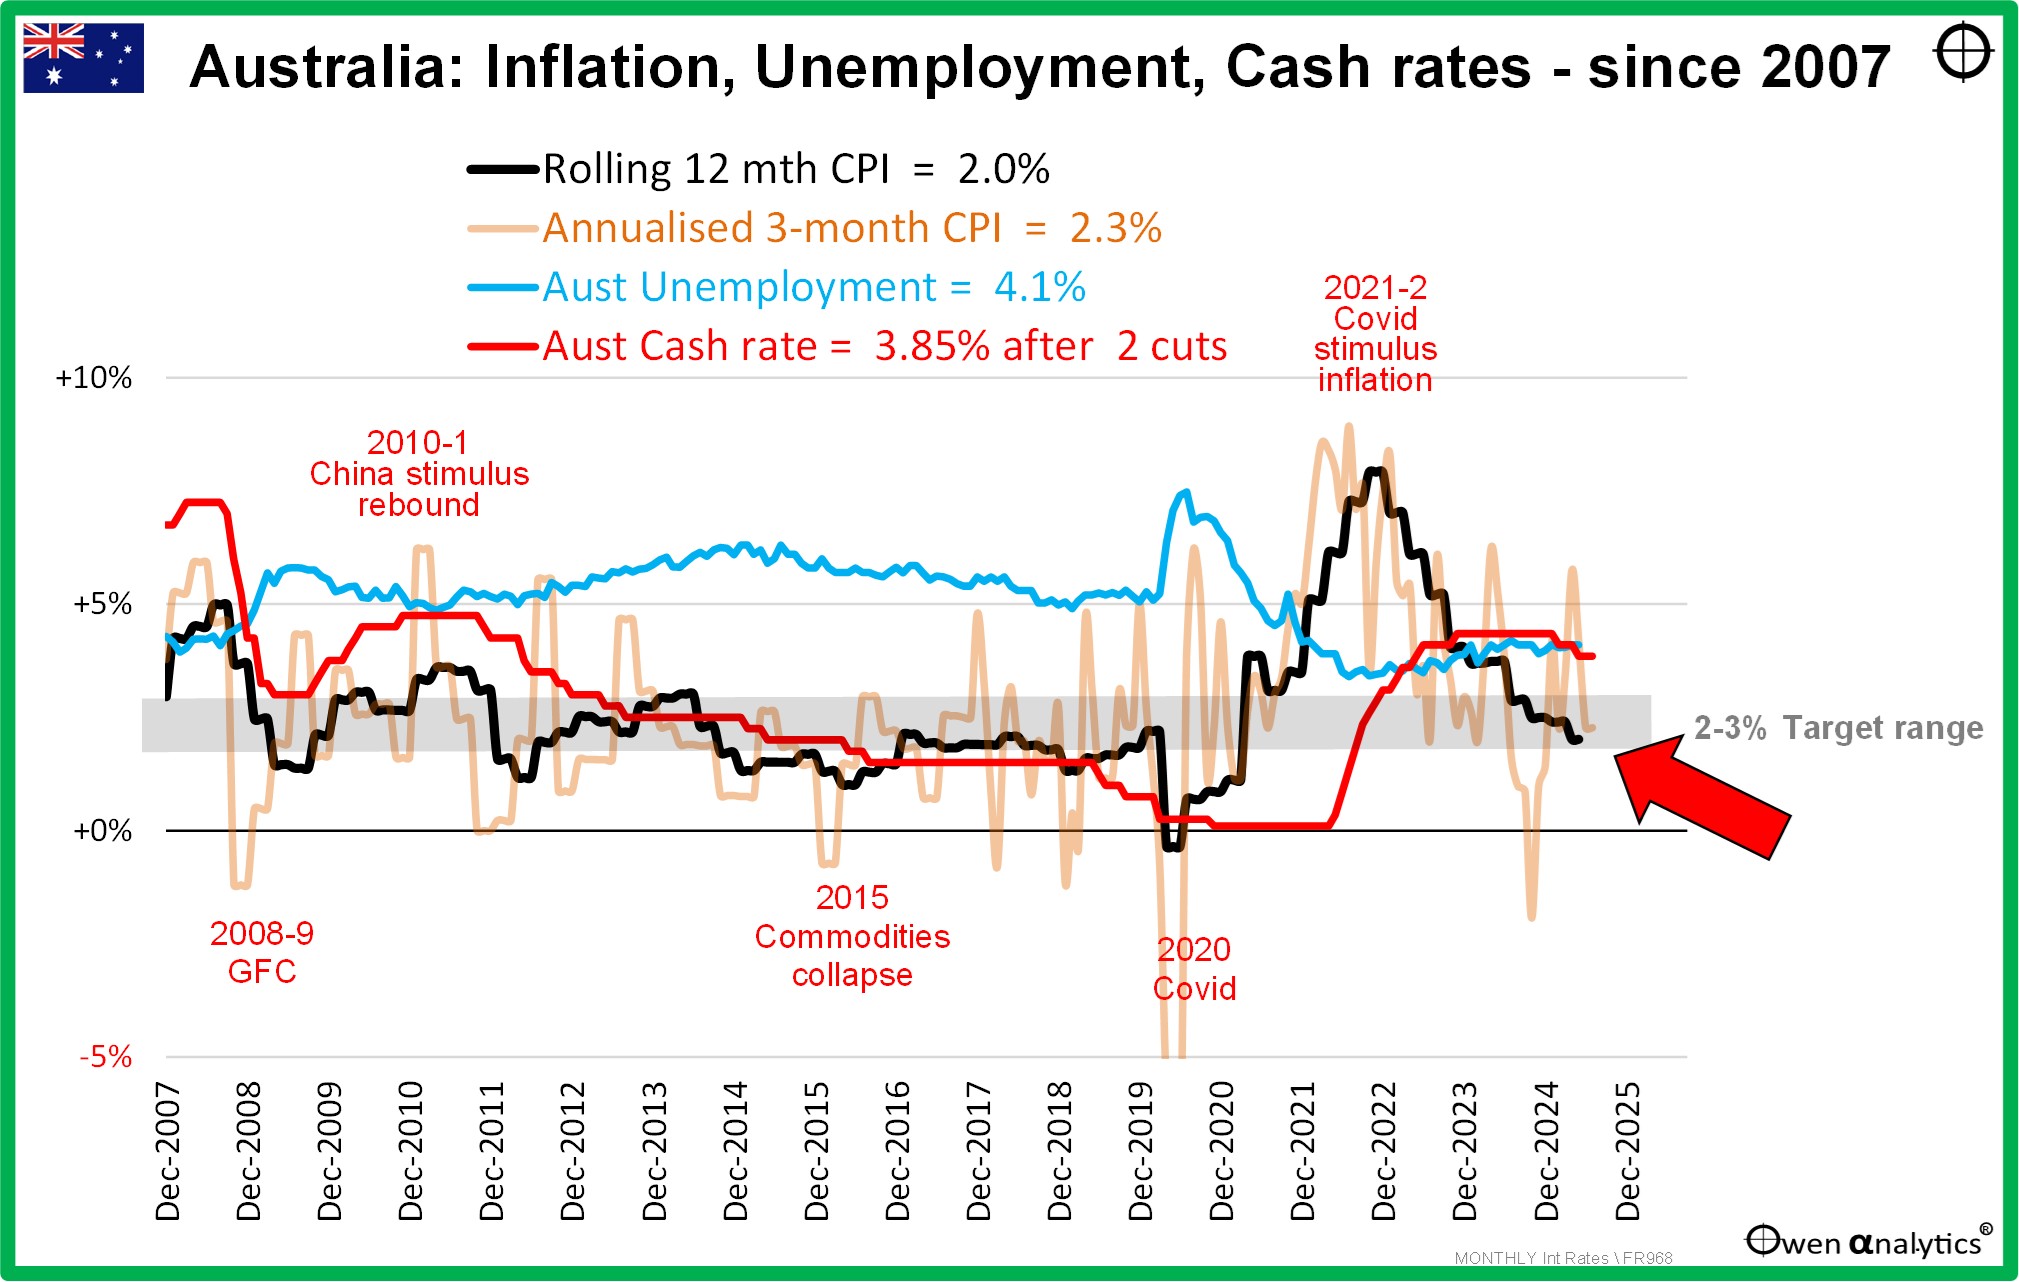
The 12-month CPI inflation rate is now finally back to 2%, and the annualised 3-month rate is down to 2.3%. However the RBA’s preferred ‘trimmed mean’ measure is higher at 2.7%. These numbers have been artificially depressed by temporary government power and rent subsidies, and the RBA has made it clear it is not being fooled by Smiling Jim Charmer’s trickery. Hence the RBA resisted pressure (and market expectations) to cut rates at its July meeting despite the improving inflation numbers.
As in the case of the US, the most obvious motivation for a further series of rate cuts would be a local recession, which would lift unemployment and probably soften inflation pressures, allowing (or necessitating) rate cuts.
Unemployment in Australia has been rising slowly but steadily over the past year, and is now up to 4.3%. This is still relatively low rate, and the RBA regards this as inflationary because it is below the RBA’s non-inflationary rate of unemployment, ‘NAIRU’ of 4.5%.
‘Participation rates’ (the number of people in the workforce as a percentage of working age population) are at record highs, but this is almost entirely due to expansionary government-related hiring. The government sector has been expanding, but the real economy is doing it tough, with rate hikes eating into top-line revenues and raising financing costs.
In the real world, business insolvencies have shot up to levels not seen since the deep 1990-1 recession. Job numbers are booming in the government sector, but business is doing it tough. See my recent report on insolvency numbers in Australia –
In essence, the government has artificially suppressing both the inflation numbers (with deficit-funded subsidies and hand-outs), and also artificially supressing the unemployment numbers (with deficit-funded jobs in the ever-expanding, low-productivity, wealth-sapping, government-related sector.
With the latest data, rising unemployment and falling inflation are probably enough for the RBA to make another rate cut at its next meeting on 11-12 August.
Check out my recent story on the history of Federal government deficits and debts in Australia –
Bond markets
While interest rates at the short end remained low in anticipation of further rate cuts, rates at the long end edged upward in July virtually across the board with continued fears of inflation in the coming years.
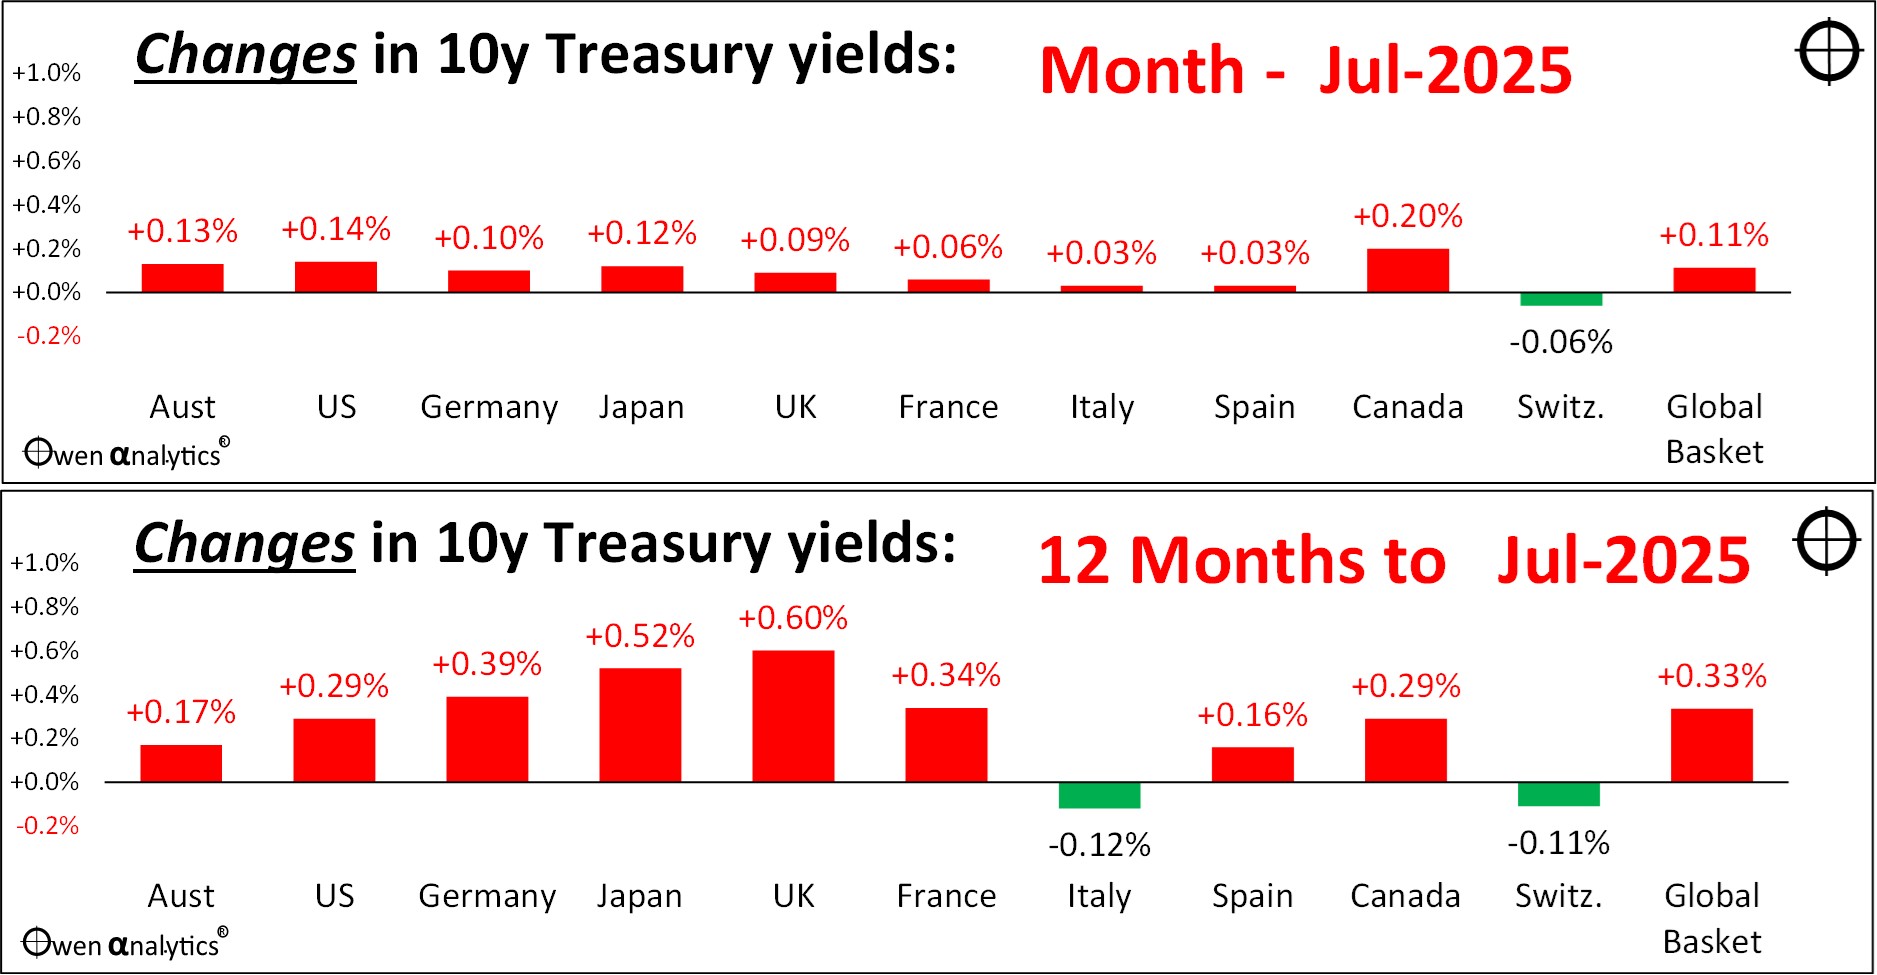
(In my bond yield charts like this one, I show rising yields in red as they mean lower bond prices & returns; and I show falling yields in green as they mean rising bond prices & returns.)
There are several likely causes for bond yields to rise while inflation continues to fall back toward target levels. One is the longer-term impacts of Trump’s tariffs and the generally global trend to on-shoring of manufacturing leading to higher domestic prices. Another is a fear that Trump’s replacement Fed Chair after (Powell’s term ends May 2026) will cut US rates regardless of economic conditions, as promised by Trump.
In addition we have rising military spending around the world, increasing the demand and prices of commodities, which feed into higher input costs and prices for all goods generally.
Another fear is the impact of the US Treasury having to finance an additional $5 trillion of debt under Trump’s recently passed ‘Big Beautiful Bill’.
Commodities markets
The longer term outlook for higher commodities prices, outlined above, is probably only it its early stages. At present, most industrial commodities markets are in a state of weak prices due to weak global demand and over-production. Hence the very poor performance of Australia’s big miners weighing heavily on ASX returns in recent years.
Despite these macro conditions for commodities, every month there is something going on somewhere. Here is my chart of price changes in major commodities markets for the month of July (upper chart) and past 12 months (lower chart) -
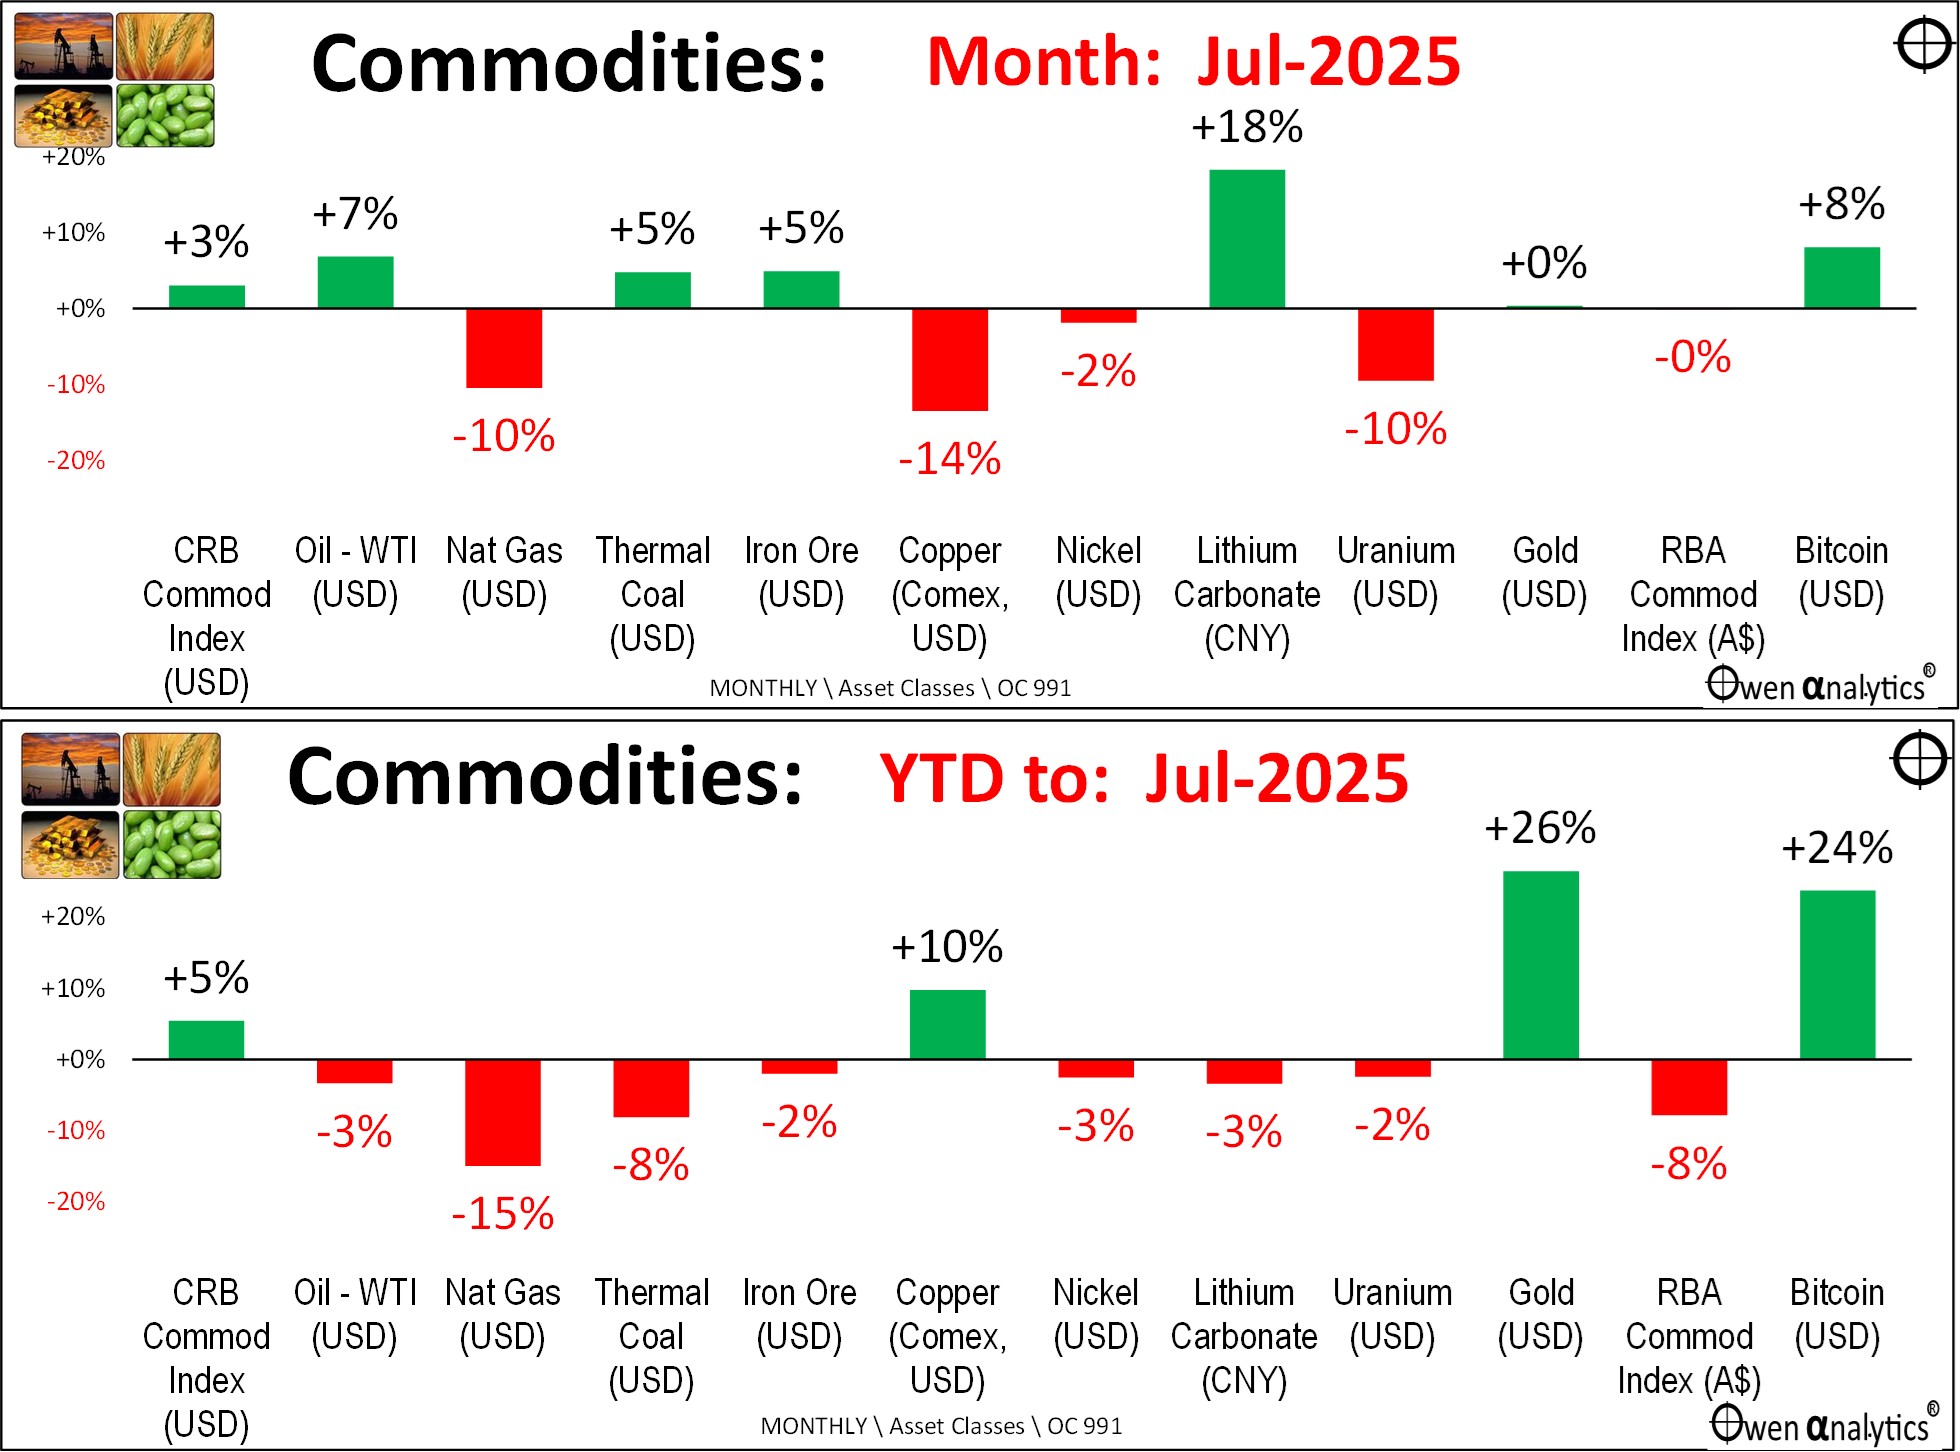
In July, iron ore prices were lifted back toward $100 per tonne by China’s announcement of the world’s largest dam/hydro project in Tibet. This long-awaited sign of much-needed Chinese stimulus lifted the share prices of the three iron ore majors (RIO, BHP, FMG), until RIO’s end of month announcement of cuts to profits and dividends due to lower iron ore volumes and prices.
Hopes of further Chinese stimulus also lifted the prices of other industrial metals, and also oil back to near US$70 per barrel.
The stand-out for the month was copper, where US prices plunged -20% when Trump announced that his previous 50% tariff on copper imports would only apply to semi-finished copper like cables and wires, but not to copper ores and concentrates, which the US still needs to import. The plunge in the US price erased most of the big premium copper was trading at in the US market over the London market.
Lithium markets got a break at long last after the past three years of falling prices due to weak demand and over-production. There is finally some hope that more mine closures will ease the over-supply problem.
Gold prices continued to rise on a bunch of festering fears – including inflation, political unrest, military tensions, and general distrust in traditional financial institutions.
Bitcoin also got a boost from Trump’s progressive shift to embrace the crypto-sphere, including the passage of the ‘Genius Act’. However, Gold is still ahead over the past 12 months (lower chart).
Exciting times indeed . . .
‘Till next time – safe investing!