Key points
- Company insolvencies in Australia have soared back to levels not seen since the deep 1990-1 recession.
- Business is doing it tough – on recession footing already.
- But the rapidly expanding government sector is doing fine – accounting for almost all the growth in jobs and economic 'activity' (and artificially suppressing inflation and unemployment numbers).
Today’s chart shows annual company insolvencies since 1988, covering the last few economic cycles.
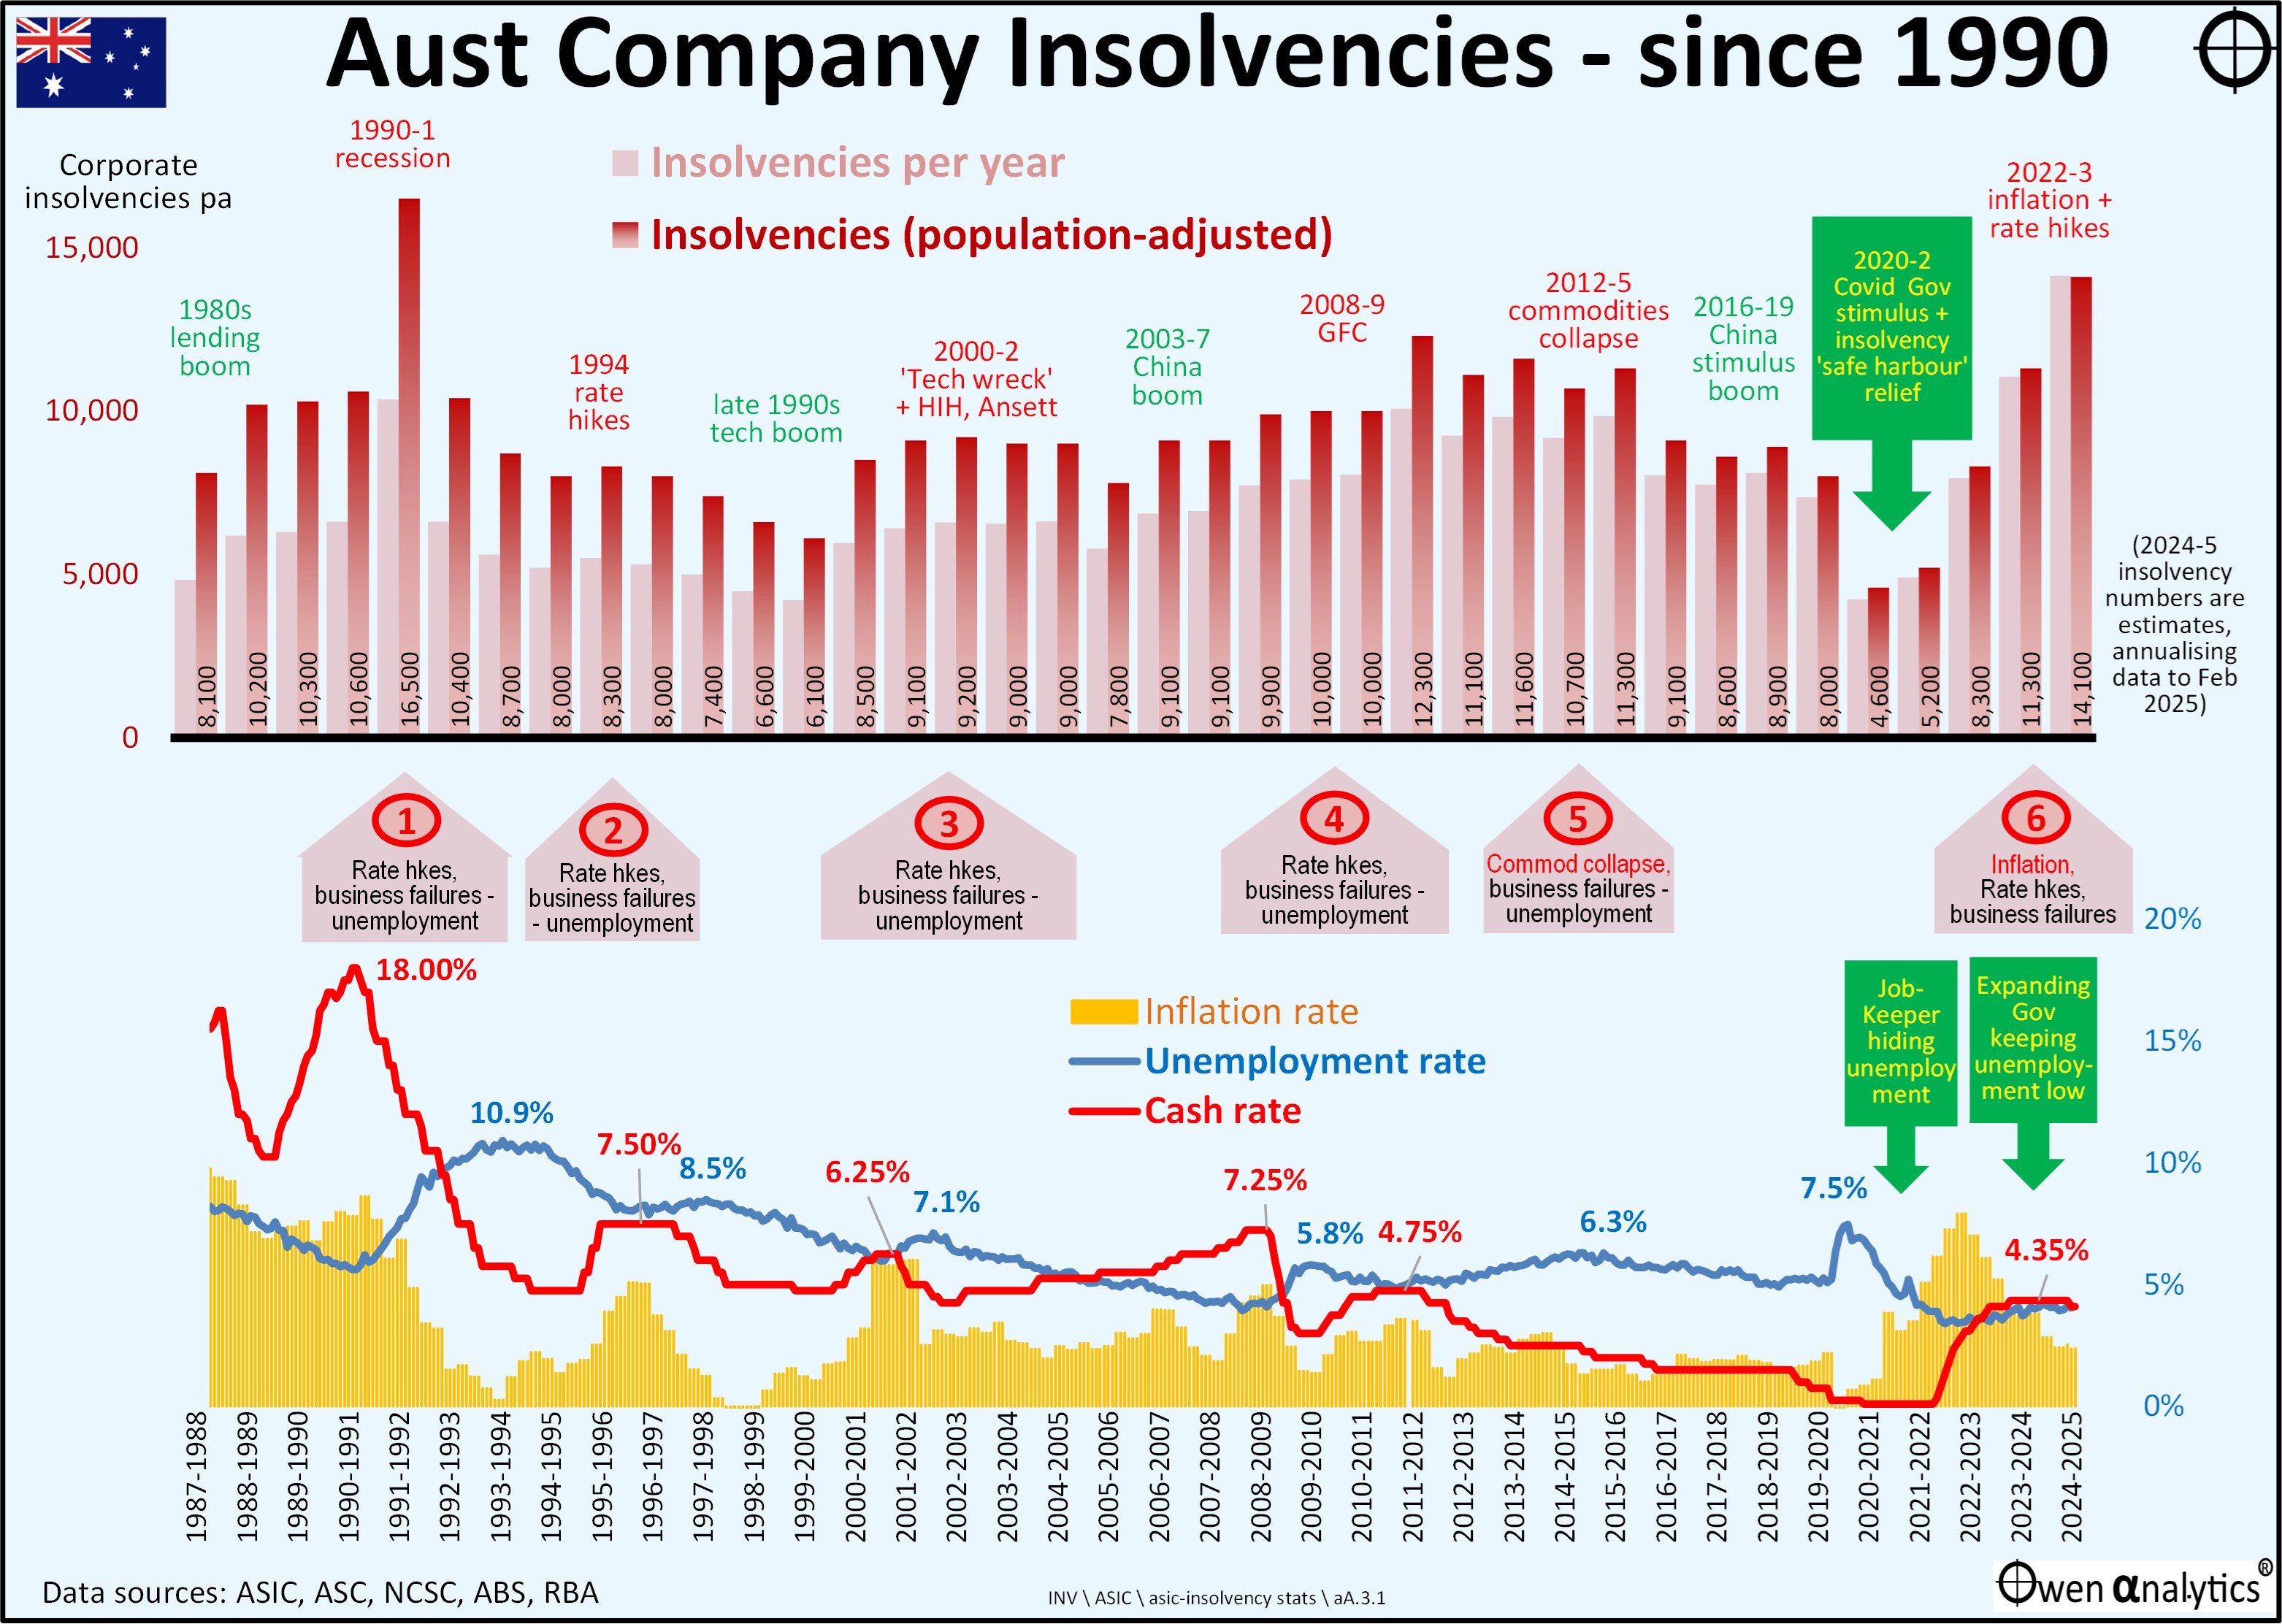
In the upper section, the light pink bars show the number of insolvencies per year. To the far right, the number for the current 2024-5 June year is a simple 12-month extrapolation of the nine months of data to March 2025. It is higher than the worst year of the GFC, and now higher than the early 1990s recession peak.
Need to adjust for population growth
I have added maroon bars in the upper section to show the insolvency numbers in population-adjusted terms. This is necessary so we can compare like for like. Australia’s population has increased by 63% since 1990, and so can expect that the level of economic activity, like company insolvencies, would be higher by more or less a similar proportion.
11,052 insolvencies in 2023-4, and my estimate of 14,100 for 2024-5 are both higher than the peak level of 10,361 insolvencies in 1991-2 in absolute terms, However, this year’s 14,100 is still below the population-adjusted 16,500 for 1991-2. That is just as well – as we are not even in a ‘recession’ yet!
The lower section of the chart shows inflation, cash rates, and unemployment rates. These are integral to insolvency cycles.
Insolvencies through economic cycles
Insolvency numbers rise and fall with economic cycles. The number of business failures rise in economic slowdowns, then fall back in economic recoveries and booms. Most, but not all, economic slowdowns are preceded by interest rate hikes (normally to cool gathering inflation in economic booms), and are then followed by rising unemployment.
The chart highlights six economic cycles in Australia since 1990. The pattern is the same almost every case – (A) rate hikes to tackle inflation, which result in (B) a rise in business failures putting people out of work, which (C) lifts the unemployment rate.
Cycle 1 – Keating’s ‘recession we had to have’
Bank deregulation in the mid-1980s triggered an orgy of mad and bad lending that fuelled speculative booms in corporate take-overs and property construction. Interest rates were hiked to up 18% in November 1989 to tackle 8.6% inflation, resulting in a spike in business failures, sending unemployment to 10.9% by the end of 1992. Cash rates had to be cut back to 4.75% in the recession to stimulate business recovery and employment.
Cycle 2 – 1994 inflation scare & bond crisis
After the revival of business activity and inflation following the 1990-s recession, interest rates were hiked to 7.5% in December 1994 to tackle 5.1% inflation, resulting in a spike in business failures, and sending unemployment back up to 8.5% by February 1997. Cash rates were cut back to 4.75% again to stimulate business recovery and employment.
Cycle 3 – 2001-2 ‘tech-wreck’
In the latter stages of the late 1990s speculative ‘dot-com’ boom, interest rates were hiked to 6.25% in August 2000 to tackle 6.1% inflation, resulting in a spike in business failures, and sending unemployment to 7.1% by October 2001. Cash rates were cut back to 4.25% to stimulate business recovery and employment.
Australia avoided an economic recession on that occasion, unlike the US, where the recession was deep and protracted. The slowdown in Australia was exacerbated by some large corporate collapses here – notably HIH Insurance and Ansett Airlines, both of which had major knock-on effects to small and medium businesses across the economy.
Cycle 4 – 2008-9 global financial crisis
In the late stages of the 2003-7 China / commodities / credit boom, interest rates were hiked to 7.25% in March 2008 to tackle 5% inflation, resulting in a spike in business failures, and sending unemployment to 5.8% in June 2009. Cash rates were cut back to 3% in the recession to stimulate business recovery and employment.
Insolvency numbers did not rise as much in the GFC (which was a much deep economic contraction in Australia than the 2001-2 ‘tech-wreck’) because the GFC was quickly followed by the 2010-1 Chinese stimulus boom.
Cycle 5 – 2014-5 China slowdown, commodities collapse, oil/gas/steel crisis
This cycle was not caused by inflation, which was running at a very low 1.5% at the time. This cycle was caused by China’s post-GFC-stimulus slowdown, resulting in a collapse in commodities prices that caused a string of oil/gas/steel bankruptcies in Australia and around the world, resulting in a spike in business failures, and sending unemployment to 6.2% from January 2015. Cash rates were cut back to 1.5% in the economic slowdown to stimulate business recovery and employment.
Although it was not technically a ‘recession’ here, we had some major collapses in 2015-6 including: steel maker Arrium (formerly OneSteel, spun out of BHP), Clive Palmer’s Qld Nickel, South Australian copper miner Hillgrove, retailer Dick Smith, restaurant group Keystone, Masters Hardware chain, QuickSilver, Homeware chain HomeArt, Vocation, building group Home Australia, Linc Energy, Pumpkin Patch, Laura Ashley, and many others.
Covid lockdown insolvency hiatus
When Covid arrived on our shores, State and Territory governments locked the entire nation of citizens in their homes and out of their workplaces and businesses. The lockdowns triggered the sharpest and deepest economic contraction since the 1930s Great Depression, here and around the world. Cash rates were cut to 0.1%, the unemployment rate soared to 7.5%, but business insolvency numbers did not rise, they fell!
The number of insolvencies fell dramatically due partly to the support measures and hand-outs, but partly also because of the measures preventing creditors from suing for debts. Here is how they worked:
To counter the economic effects of the lockdowns, governments acted on three main policy fronts:
1.. Monetary policy measures
These included: cash rate cut to 0.1%, RBA’s bond buying programs (‘QE’ or ‘quantitative easing’) to suppress long term interest rates, and providing ultra-cheap loans to banks to on-lend to businesses and consumers. (Most of it just went on housing loans that inflated house prices)
2.. Fiscal policy measures
These included: one-off payments to pensioners and other recipients, Job Keeper payments, wage subsidies for trainees and apprentices, spending on capital works.
Many of these policies were aimed primarily at companies as employers – including many companies that pocketed Job Keeper payments instead of passing them on to employees. There were other measures including increases in thresholds for Instant Asset Write-offs, and waving payroll taxes.
These monetary and fiscal policy measures led to booms in spending, jobs, house prices, and booms in pretty much anything else people could think of to throw buckets of free money at – including designer sneakers, ‘meme stocks’, cryptos, and NFTs.
3.. Directly suppressing insolvencies by curtailing creditors’ legal rights
There were also several measures that directly reduced company insolvencies, including:
- Increasing the threshold at which creditors could issue a statutory demand on a company from $2,000 to $20,000
- temporarily extending the time companies had to respond to a statutory demand they received from 21 days to 6 months
- temporarily relieving directors of personal liability for insolvent trading with respect to debts incurred in the ordinary course of a company’s business (the ‘safe harbour’ provisions).
Essentially, the rules were changed temporarily, to severely limit the ability for creditors to pursue companies for debts owed, including winding up orders. These measures kept many thousands of businesses alive and also supressed the official unemployment numbers.
Several economic commentators have suggested that Australia’s artificial support of businesses and suspension of insolvency laws are behind Australia’s very poor labour productivity performance in recent years, especially in contrast to rising productivity in the US, where businesses were allowed to fail if they were unable to pay their creditors (more on this below).
Cycle 6 – Post-Covid inflation & business failures – the current cycle
The massive waves of monetary and fiscal stimulus (plus temporary supply restrictions from the Covid lockdowns, and several unrelated weather events) sent inflation soaring. Interest rates were hiked belatedly to 4.35% in December 2023 to tackle 7.9% inflation.
When the stimulus measures and bankruptcy law relief ended, so did the hiatus in business failures. Insolvency rates have soared back to well above pre-Covid levels.
Industries to watch
Here is a picture of monthly company insolvency numbers by industry, since 2013:

To the right of the above chart I highlight the industries where insolvencies are rising the fastest.
Australia is ‘construction central’, with a very large reliance on building and related industries and trades. Construction companies have been hit not only by rising interest rates, but also by rapidly rising materials costs, which is fatal to building companies with fixed price construction contracts. The current cycle has seen several major building firms collapse, and this is likely to continue and probably escalate.
Insolvencies in Accommodation and Food are also rising rapidly, and higher now than over the past decade on the chart. This may be the effects of higher wages costs and lower tourism, especially from China.
Also with insolvency levels rising quickly, and above pre-covid levels are Retail and Manufacturing industries. Retail probably affected by the ongoing ‘Amazoning’ of retail, which accelerated during the Covid lockdowns.
Where are we now?
Unemployment has drifted up from a low of 3.1% in October-November 2022 to 4.1% in early 2025. This is still relatively low, and we are also at record ‘participation rates’ (the number of people in the workforce as a percentage of working age population).
The problem is that the jobs growth over the past couple of years has been almost entirely due to expansionary government hiring. (An estimated 80-85% of all jobs created have been tax-payer funded).
Business is doing it tough
The bottom line is that business is doing it tough – as tough as it as been since the 1990-1 recession – and we haven’t even had a recession yet!
Taking a look at the first chart again – it may well be that the high numbers of insolvencies in the past two years is nothing more than a catch-up from the suppressed levels in the Covid years – ie the recent insolvencies are just the failure of the zombie companies that would have failed in the Covid era had it not been for the Covid support. Or is it the start of a new trend to higher insolvency numbers?
I think the latter.
On top of input price inflation, businesses have to deal with centrally-imposed wage inflation with no hint of productivity links, plus a raft of new laws and regulations that unwind productivity-boosting reforms that had been in place for decades. And of course we have a new set of unknowns with Trump’s tariff wars. The new world calls for more flexibility, not more rules and restrictions.
On the other hand, the public sector is doing fine.
Not only is the government artificially suppressing inflation numbers with temporary subsidies and hand-outs (which fuel inflation rather than attacking the root cause of underlying price rises), they are also artificially masking business pain by becoming the ‘employer of last resort’ with expansionary, deficit spending).
There is nothing inherently wrong with public sector jobs, but business is what generates growth in productivity and living standards. But do governments still believe that?
‘New’ role of government?
When (not if) the next major economic slowdown hits us (whatever the trigger), there is a good case that governments will step in any do whatever they can to prevent unemployment and company insolvencies, just like they did during Covid – hopefully not as scatter-gun or as expensive or inflationary as the last effort.
Why?
The forty-year era of de-regulation, disinflation, globalisation, free-trade, neo-liberal, laissez-faire, free-market capitalism, tax cuts, and hands-off governments, began in the early 1980s.
That era is well and truly over. The GFC was probably the begining of the end, and the Covid lockdown experience, plus rising populism, nationalism, and protectionism probably sealed it.
Governments, including in Australia, seem to have now returned to the 1930s to 1970s era of interventist, ‘full-employment’, centrist, protectionist, re-regulating, expansionary, hands-on governments that meddle in, and try to control, everything, and try to protect consumers and voters from economic pain (except inflation, where they can always attribute blame to outside forces).
Our government’s actions in the Covid lockdowns, and attempts ‘save jobs’ and prevent company insolvences at almost any cost, are evidence of that.
What will governments do next time?
I vividly remember living and working through the last two ‘real recessions’ in Australia – in 1981-3 and 1990-1.
- In the early 1980s recession, unemployment rose to 10.4% by Sepember 1983 and then remained above 5% for the rest of the 1980s.
- In the early 1990s recession, unemployment rose to 10.9% by December 1992, and then remained above 6% for the rest of the 1990s.
In both cases, the daily news media were full of harrowing stories of corporate and personal bankruptcies every day for several years.
The 2008-9 GFC was different in that it was followed very quickly by the massive China stimulus boom, and it was also countered with far more interventionist government support measures than previous recessions.
The 2020 Covid recession was an even more extreme illustration of governments becoming even more interventionist, throwing (borrowed) money at litterally anything and everything.
When the next big economic crisis hits, I can’t see either of the two main political parties sittting back and letting Joseph Schumpeter’s ‘creative destruction’ do its constructive work, like they did in the 1980s and 1990s.
(In short: Schumpeter’s ‘creative destruction’ idea is that recessions are a necessary and useful mechanism to let inefficient and unproductive companies fail, and allow new, more innovative, more efficient, more productive companies rise to take their places. That’s the upside. The downside is bank losses, bank runs and failures, and massive social upeaveal with high unemployment that lasts years.)
Here in Australia, and around the world, I fear we are in a whole new era of big, interventionist, hands-on governments.
Money not a problem
Most western governments are going to be restrained by their already large deficits and high debt levels.
Australia is very different (the ‘lucky country!’) – blessed with seemingly endless rivers of export revenues and taxes from boundless reserves of valuable natural resources. These are most likely deep and broad enough to withstand major global challenges, like China’s slowdown, or tariff wars, or real wars.
In addition, Australia still has relatively low levels of central government debt, so money is unlikely to be a big restraint on spending to support workers/voters, and therefore companies, in future recessions.
Conclusions
- Company insolvencies in Australia are soaring back to levels not seen since the deep 1990-1 recession.
- Business is doing it tough – on recession footing already.
- But the rapidly expanding government sector is doing fine – accounting for almost all the growth in jobs and economic activity (and also supressing inflation numbers and unemployment numbers).
Best of luck to all businesses out there – large and small!
‘Till next time – safe investing…!
Further reading for insomniacs: