Key points:
-
-
- This instalment delves deeper into pricing and valuations for the 20 largest share markets in the world. It goes behind initial pricing metrics like p/e ratios, dividend yields, and price-to-book ratios, to look at underlying corporate profitability.
- The US market appears on the surface to be more expensive than other countries (higher p/e, lower dividend yields, higher price/book, etc), but US companies are the most profitable in the world, which justifies higher pricing.
- However, US company profitability is currently running at very high – and probably unsustainable - levels, similar to the 1990s ‘dot-com’ boom which collapsed in the ‘tech-wreck’ crash & US/global recession.
- Company profitability has been much lower in Australia than in the US for many decades (aside from one brief period). Why?
- Australian company returns on equity have been below the cost of equity capital (ie value-destroying) for decades. Why do investors keep bidding up share prices when underlying company ROEs are so low?
- Why corporate profitability matters to companies and investors.
- How do companies achieve high profit margins and high returns on equity?
This article is Part 4 in my 6-part series on world share market pricing. The articles in this series are:
This series is designed to be read in sequential order, so readers may get more out of today’s article if they have already read the prior articles via the links above.
Also take a look at my explanation in Part 2 of why I do this stuff, and why it is important for long-term investors like me to understand pricing and how it affects subsequent returns and wealth.
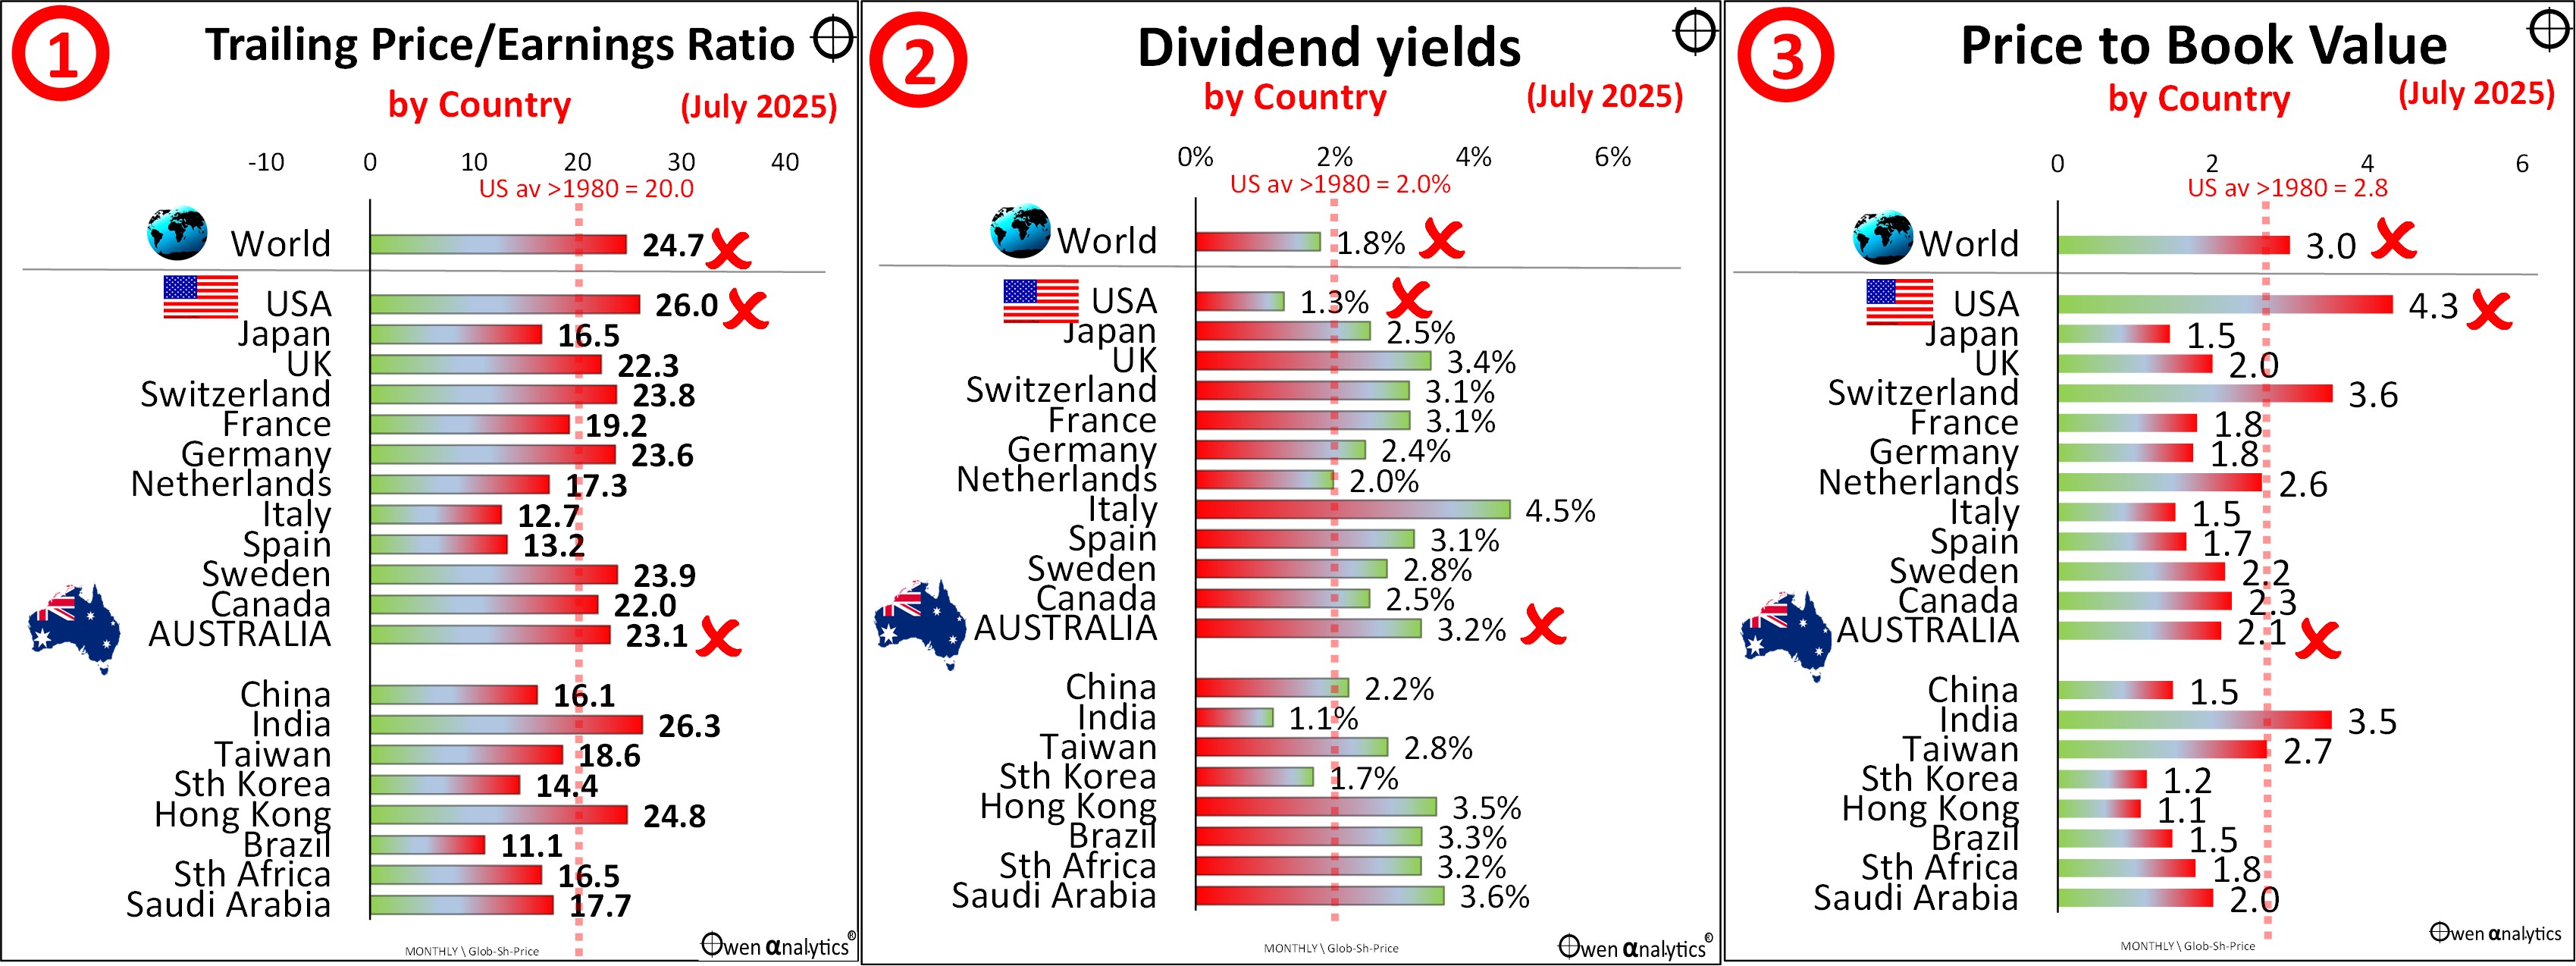
Before going to today’s charts, first let’s re-cap on why we are talking about share market pricing in the first place. Here are charts 1, 2, and 3 from the ‘Part 2’ article in this series, highlighting the apparent expensive pricing of most world share markets on three key measures – trailing price/earnings, dividend yields, and price-to-book values -
Then in Part 3, we looked at two further aspects of pricing - ‘Forward’ price/earnings ratios, and forward earnings growth assumptions.
There we saw that, although the US market appeared to be the most expensive market on the first three metrics (trailing P/E, dividend yields and price-to-book values), when we look at forward P/Es and earnings growth outlooks, the US market starts to look a lot less stretched and more achievable than several other markets.
Charts 6 & 7 – Profit Margins & Returns on Equity
Today’s charts show two further important aspects I consider when assessing share market pricing - Profit Margins and Returns on Equity. The charts show the same 20 largest share markets in the world covered in the other articles in this series. (All data is to end of July 2025 for consistency):
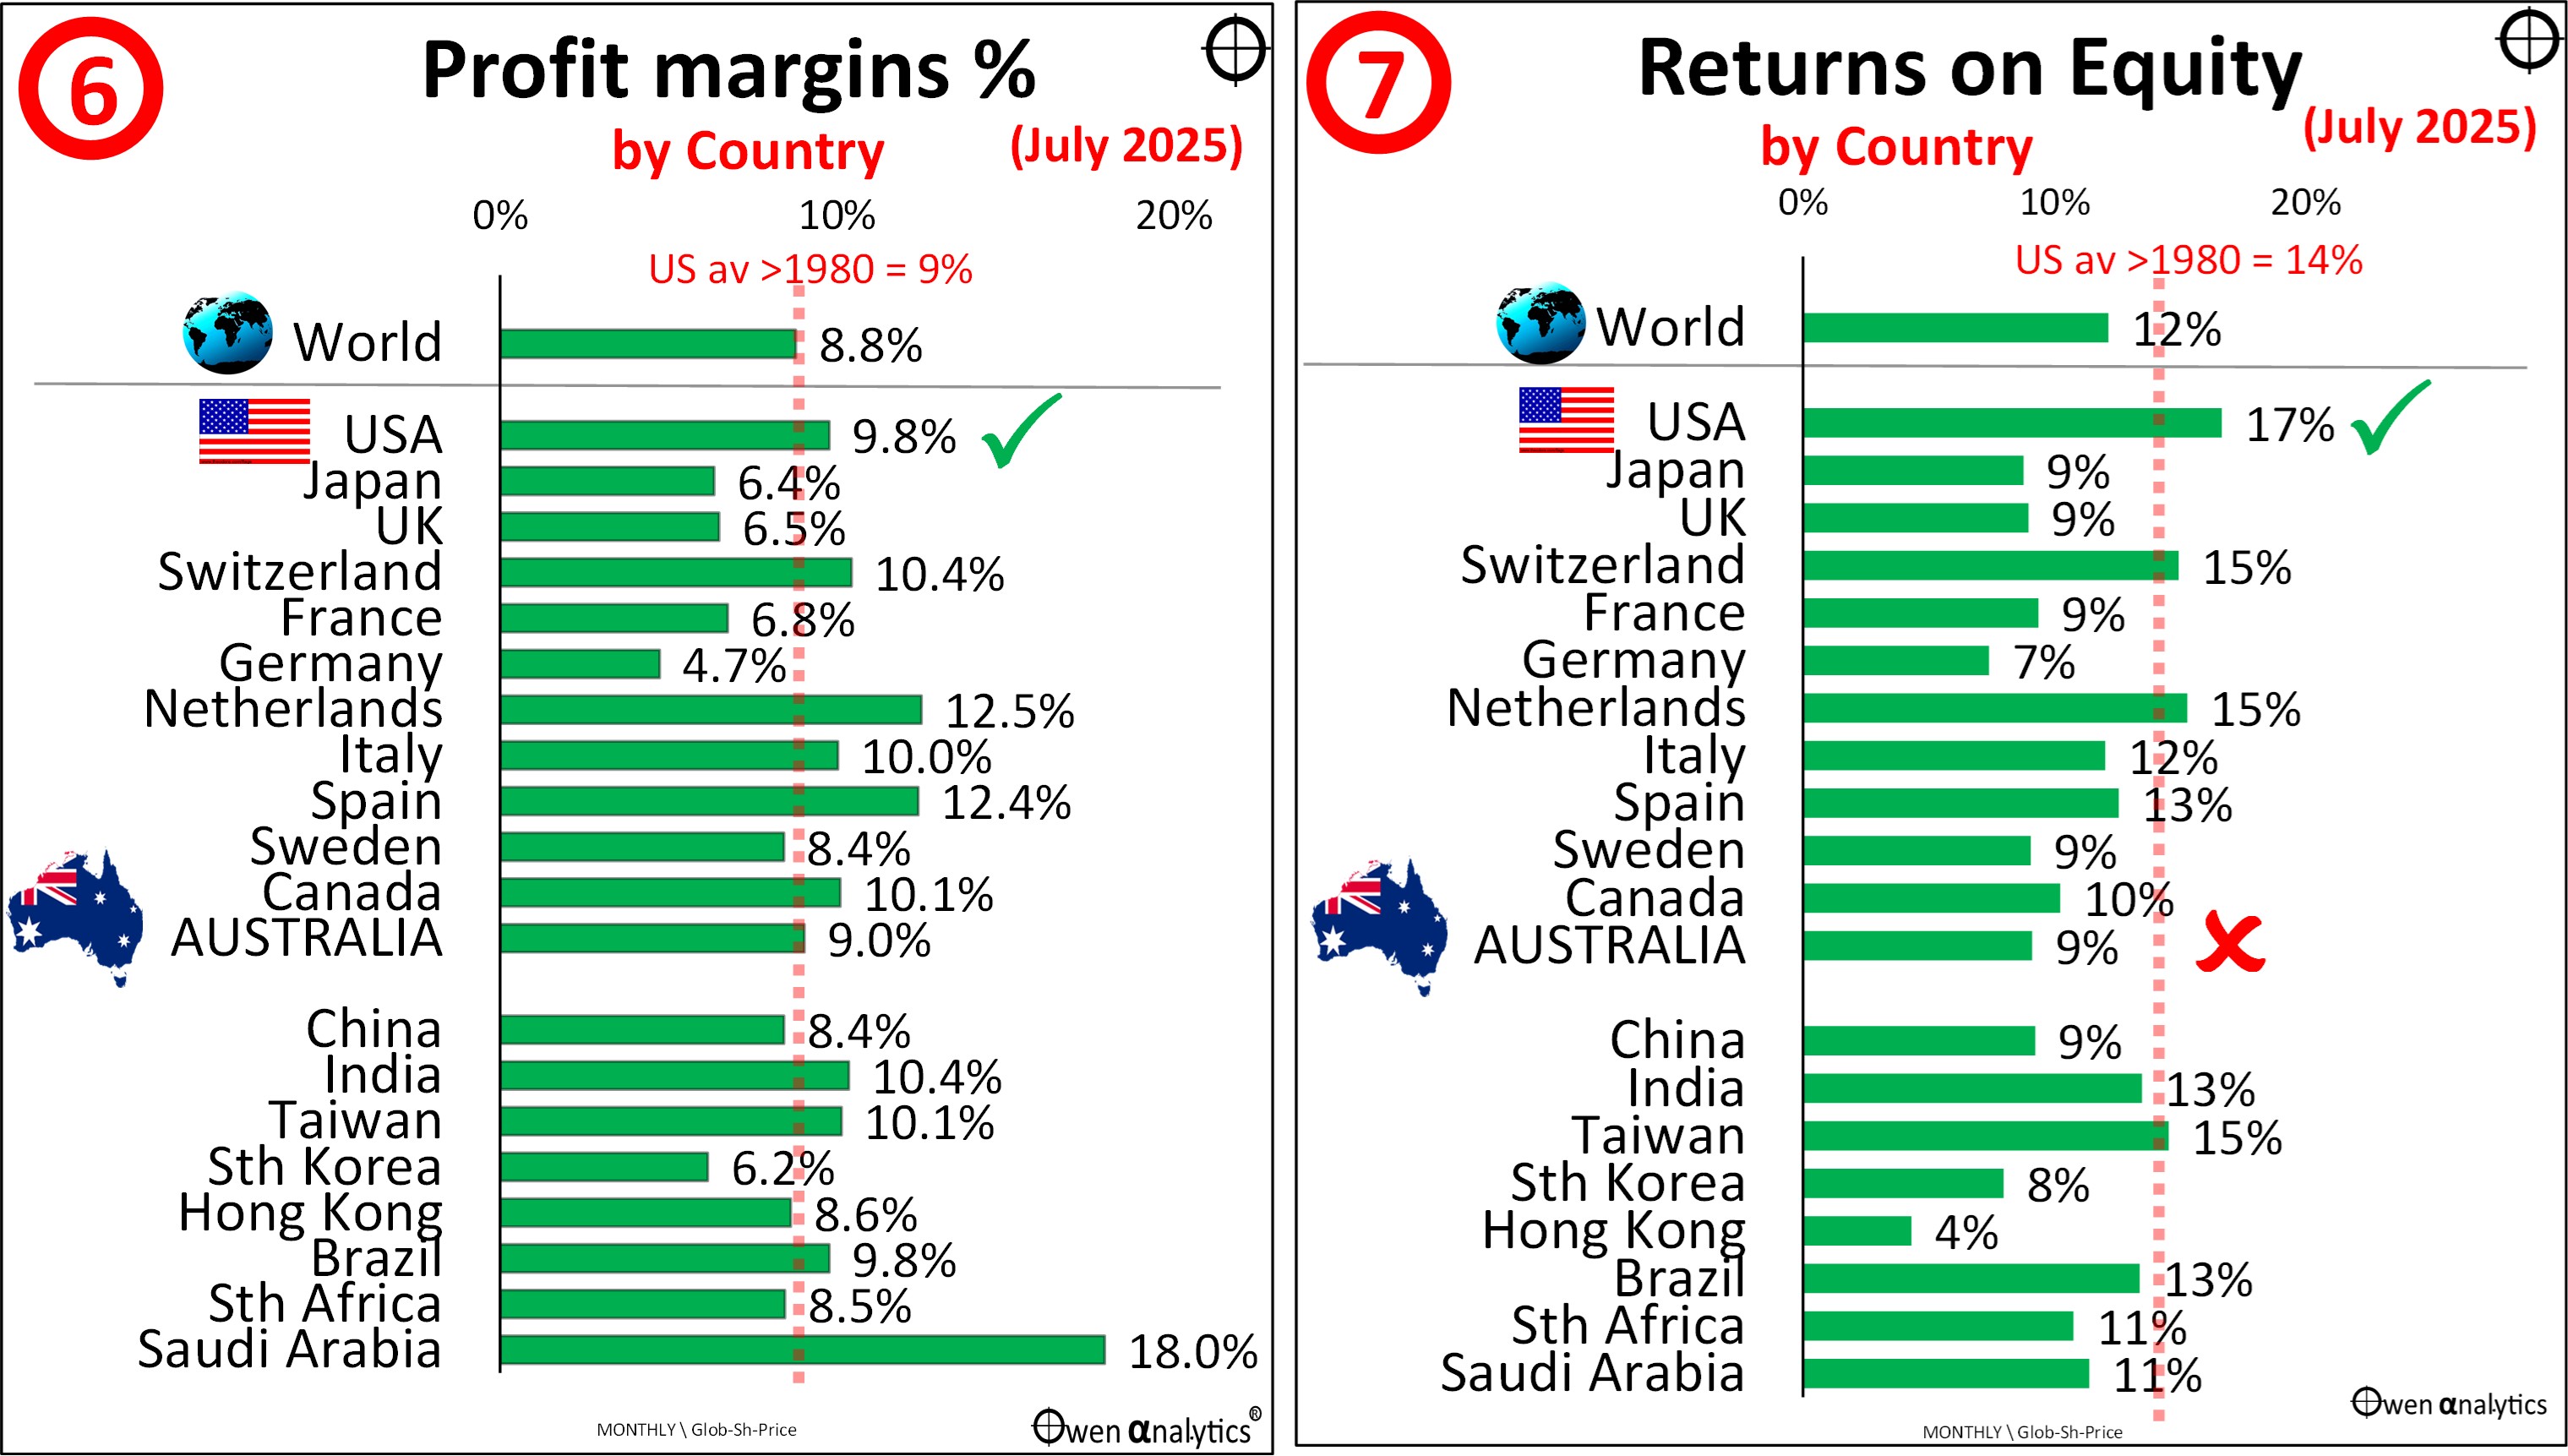
These are two important measures of corporate profitability.
Profit margins
The profit margin here is the amount of net profits per unit of revenues, or net profit/revenue. If a company has revenues of $1 million in a given year, and makes a net profit of $100k after the cost of goods/services sold, and after all fixed and variable costs, expenses and taxes, then its profit margin is 10% for the year. There are many different types and definitions of profit margin (and also different definitions of ‘revenues’ and ‘expenses’ in different countries, and different tax rates, etc), but this will suffice for the purpose of today’s comparison.
A company’s profit margin is a function of many variables, but of most interest to investors is its competitive positioning and pricing power. Investors want to find companies with strong pricing power, and are ‘price-makers’, not ‘price-takers’. Pricing power can come from a number of sources, including:
-
-
- Differentiated, value-adding products where customers are willing to pay premium prices well above cost
- Few or preferably no competitors (monopoly or oligopoly cartel), or patent protection
- Many suppliers, where the company can force suppliers to cut prices and/or supply at a loss
- Few or no regulations limiting its pricing power
Monopolies & ‘wide moats’
A company with strong pricing power is said to have a ‘wide moat’. Companies with relatively high pricing power and margins tend to be in a better position to cope with averse developments from competition, suppliers, interest rates, taxes, etc, and they can invest more in new products and/or acquisitions to grow and/or retain their dominant position.
This is how legendary fund manager Peter Lynch described Warren Buffett’s strategy of trying to find companies with monopolies or dominant positions in their niche markets:
“Once you’ve got an exclusive franchise in anything you can raise prices’ . . . . Always look for niches’
(Peter Lynch, ‘One Upon Wall Street’, 1989, 2000 edition, page 141).
Country differences
Much of the difference in profit margins per country is due to differences in their industry mix.
For example, the Australian share market is dominated by two low-margin sectors (banks and miners) where companies are selling un-differentiated, ‘commodity’ products, with no value-add, no ‘brand’ value, and no pricing power. They are price-takers, not price-makers.
One truck-load of iron ore is indistinguishable from the next, with pricing based purely in its iron content. One bank term deposit or home loan is indistinguishable from the next, with pricing based purely on the term and features that are offered by all competitors. Customers shop around primarily on price and have little or no brand loyalty. The UK share market has a similar industry mix.
In contrast, the US market is the home of a host of global giants that dominate their respective niches, with highly differentiated products, virtually no strong competitors, enormous consumer brand power and pricing power.
They are ‘price-makers’, not ‘price-takers’. They have long been virtual monopolies in their respective markets, having gobbled up and/or destroyed budding competitors with predatory pricing and/or anti-competitive acquisitions.
Whenever Microsoft jacks up the price of its MS Office software, billions of people in 200+ countries around the world just pay up. They have no choice.
Most Apple iPhone and Mac owners I have ever met have been crazed evangelists who happily pay double for a Chinese-made Apple device with the essentially the same functionality as a non-branded Chinese substitute for half the price that was made in the same factory by the same workers using the same components as their Apple product. And they are happy to keep buying new iPhones every year or two despite the fact that their old ones are still working perfectly well. Apple product owners don’t shop around and switch to competitors on price. Google, Facebook and Amazon, etc likewise dominate their respective markets, and have similar pricing power and brand loyalty.
(Adam Smith required strong and effective competition laws to prevent this sort of monopoly/predatory pricing power in order for his ‘invisible hand’ of capitalism to work for the benefit of society as a whole, but this critical element is missing in the form of capitalism we have today.)
Chart 6 shows that overall average profit margins from the US share market are currently running at a little above their long term average since 1980. Average profit margins vary over time of course (for example through economic cycles, tax changes, etc), and we explore this further with returns on equity below.
Returns on equity
This is the ultimate measure of corporate profitability – how many dollars of profit does a company, sector, or entire country index of companies generate per dollar of equity capital invested. Investors buy shares in companies primarily because they believe the share price will rise, but why should we believe it will rise?
In the short term, share prices of every company in every country jump around literally every second of every minute of every trading day in response to all sorts of unrelated and irrelevant ‘news’ often on the other side of the planet. This constant noise and volatility may be of interest day traders, but long-term investors ignore this and instead focus on the profit-generating ability of the company or sector or market they are assessing.
‘Return on Equity’ must exceed the ‘Cost of Equity’
Every company needs to be able generate a higher return on its long-term equity capital than the cost of long-term equity capital (called ‘ordinary’ equity in Australia, and ‘common’ equity in the US).
What is the cost of long-term equity for a company? It is the rate of return required to compensate an investor for investing in the business instead of a risk-free (or lower risk) long-term asset.
For example, today I can get a certain return of 4.3% pa for the next 10 years, with the interest payments every six months, plus the principal payment in 10 years’ time guaranteed by the Australian government (the current yield to maturity on a 10-year Commonwealth Government bond). I would be (almost) 100% confident that, whatever government is in power on 22nd August 2035, and whatever political and economic conditions are like, I would receive my interest payments every six months, and my principal repaid in full on a particular day in ten years’ time.
Knowing I could get ‘guaranteed’ risk-free 4.3% pa for ten years, in order to get me to instead buy shares in a company (or Australian share market ETF), I would require a much higher return than the risk-free 4.3%. For a diversified group of companies in a broad share market ETF, I would want a return something in the order of say 10%. Therefore, the ‘equity risk premium’ I would require from the broad share market would be the difference: around 5% to 6% pa.
My ‘cost of equity’ becomes the ‘discount rate’ I would apply to expected future cash flows to calculate a ‘fair’ present value of those cashflows, and it is also my ‘required return’ from the asset.
There are different methods for estimating the cost of equity. The ‘risk-free rate’ plus ‘equity risk premium’ method outlined above is a ‘demand-side’ approach. There are also ‘supply-side’ approaches that are based on ‘macro’ factors like GDP growth rates and corporate share of earnings, and other supply-side methods based on ‘micro’ factors like returns on equity and dividend payout rates.
The cost of equity (and discount rates, and required returns) vary in each country, and also vary in different eras (eg high inflation, low inflation, etc). However, for the current purpose today, I will assume the cost of equity capital for domestic investors in the broad share markets of major countries is around 10% pa.
Current ROEs
Chart 7 shows that the average return on equity across the US share market is not only higher than every other country at the moment, but is it also above the US long-term average return on equity of 14% since 1980 (horizontal red dotted line on Chart 7).
For the Australian share market, the average ROE currently running at 9%, which is much lower than the US ROE, and probably below the cost of equity.
Here is a chart of the overall average returns on equity from the Australian and US share markets since 1960. Here I have used rolling five-year average ROEs in order to smooth out short-term cyclical volatility:
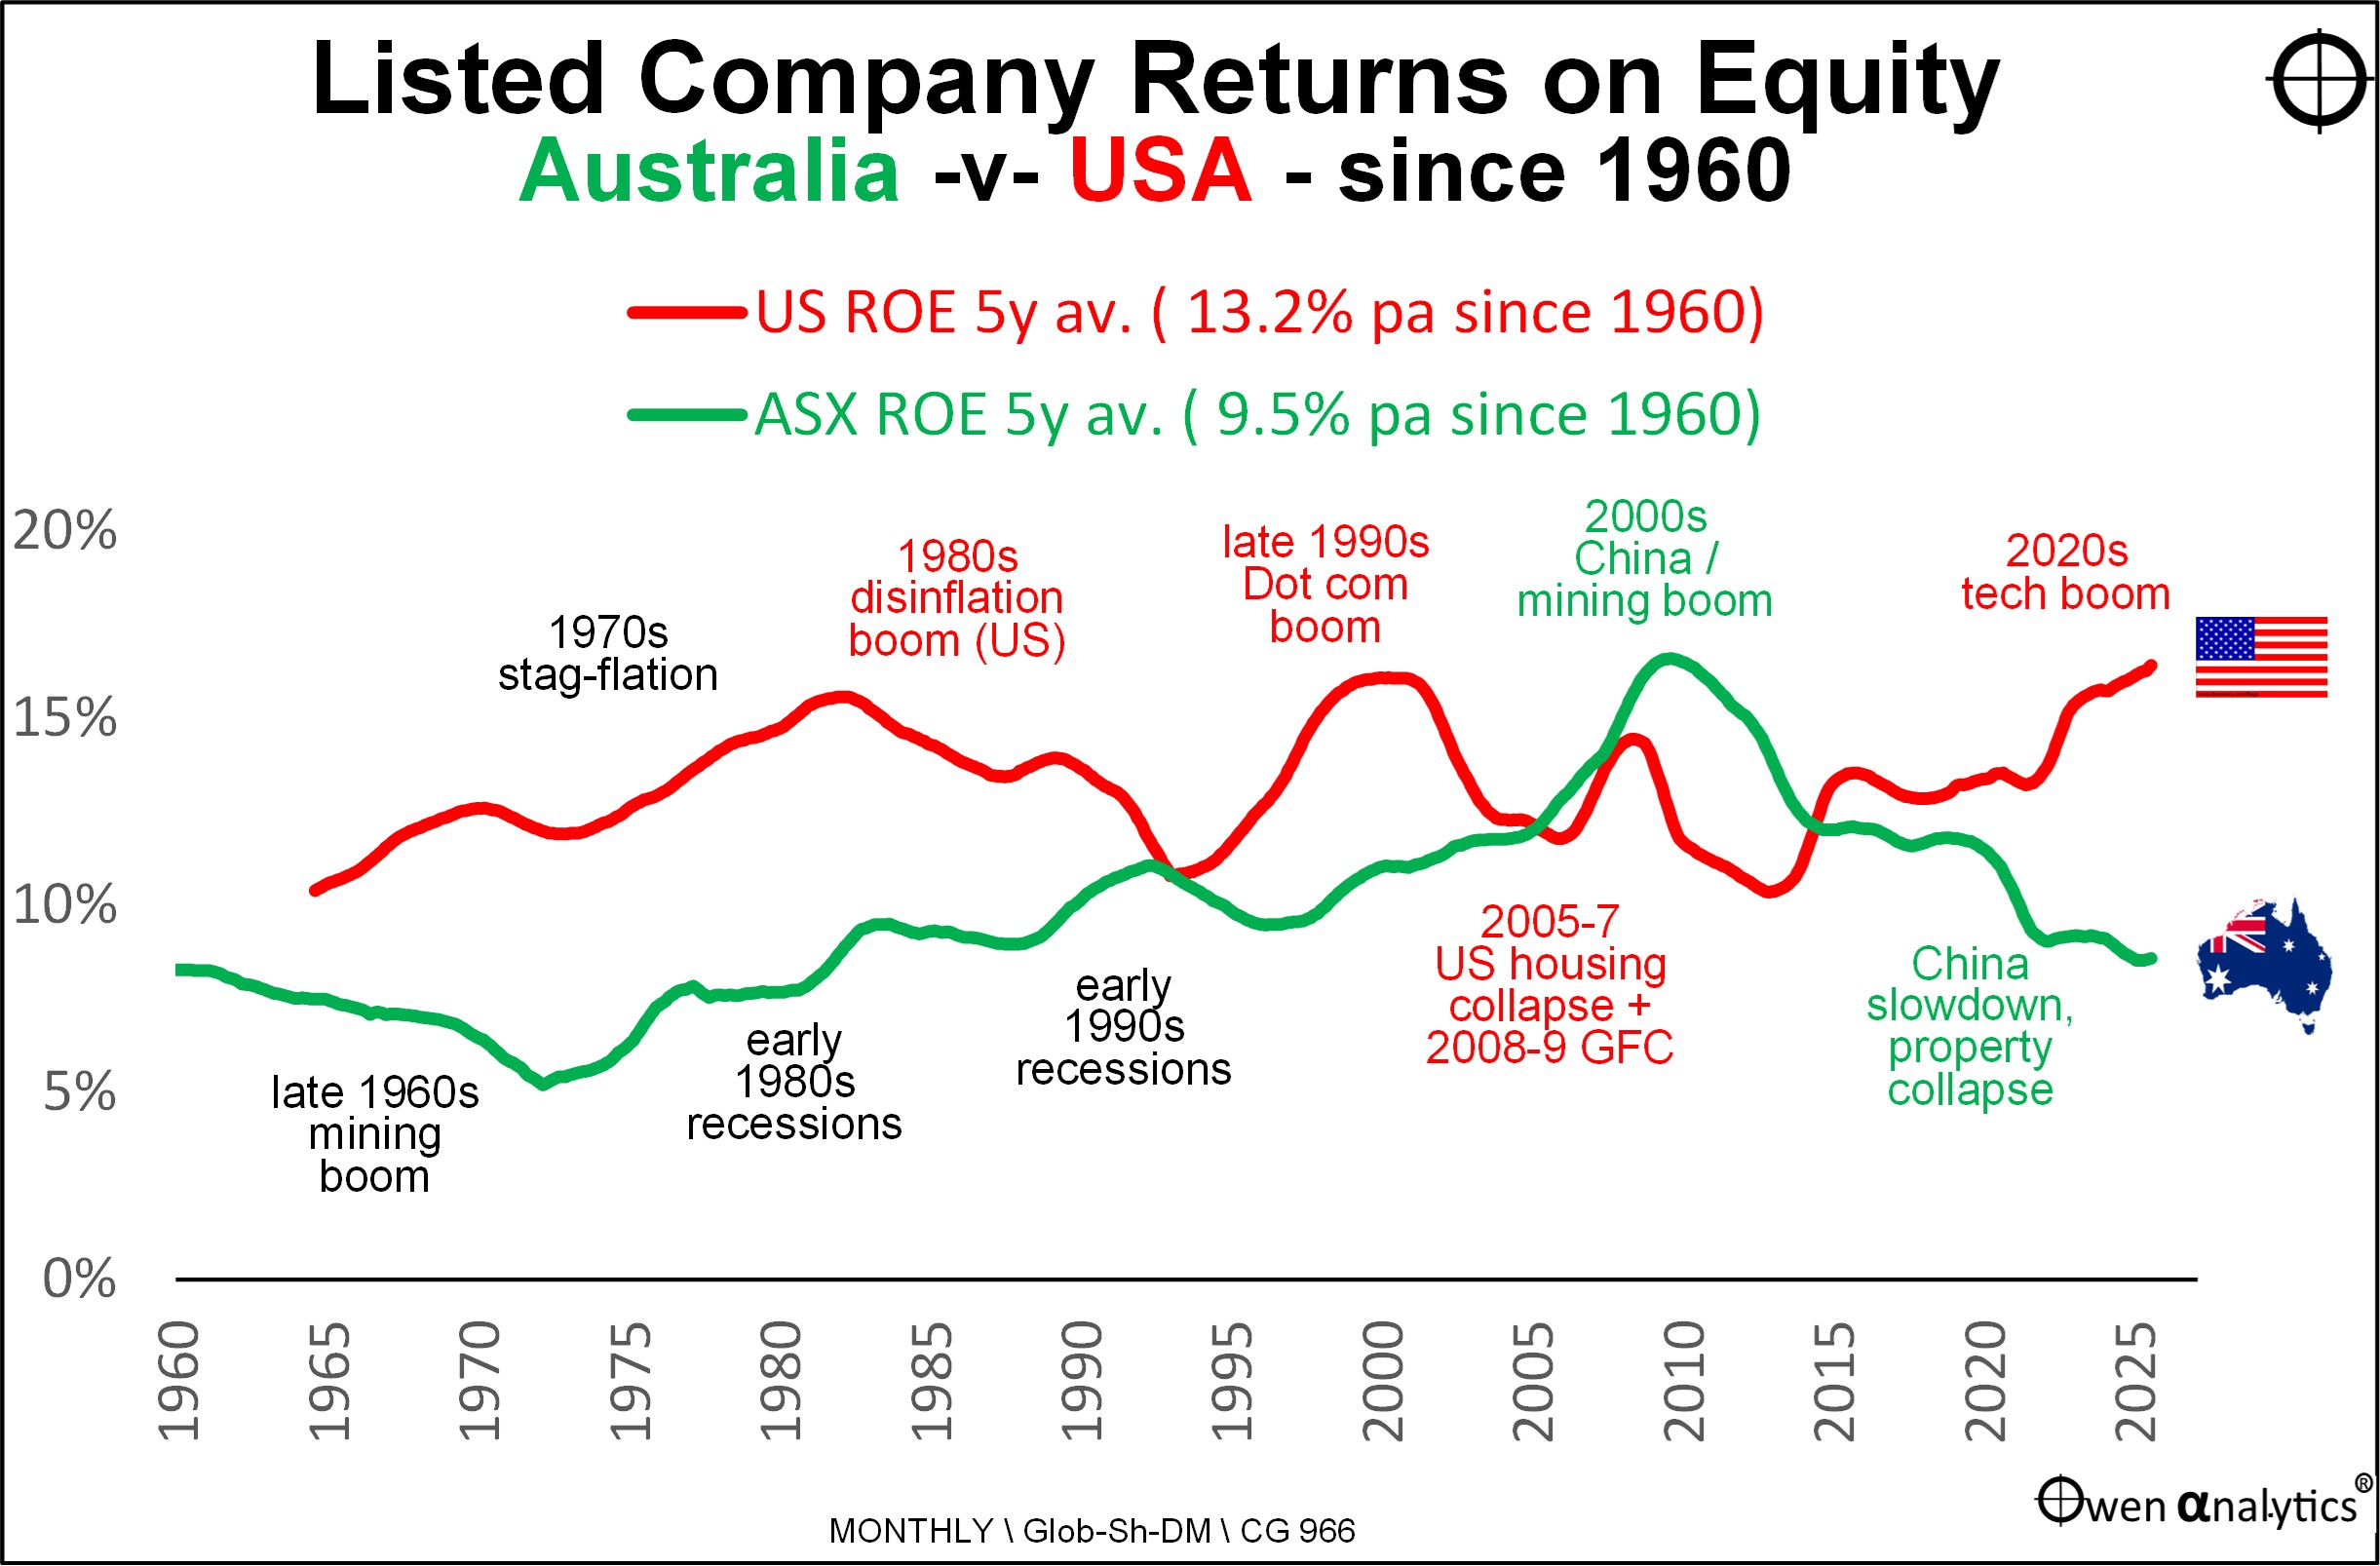
Over the whole period, average returns on equity from US listed companies have been significantly higher than from Australian listed companies – an average of 13.2% from US companies, compared to just 9.5% from Australian companies.
Even allowing for some legitimate differences between the markets (eg different accounting treatment of depreciation, amortisation, write-offs, etc) this is still a huge difference in ROEs.
The only time when Australian companies were more profitable than US companies was in the early-2000s China / mining / commodities boom that peaked in 2011 with the Chinese post-GFC stimulus boom, and ended with the 2012-15 Chinese slowdown and commodities collapse.
During that same period, corporate profitability in the US market was hit hard by the 2007-11 housing collapse, sub-prime crisis, and resultant 2008-9 GFC recession. Aside from that brief period, US corporate returns on equity have been higher than Australia for the rest of the 60+ year period since 1960.
Current US average ROE
US corporate returns on equity are currently running near all-time high levels (five year average of 16.4% pa, and 18% this year), thanks to the recent Covid stimulus boom and current tech boom. These are above the long-term average ROE of 13% from American companies.
Here are the current ROEs for the big US stocks: 150% for Apple, 115% for Nvidia, 41% for Meta/Facebook, 44% for Netflix, 35% for Alphabet/Google, 33% for Microsoft, 25% for Amazon. The laggard is Tesla on 8%.
Apart from Tesla, which is just another low-margin car maker, the ROEs for the other US giants are extraordinarily high. Their pricing power is high, competition is weak, and they have very little in the way of ‘hard assets’ on balance sheet - see Part 2: P/E ratios, Dividend Yields, Price-to-Book value (17 Aug 2025)
Current Australian average ROE
In contrast, Australian companies are currently running at a five year average return on equity of just 8.6%, and 9% this year. These are around half the ROE rates achieved in the 2000s China boom, when Australian ROEs peaked.
In recent years, mining profitability has been down since the post-2011 China slowdown, and the post-2021 Chinese property / construction collapse. Bank profitability has been flat since peaking in 2015, and is being crippled by declining margins, and soaring compliance costs, and penalties and reparations for their illegal activities (Hayne, etc).
The current average ROE for the Australian share market may look dismal, but it is actually not far below the Australian long-term average of 9.5% pa ROE since 1960.
Here are current ROEs for the ASX leaders:
-
-
- The big banks: 13% for CBA, 10% for WBC, 11% for NAB, 10% for ANZ 13% for Macq Bank.
- Big miners: 18% for BHP, 20% for FMG, 21% for RIO, 8% for Woodside.
- The others: 14% for Telstra, 27% for Woolworths, 15% for CSL, 5% for Goodman, 29% for Wesfarmers, 13% for WiseTech, 2% for Transurban, 51% from Pro Medicus.
The iron ore majors, Wesfarmers, Woollies, and Pro Medicus are the only major companies beating their cost of capital by a decent margin to compensate for risk.
Longer term structural factors
Looking beyond the current cycle, we can see that US listed companies on the whole have generated returns on equity more than 4% higher on average than Australian listed companies. That is an enormous difference in long-term profitability between the two countries.
The difference is actually even greater than this because Australian inflation has averaged 1% higher than US inflation since 1960 (4.6% pa in Australia versus 3.7% pa in the US), so the difference in real ROEs favours the US by an additional 1%.
This chronic ROE under-performance of Australian companies is damning. Ordinarily, oligopoly pricing power should lead to higher profit margins, but market power also attracts political meddling and over-regulation. Lack of competition also breeds complacency, and lack of productivity-enhancing innovation.
One of the golden rules of corporate finance is this – if your company cannot consistently generate returns on equity in excess of the cost of its equity capital (which is say 10%), then you should just close the thing down, liquidate the assets, repay lenders and creditors, and hand whatever money is left back to its shareholders, so they can invest their money instead in more profitable and productive businesses.
Unfortunately, company chairpersons and directors have very powerful vested interests in keeping value-destroying companies alive: – directors’ fees, ‘free’ (shareholder-funded) lunches and trips to exotic locations for board meetings, hobnobbing with politicians, receiving personal awards and titles for donating shareholders’ money to charities (!), etc.
Current high US ROEs probably a warning sign
On the above chart we can see that ROEs in the US market soared to above-average levels at the tops of booms right before those booms collapsed. Likewise, Australia’s peak ROE in the 2000s China / mining boom also ended when the boom collapsed.
The current US tech boom is once again generating above-average ROEs for US companies at similar levels to the height of the late-1990s ‘dot-coom’ boom, right before that boom collapsed in the 2000-2 ‘tech wreck’.
It is difficult to see how the trillions of dollars being spent on ‘ai’ software and infrastructure hardware (eg data centres) can continue to generate these lofty returns on equity in the coming years. My guess is that the current manic ‘ai’ boom will turn out to be just another episode in a long line of manic over-investment booms that have ended in busts.
ROE for companies, not ROE for investors
Here we are talking about the returns on equity from the companies themselves, ie what profits they generate from their assets, and businesses, and staff. We are not talking here about the returns to a company’s minority shareholders (you and me) who buy shares in those companies.
These two types of ‘returns’ can be quite different because different shareholders at different times are prepared to pay different amounts per dollar of company profits.
Shareholder returns from the US and Australian share markets over the whole period have actually been quite similar (both have generated returns to shareholders averaging around 6.5% above inflation in each country).
The phenomenon of shareholders achieving higher returns on their investments than the underlying ROEs achieved by those very same companies on their own books, is due to the fact that shareholders on the whole have bid up company share prices well beyond the underlying profits generated by those companies.
Hence my conclusion that, although the Australian share market is trading at a lower Price/Earnings ratio and price to book value ratios than the US market (Part 2), the Australian market is probably more over-priced than the US market because US companies are inherently much more profitable than Australian companies, and have been for many decades.
What price growth?
The US market may appear on the surface to be more expensive than Australia and many other countries (higher price/earnings ratios, lower dividend yields, higher price-to-book value, etc), but this may be partially or wholly justified by its higher profitability (profit margins and returns on equity). I look at how much might be a reasonable price to pay for higher growth in later instalments.
Summary
-
-
- This instalment delves deeper into pricing and valuations for the 20 largest share markets in the world. It goes behind initial pricing metrics like p/e ratios, dividend yields, and price-to-book ratios, to look at underlying corporate profitability.
- The US market appears on the surface to be more expensive than other countries (higher p/e, lower dividend yields, higher price/book, etc), but US companies are the most profitable in the world, which justifies higher pricing.
- Despite appearing less expensive on p/e ratios and price/book ratios, the Australian market is probably more over-priced than the US market because US companies are inherently much more profitable than Australian companies, and have been for many decades.
- However, US company profitability is currently running at very high – and probably unsustainable - levels, similar to the 1990s ‘dot-com’ boom which collapsed in the ‘tech-wreck’ crash & US/global recession.
- Company profitability has been much lower in Australia than in the US for many decades (aside from one brief period). Why?
- Australian company returns on equity have been below the cost of equity capital (ie value-destroying) for decades. Why do investors keep bidding up share prices when underlying company ROEs are so low
‘Till next time . . . . safe investing!
See other articles in this 6-part series -
For more on Australian share market versus the US – see:
For more on US market pricing/valuation –
For my most recent monthly update on local & global markets for Aussie investors: