-
-
- Exchange rates are driven ultimately by differences in inflation in between countries.
- Why the Aussie dollar has been in long-term decline against the US dollar for more than a century.
- Why I am bullish that this long-term decline is probably behind us.
Every minute of every day (and night) the value of the Australian dollar and every other currency jumps around, seemingly at random. Short-term movements are generally driven by news that affects investor and speculator sentiment that also drives short-term movements in the prices of commodities, shares, bonds, and just about everything else that is traded in markets.
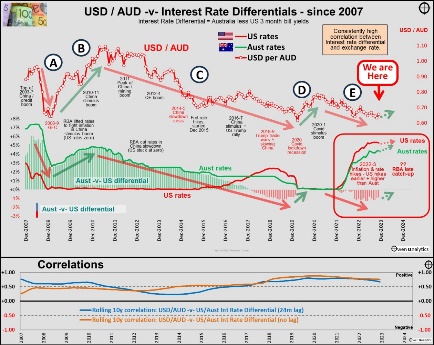
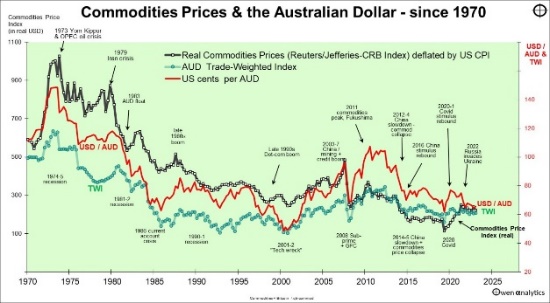
Beyond these very short-term gyrations, the AUD is driven by two distinct medium-term (2-3 year) cycles – commodities prices and interest rates. See -
However, longer-term changes in exchange rates between the currencies of different countries are driven ultimately by differences in inflation in each country.
Why? Currency and inflation are actually the same thing
There is no magic in this long-term relationship between exchange rates and inflation. They are merely two sides of the same coin – the buying power of a currency.
A currency’s buying power in terms of goods and services in its own country is expressed in domestic inflation. Its buying power in terms of how much goods and services it can buy in another country is expressed in the exchange rate between the two countries.
Higher inflation in one country means lower spending power of its currency to buy goods and services inside that country, and also lower buying power for goods and services in other countries due to its lower exchange rate between the two countries.
AUD -v- US dollar and British pound
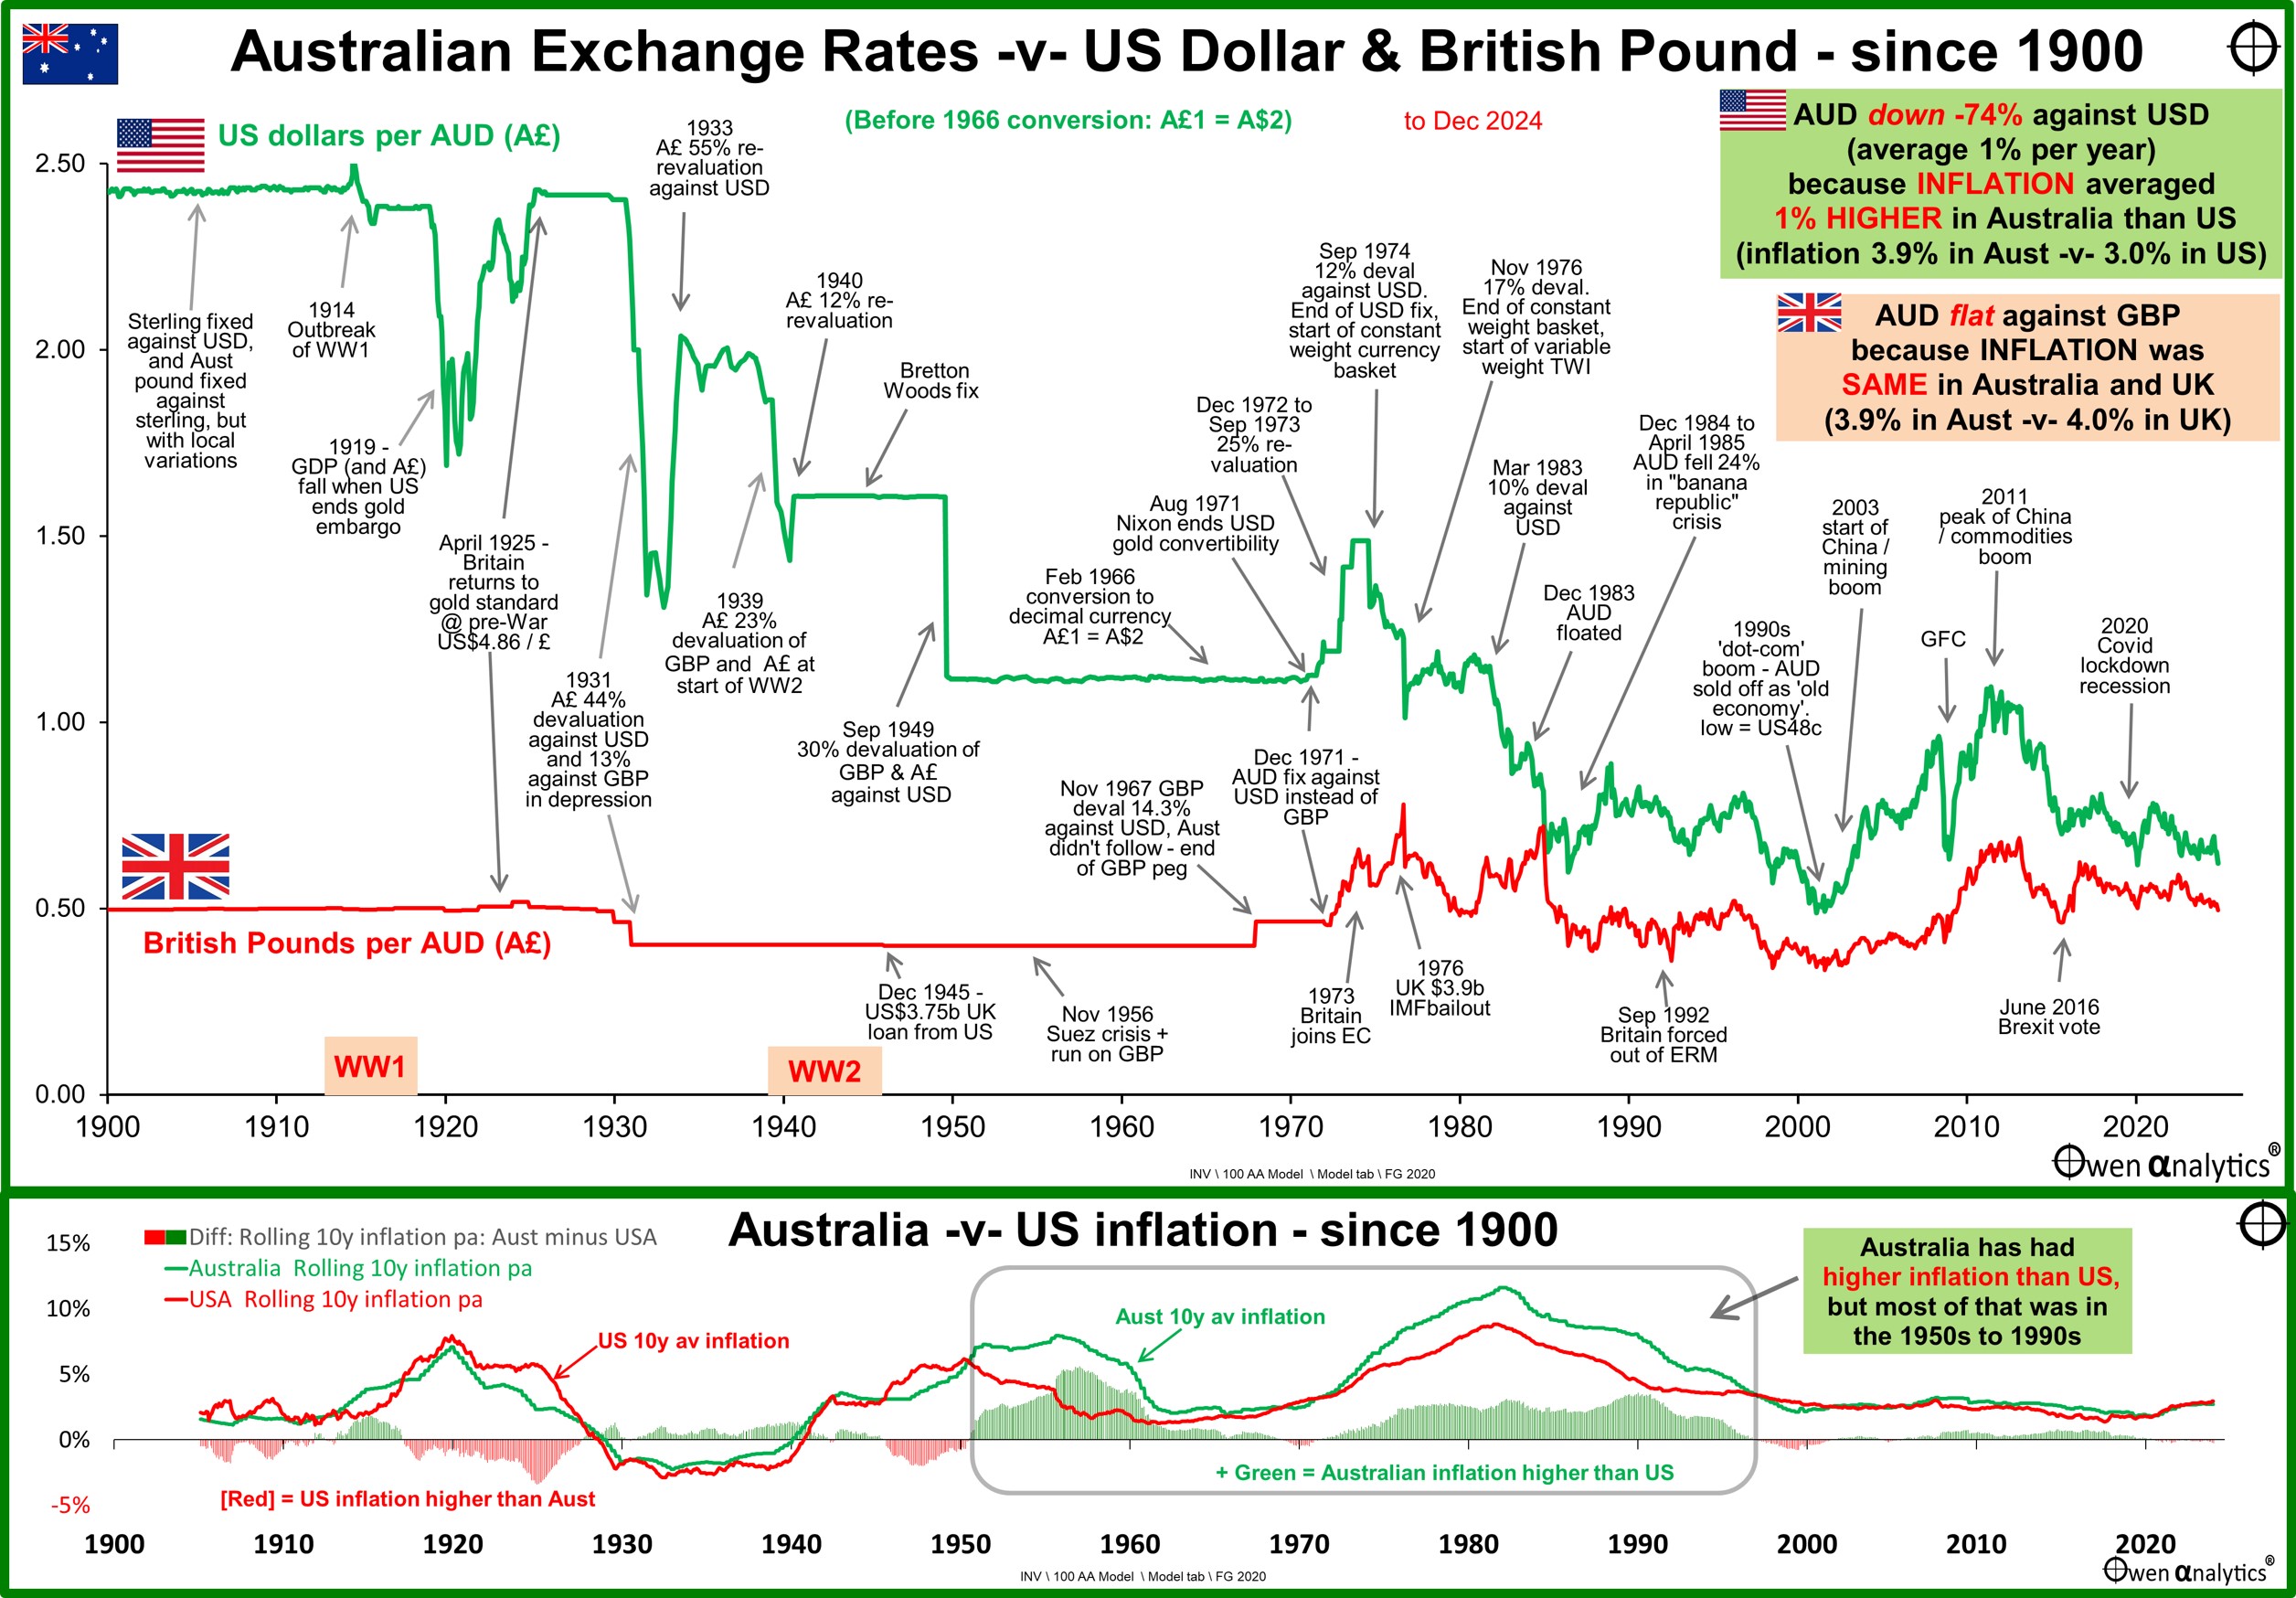
The upper section of the chart shows the Australian dollar against the US dollar (green line) since 1900, and against the British pound (red line).
The bottom line is that the AUD has declined by an overall average of -1% per year against the US dollar (green line) since 1900 because inflation has averaged 1% higher in Australia than the US.
On the other hand, the AUD has remained more or less flat against the British pound (red line) because Australia and Britain have had the same average inflation rate over the period.
This story compares the Aussie dollar to the British pound and the US dollar because they have been the most important exchange rates for Australia.
When the British first established the Australian colonies as remote prison camps, Britannia ruled the waves and the British pound was the main world currency for international trade and commerce. The early Australian colonies experimented with a variety of different currencies, including Spanish dollars. Then in 1825, the local ‘Australian’ pound was pegged 1:1 to the British pound, but the local version traded at varying discounts to the British pound (up to 50% discount at times), depending on local conditions.
After WW1 the US emerged as the dominant military, commercial, and financial power, and the US dollar became the main currency for world trade. After a string of British current account and currency crises, Australia switched its AUD ‘peg’ from the Pound to the US dollar in 1967, then to a mixed currency ‘basket’ in 1974, and finally to a free floating currency in 1983.
Eventually, inflation prevails
In order to promote currency stability to facilitate international trade and investment, countries and groups of countries have tried various attempts to ‘fix’ or ‘peg’ exchange rates to things like gold, to other currencies, and to ‘baskets’ of currencies, but these artificial attempts never last long before snapping.
Inevitably, currencies revert to being driven by relative inflation rates (which is what currencies are in essence). This relationship not only breaks artificial currency pegs, fixes, and blocs, it also endures through all sorts of major disruptions including world wars, debt defaults, bouts of hyperinflation, depressions, deflation, revolutions, political upheavals, different monetary regimes, trade & currency wars, and host of other man-made and natural disasters.
On the chart we can see several flat horizonal lines, which are periods of ‘pegs’ and ‘fixes’. These start out with grand intentions, but never last long before snapping.
Aussie dollar -v- US dollar
During the period on the chart, the Aussie dollar has declined by 74% or -1.1% pa against the USD, from US$2.42 per AUD in 1900 to US$0.62 per AUD at the end of 2024. (A£1 = A$2 prior to decimal conversion in 1966). Over the same period, Australian inflation (averaged 3.9% pa) has been 1% higher than US inflation (averaged 3.0% pa).
In a nutshell: AUD has lost an average of -1% per year against the USD since 1900 because inflation has been 1% pa higher in Australin than in the US over the period.
(NB. for simplicity I use differences in consumer price inflation. However, differences in GDP deflators, which cover the whole economy and not just consumer spending, produce similar outcomes.)
Aussie dollar -v- British Pound
On the other hand the Aussie dollar has remained more or less flat against the GBP over the same period. In 1900 the Australian pound was trading at a 0.5% discount to the British pound. The exchange rate has gone from £0.4974 pounds per Aussie dollar in 1900 to £0.4956 pounds per Aussie dollar at the end of 2024 – virtually unchanged, although there were ups and downs along the way.
The reason that the Australian and British currencies have remained more or less equal over such a long period is that inflation in the two countries has been more or less the same. Inflation averaged 3.9% pa in Australia and 4.0% pa in UK.
In a nutshell: The Aussie dollar and British pound have remained more or less the same because inflation has been more or less the same in both countries.
British Pound -v- US dollars
To complete the loop, because inflation in Australia and UK have both been around 1% higher than US inflation over the period, the pound has also fallen by around the same amount against the USD. The pound is down -74% against the USD, from US$4.86 per pound in 1900 to US $1.25 per pound at the end of 2024. This is an average decline of -1.1% per year, the same decline as the Aussie dollar versus the US dollar.
In a nutshell: British Pound has also lost an average of -1% per year against the USD because inflation has been 1% pa higher in UK than in the US.
USD -v- Swiss franc
It works for other exchange rates as well. For example, although the US dollar as increased against the weaker Aussie dollar and British pound, it has declined against the much stronger Swiss franc over the same period, because inflation has been lower in Switzerland than in the US.
The US dollar has declined by a total of -83% against the Swiss franc since 1900, from 5.2 CHF per dollar in 1900 to 0.906 CHF/dollar at the end of 2024 (or USD$1.10 per CHF as it is usually quoted). This was an average decline of -1.4% per year, because inflation has been lower in Switzerland (average 2.0% pa) than in the USA (average 3.0% pa) over the period.
This relationship even works for currencies that have undergone bouts of hyper-inflation like the German Mark (now euro) and the Japanese Yen. No magic, because exchange rates and inflation are two sides of the same coin.
The future of the Aussie dollar?
Although the main chart shows the weaker AUD declining against the US dollar due to Australia’s higher average inflation rate over the period, we cannot simply extrapolate this decline into the future.
The lower chart shows rolling 10-year average inflation rates in Australia (green line) versus USA (red line), and the difference between the two countries is the bars along the bottom of the lower chart - green bars when Australian inflation is higher, and red bars when US inflation is higher.
Here we can see that Australia’s higher overall inflation rate was mainly during the 1950s to 1990s. Since the mid-1990s, the average inflation rates in Australia and the US have been more or less the same – through a variety of market conditions including the GFC, Covid lockdown recessions, zero interest rates, QE money printing, inflation spikes, ‘flash crashes’, share market booms & busts, commodities cycles, trade wars, regional wars, the rise of China, and rising deficits and debts in both countries.
The future of the AUD In the next 20, 30, or 100 years will be driven, just like in the past, by how well we manage inflation.
Thank you for your time – please send me feedback and/or ideas for future editions!
For short-medium term drivers of the AUD see -
See also:
For my current views on asset classes and asset allocations (including currency hedging) - see:

Or visit my web-site for 100+ recent fact-based articles on a wide range of relevant topics for inquisitive long-term investors.
‘Till next time, happy investing!