This is the second in a series of articles looking at the four main drivers of the Aussie dollar:
1 - Fundamental ‘fair value’ (long-term effect)
2 - Interest rate differentials (short/medium-term effect)
3 - Commodities prices (short/medium-term effect)
4 – Share market (short/medium-term effect)
In this story today we look at another of the short/medium-term drivers – Commodities prices.
The first article looked at ‘Interest rate differentials’ - What drives the Aussie dollar? – Part 1: Interest Rate Differentials. There we showed how, since the float of the AUD in 1983, there has been a strong positive correlation between the USD/AUD exchange rate and the difference between short-term interest rates in Australia and the US (the interest rate 'differential').
That earlier article also outlined the many reasons that understanding what drives the AUD is critical for Australian long-term investors – not just for planning overseas holidays!
(NB there are dozens of other factors that I have researched, studied, and tested at length, but these four factors have demonstrated consistently strong statistical and fundamental relationships that have persisted for several decades covering many different types of conditions, and I have used them in asset allocations processes in portfolios for the past two decades).
Why commodities prices?
The AUD has tended to follow commodities prices through the ups and downs of global business cycles, as Australia’s exports, and national income, have always relied on raw commodities, and prices are very sensitive to business cycles.
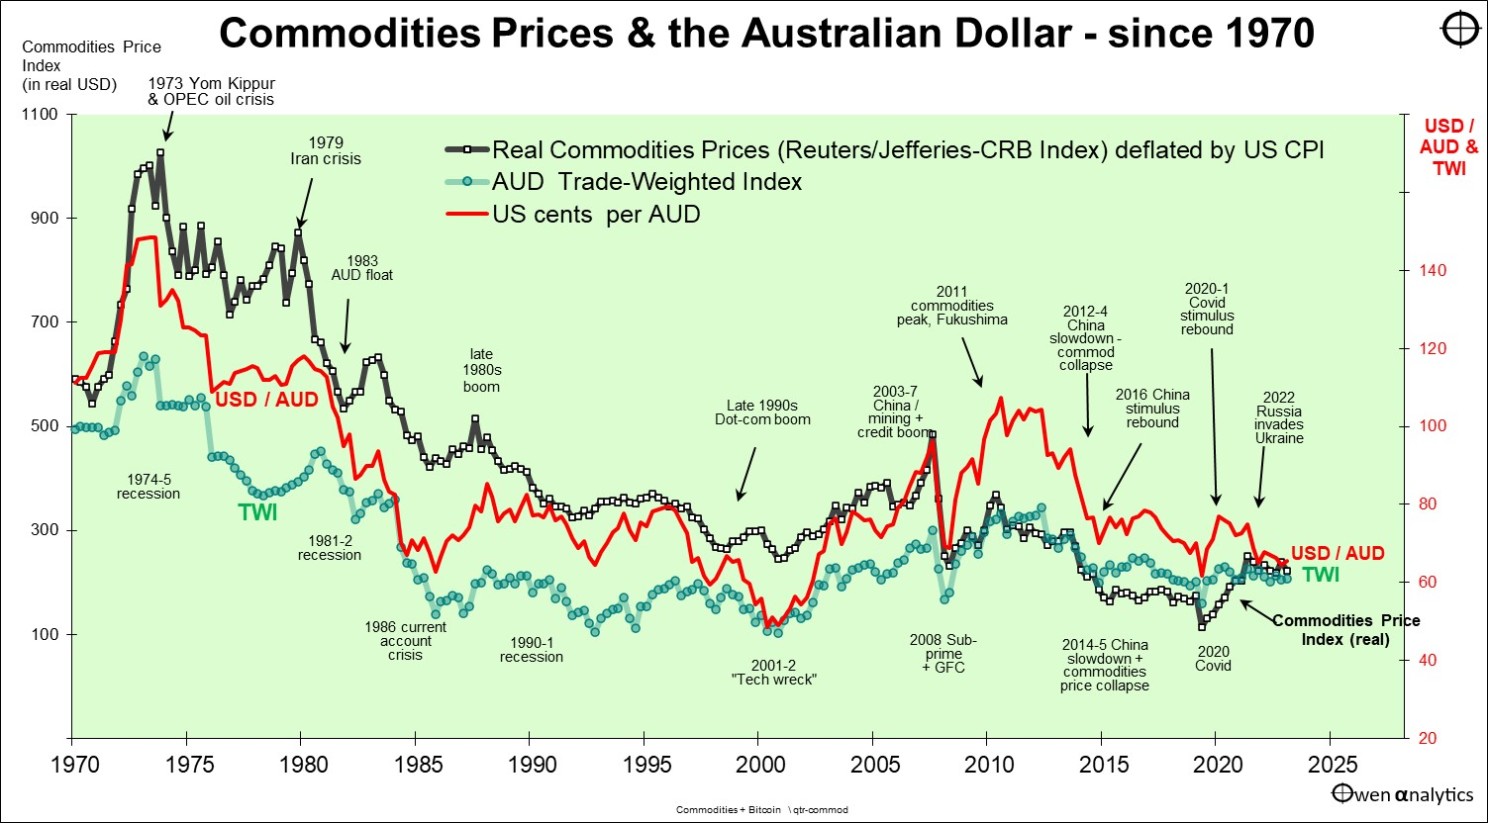
The first chart below shows the AUD against both the USD (red line) and the AUD Trade-Weighted index of currencies of our trading partners (green).
Real commodities prices (black) are measured by the broad Thompson Reuters/Jefferies Commodities Research Bureau Index, which is based on a broad global basket of commodities.
Why US dollars?
Here we express the commodities price index in real US dollars, deflated by US inflation. We use US dollars because most commodities are priced and traded in USD.
We also use US dollars as most of our decisions on exchange rates are primarily in US dollars – eg hedging decisions on global shares, because more than 75% of global share markets are either priced in US dollars or tied to the US dollar.

Australian dollar - commodities prices since 1970
Short-term business cycles and longer secular cycles
The above chart shows that the AUD, whether measured against the USD (red line) or the Trade-Weighted Index (TWI, green line), broadly follows the path of the global commodities prices (black) – through all of the booms and busts over the past six decades.
Not only does the AUD travel up and down with commodities prices through each short-term boom/bust cycle, it also follows commodities prices through the longer-term secular commodities phases –
- Collapsing from the 1970s highs, declining through the 1980s and the tech-boom of the 1990s, when commodities were seen as very old-school, and commodities-based Australia was seen as an un-loved, old-world economy and dollar.
- Commodities prices and the AUD then rose strongly during the China-commodities boom from the early 2000s, down sharply in the GFC, but quickly boosted by China’s post-GFC stimulus, peaking in 2011.
- Commodities prices and the AUD declined again from 2012 through to the 2020 Covid lockdown recessions – starting with the ‘China hard-landing’ scare that marked the start of China’s current secular decline.
- Commodities prices and the AUD are rising again with the 2021 Covid lockdown restrictions, 2022 Russian invasion of Ukraine, the geo-political shift to protection / self-reliance, and the global transition to renewables.
Why a broad global commodities basket, not the RBA basket?
The RBA publishes its own commodities basket (RBA table I-12), which reflects Australia’s actual exports and imports. While there is also a strong positive relationship between the RBA commodities basket and the AUD, we find that the broad global Jeffreys-CRB commodities index is a better measure for the AUD, because the AUD is generally regarded as a proxy for confidence in global growth.
As such, the level of the AUD is a barometer, or proxy, for global growth prospects, more than anything else.
For example, if global investment markets suddenly turn bearish, for whatever reason, share markets will fall, industrial commodities prices will fall, and the AUD will fall. This will all take place almost instantly, within minutes or seconds, well before any logical or reasoned analysis is carried out on the estimated likely impacts on Australian export revenues, or aggregate spending, or GDP growth, etc.
It is a good reminder that financial markets are driven by wild animal spirits (fear & greed), not calm, rational logic.
Forecasting the AUD from Commodities prices
Because of the strong positive relationship between global commodities prices and the AUD we can estimate a current ‘fair price’ for the AUD at any point in time given the level of commodities prices.
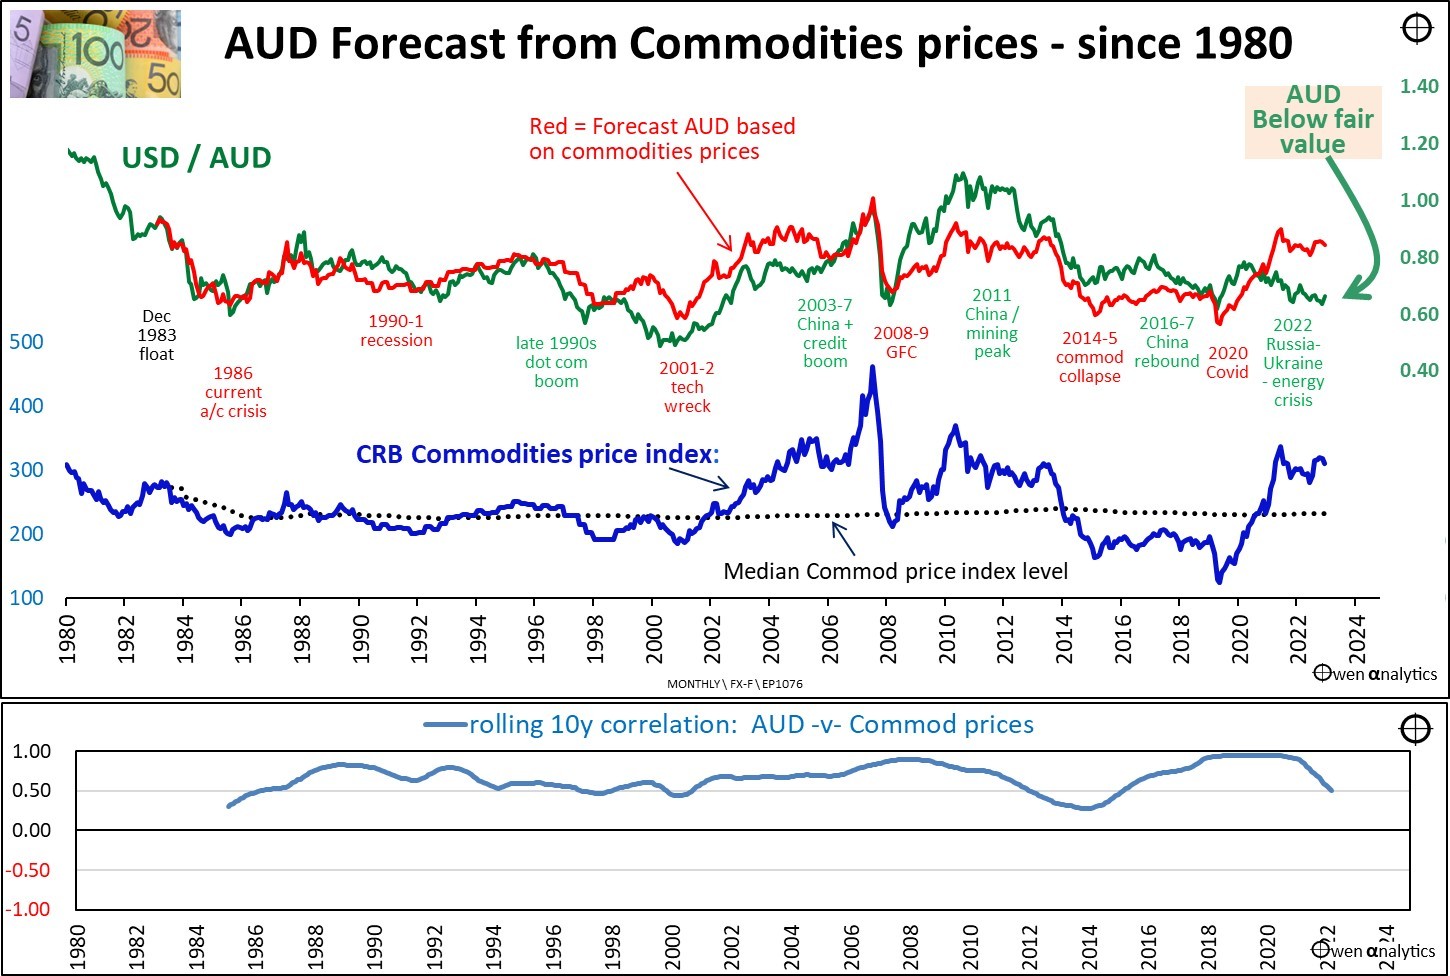
The upper section of the next chart shows:
- the actual USD/AUD exchange rate since 1980 (green line),
- compared to the estimated commodities-based fair USD/AUD exchange rate (red line),
- given the level of commodities prices (blue line in middle section).

Australian dollar exchange rate - commodities prices
The lower section shows the consistently strong positive correlation between the broad CRB-Jeffreys global commodities price index (in USD) and the USD/AUD exchange rate. The median correlation over whole period has been a very high 0.80, indicating a consistently strong positive relationship over several decades, through a host of different types of economic conditions.
It is not a perfect measure of course, as there are always other factors in play.
The actual exchange rate (green line) remains fairly close to the predicted commodities-based exchange rate (red line) most of the time, but there are relatively long periods when the actual exchange rate (green) is above its commodities-based level (red) – eg. 2009 to 2015. There are also periods when the actual exchange rate is below its commodities-based level – eg. 2000 to 2005.
Although these departures from its commodities-based fair value last several years at times, within these periods, the AUD still travels up and down in parallel with commodities prices.
Where are we now?
At the right end of the upper section in the above chart, we see that the current USD/AUD exchange rate (around USD 0.66 in late December 2023) is significantly lower than the estimated commodities-based fair level (around USD 0.83).
The main reason for this particular departure from the commodities-based ‘fair value’ is that the AUD is being kept low at the moment by the historically wide ‘Aust-US interest rate differential’, where US short-term interest rates are more than 1% higher than short-term rates in Australia – outlined in - What drives the Aussie dollar? – Part 1: Interest Rate Differentials.
Medium term trend for stronger Aussie dollar
This current downward pressure on the AUD (Australian rates lower than US rates) is unusual and temporary. When the current downward pressure on the dollar is relieved (mostly likely the US Fed cutting rates before and/or more quickly than the RBA), the upward pressure on the AUD from commodities prices, will probably send the AUD higher over the medium term.
In the event of a significant US/global recession, the AUD and commodities prices will fall (as always), but that will just be a short term effect.
Beyond a short-term recession effect, we are now in a longer-term secular trend for rising commodities prices supporting the AUD, probably for several years, driven by longer-term secular trends – rising protection/on-shoring, the transition to renewables, geo-political supply restrictions, the shift away from open global trade toward preferential allied trading blocks, and the global military buildup.
Stay tuned for upcoming articles on the other two of the four major drivers of the AUD:
- 1 - Fundamental ‘fair value’ (long-term effect)
- 4 – Share market (short/medium-term effect)
‘Till next time – happy investing!