Gold has been the best performing asset class this year (up +25% to 20 September) – which is good because my long-term portfolio has a significant tactical allocation to gold this year (my ‘10-4 all-weather ETF portfolio’). But today’s story is not about why the gold price is rising, or why it is in my portfolio.
Today’s story is about another way I use gold – as a pointer to the likely direction of US inflation 1 to 2 years ahead.
Ever since Nixon took the US off the gold standard in 1971, it appears that changes in the gold price have been a reasonably good predictor of US inflation in the next year or so.
Specifically, the 12-month percentage change in the USD gold price has been a reasonably good predictor of the direction of US inflation over the subsequent one to two years.
Today’s chart shows the US annual CPI inflation rate (black line) since 1971, and the 12-month percentage change in the USD Gold price (yellow line) advanced (ie pushed forward) by 18 months.
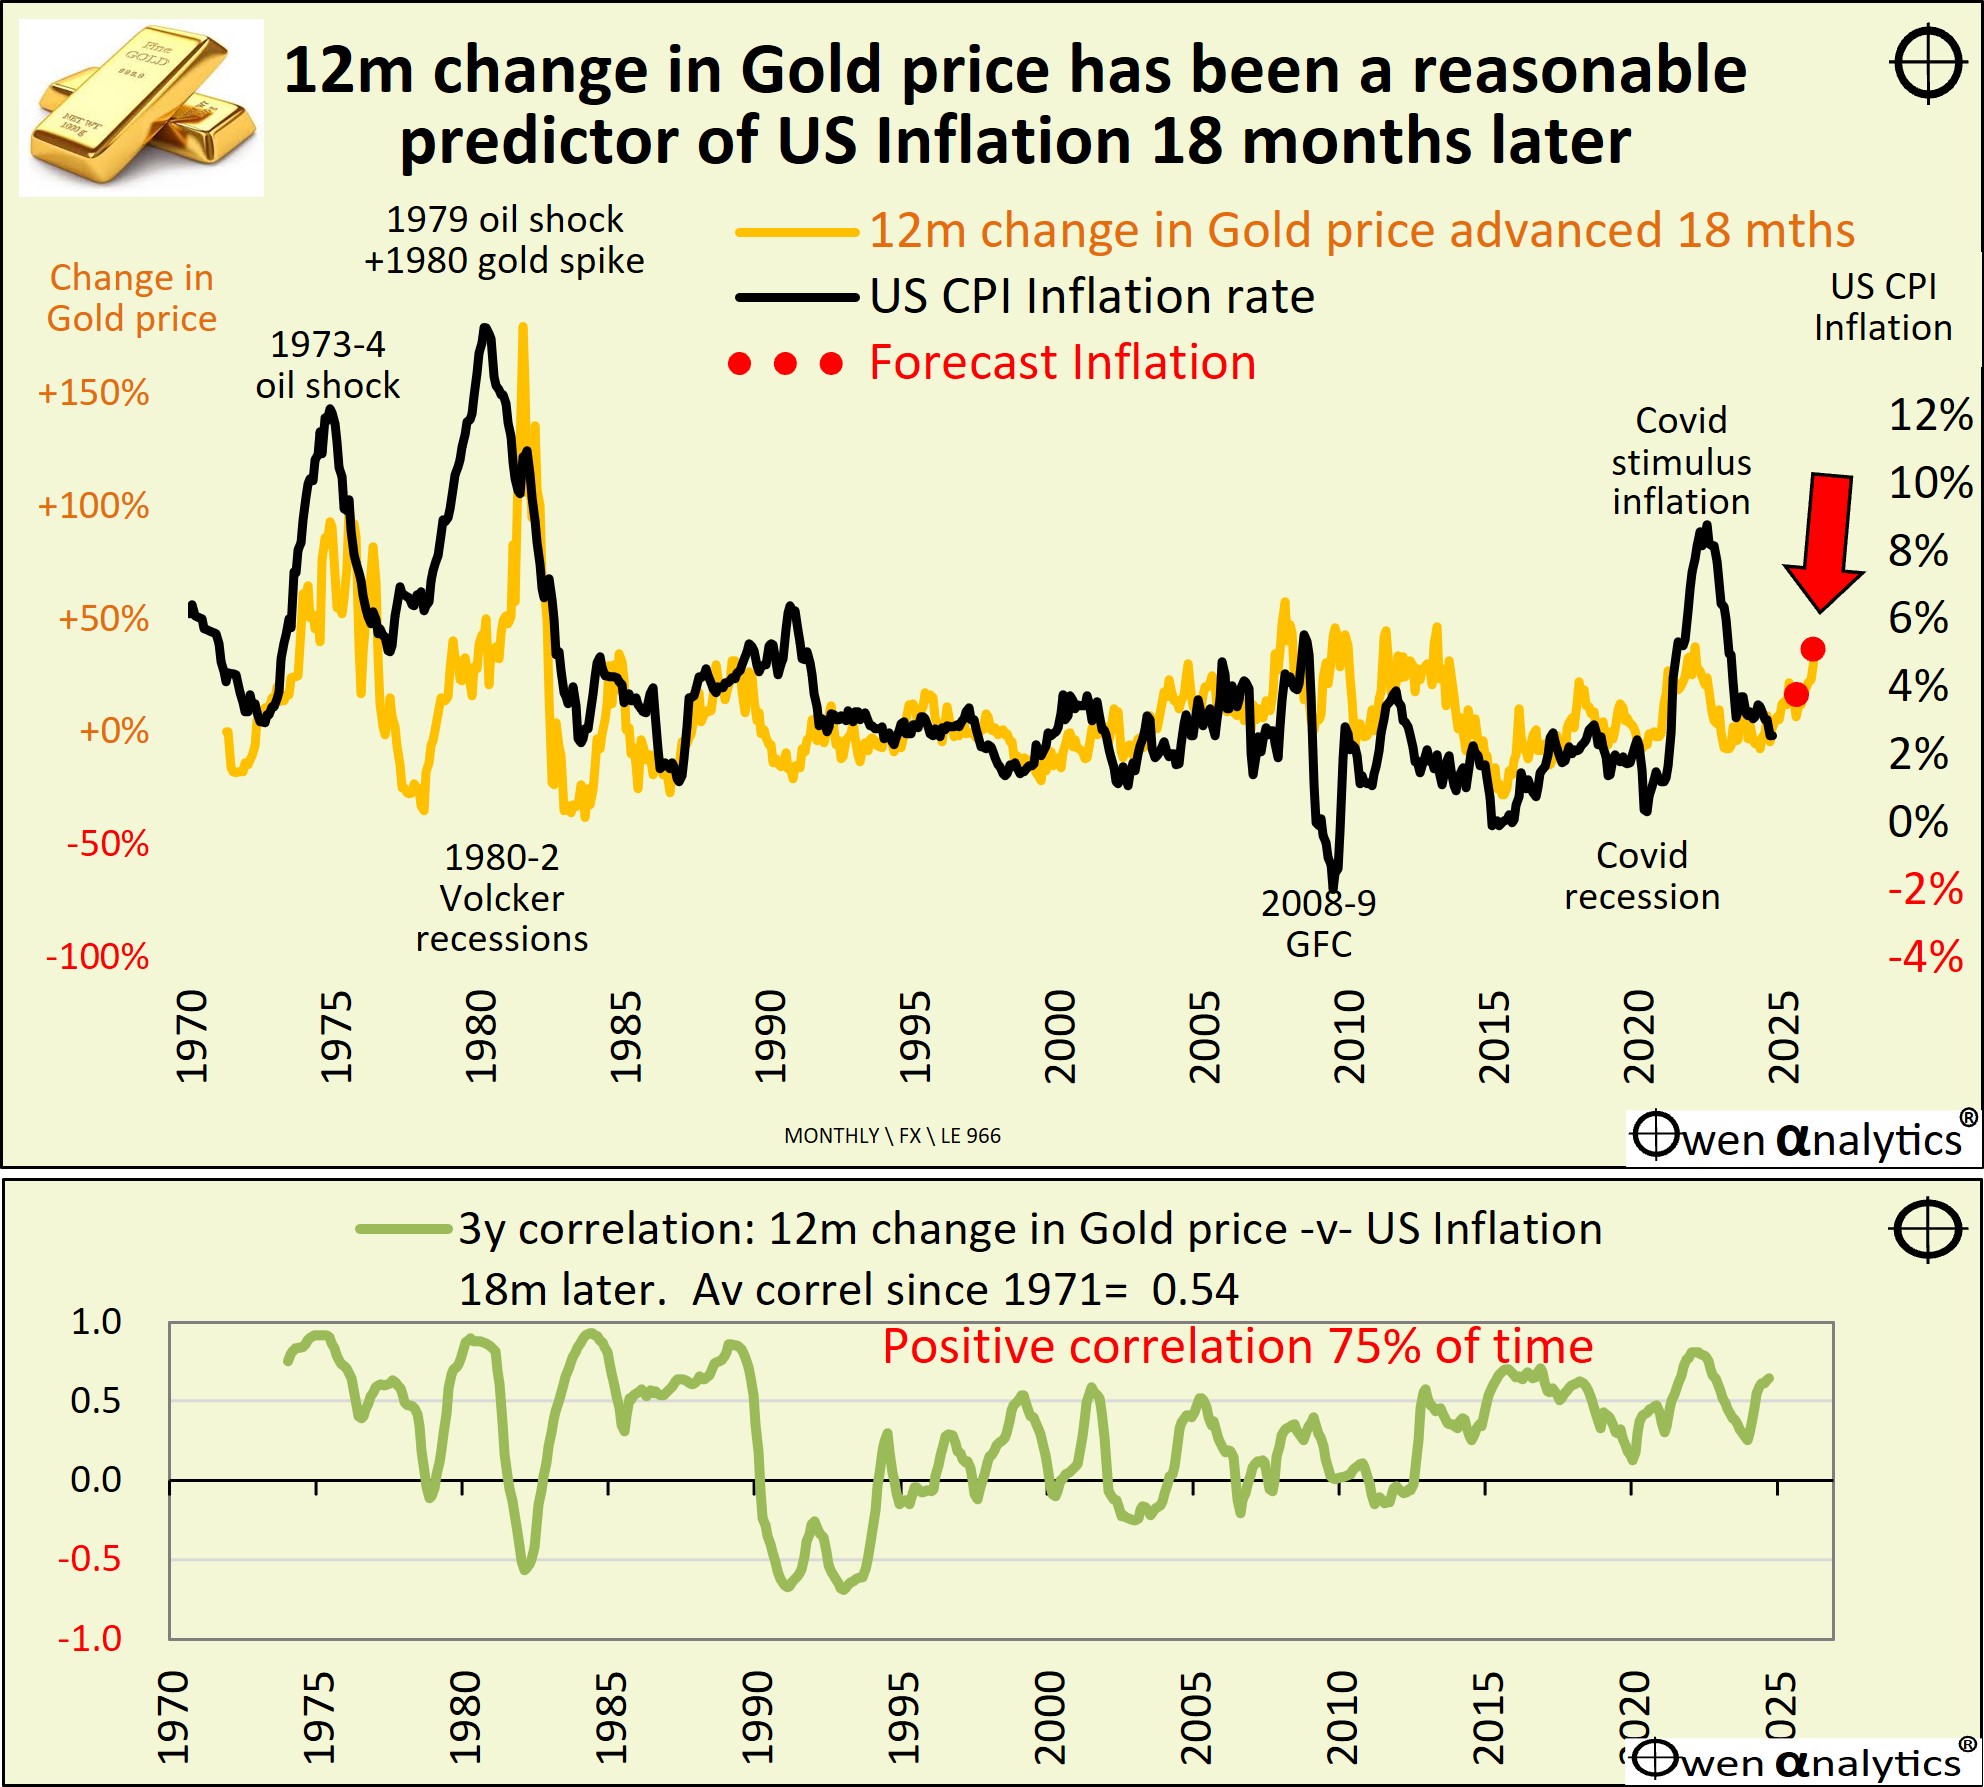
The black and yellow lines follow more or less the same path through the cycles – ie US inflation (black) and the 12-month change in gold price 18 months earlier (yellow).
The extent of the rises and falls have differed in each cycle, and the timing has not been perfect at all times, but the direction of rises and falls in the black and yellow lines has been relatively consistent through many cycles.
The lower section shows the 3-year rolling correlation between the two lines. The correlation has been positive 75 per cent of the time since 1971. The main exceptions where when the timing was different in the 1980 gold price spike, and in the early 1990s recession. After those brief errors in timing, the relationship resumed shortly thereafter.
What it means
This reasonably persistent positive relationship means that if the gold price rises significantly, there is a good chance US inflation will be higher around 18 months later. Conversely, a declining gold price points to lower US inflation some 18 months later.
This relationship has been working since US President Nixon took the US off the gold standard in August 1971.
To the right of the chart we see the 12-month change in the gold price (yellow) extends into the future, representing the gold price change advanced (pushed forward) by 18 months. This model is suggesting that the recent strong rise in the gold price is pointing to higher US inflation ahead.
It is not a perfect measure of course, but it has been a fairly close relationship over most of the past five decades.
Let’s take a closer look at the most recent fifteen years to see how this relationship has worked:
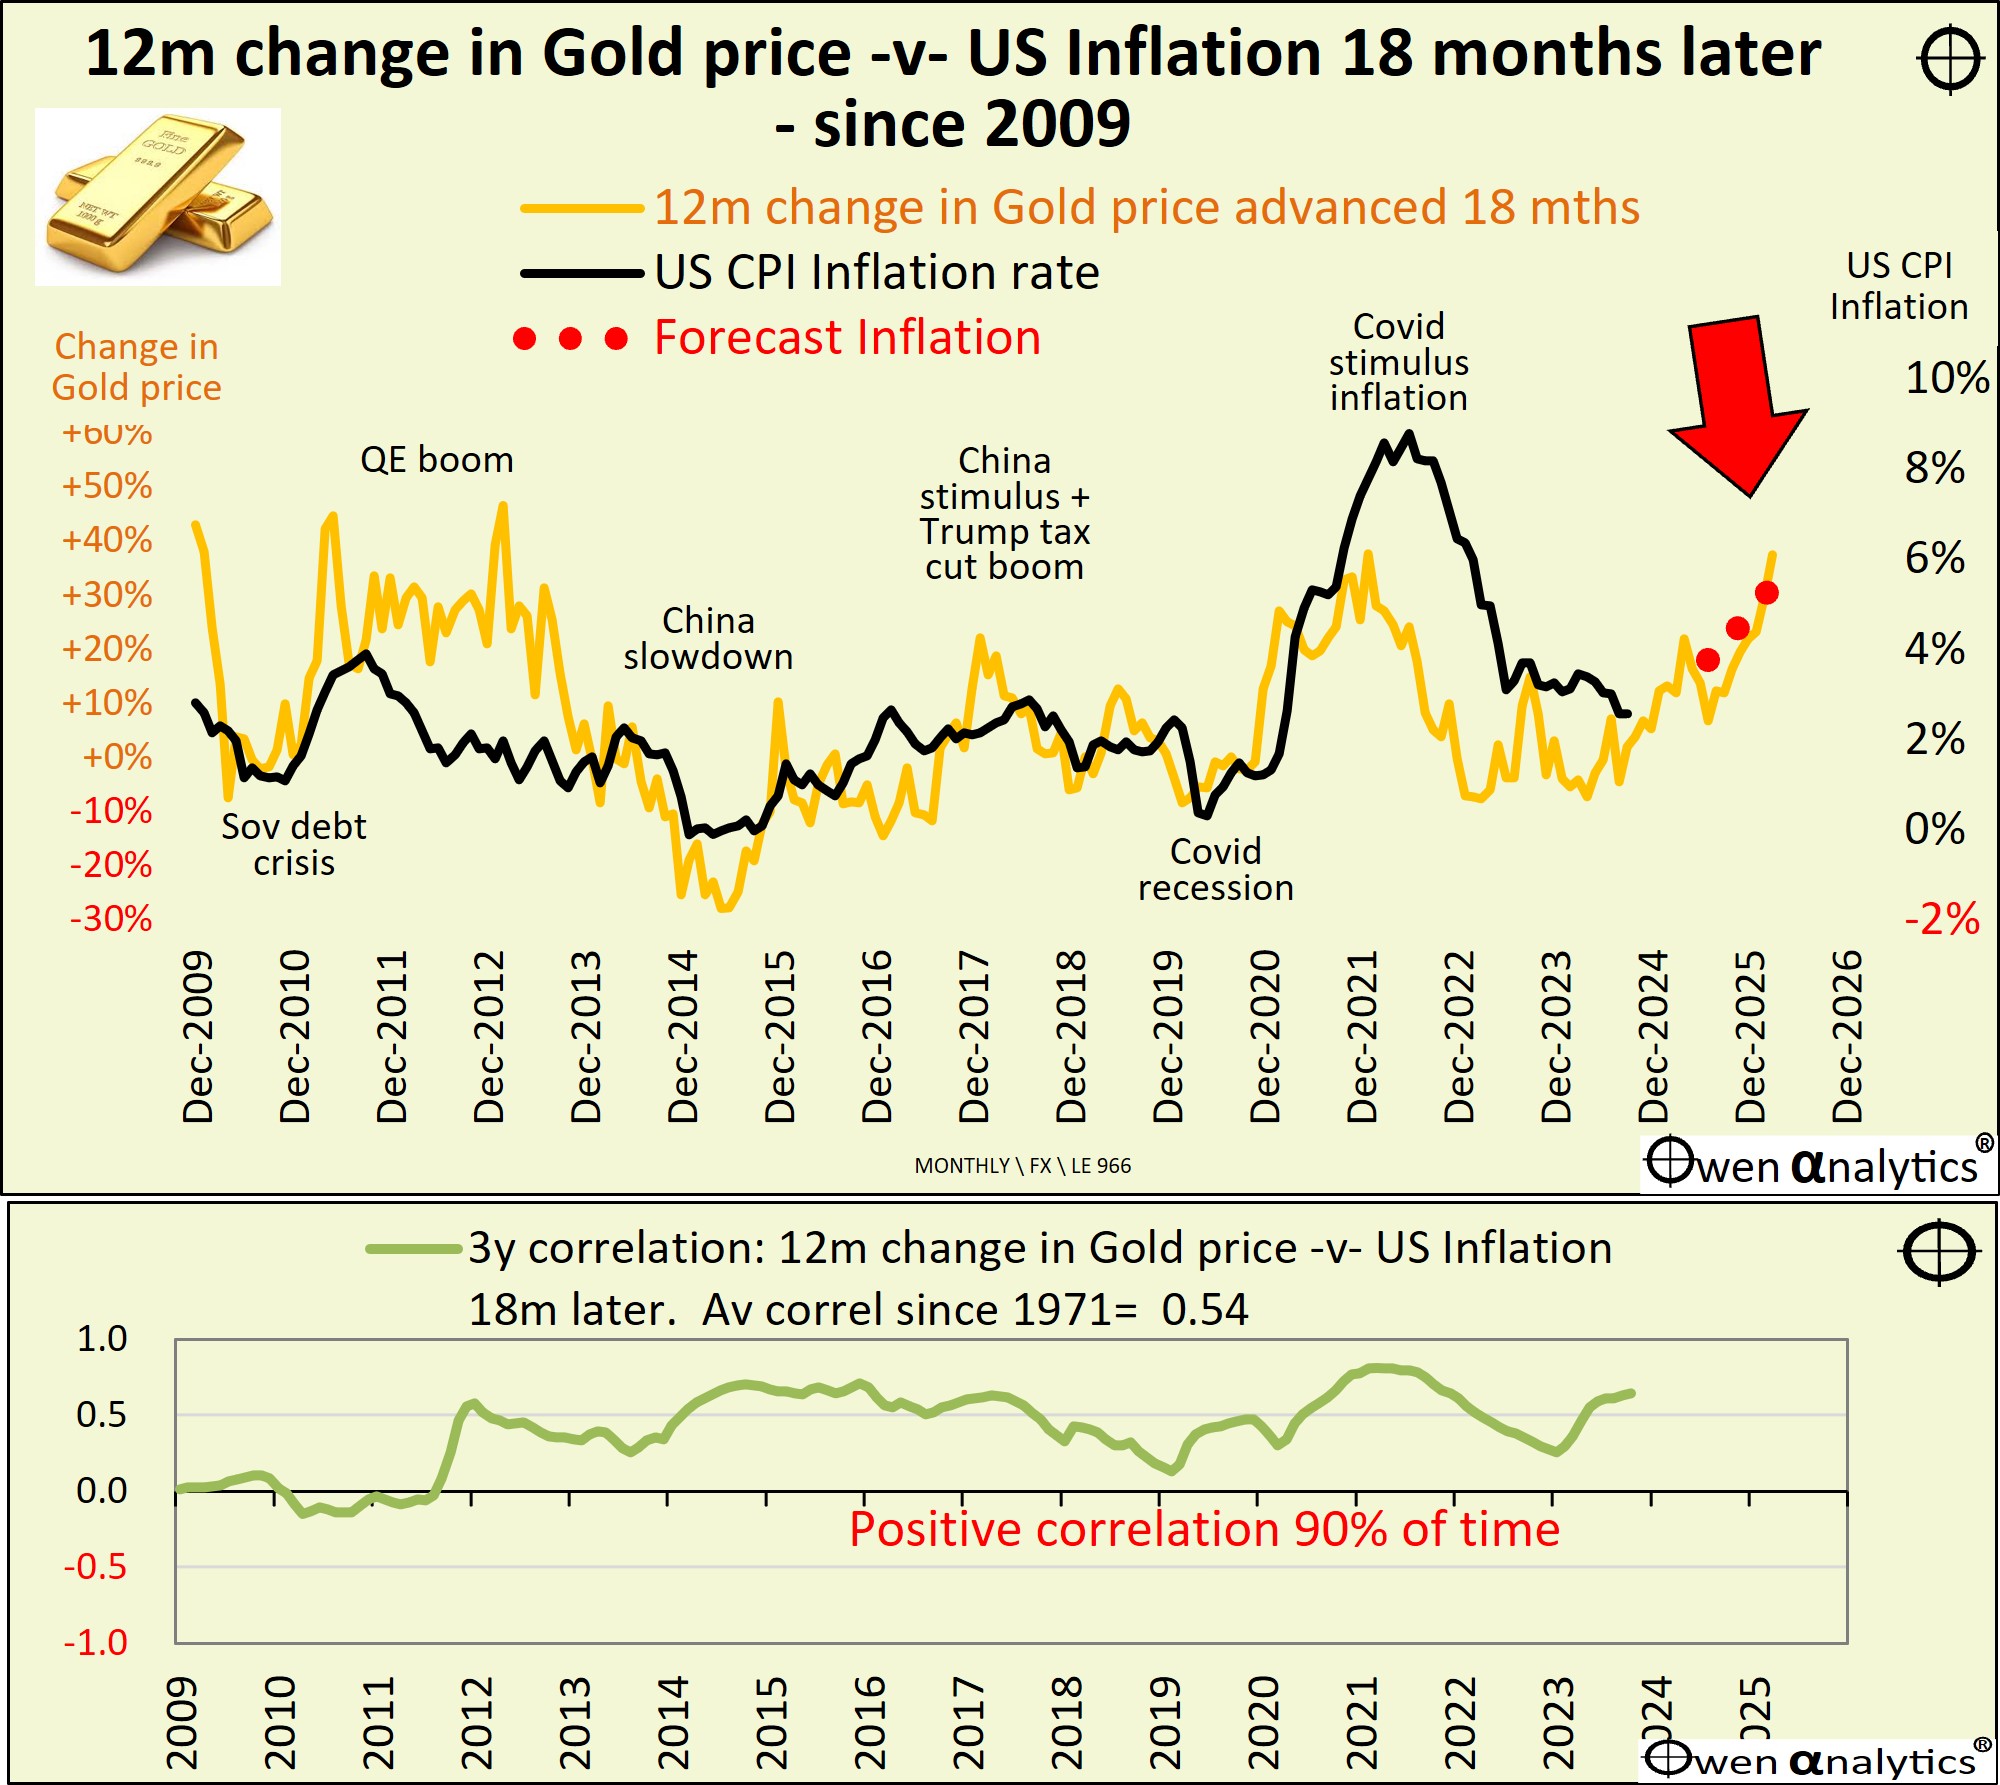
Although the rises and falls of both lines on the chart differ in extent, the direction of the lines have been relatively consistent through several cycles.
For example, in the first couple of years in the above chart, both lines rose in the 2010-11 sovereign debt crisis, then fell during the 2012-4 QE boom and into the 2014-5 China slowdown. The extent of the rise and fall were different, but the directions were consistent - inflation rose then fell but not as much as the model predicted by the yellow line, but the direction of the rises and falls were similar.
Also - in 2021-2, inflation (black line) rose much higher in Covid stimulus boom than was predicted by the rise in inflation 18 months prior (yellow line). However, inflation then fell back in 2023-4, as predicted by fall in the lagged gold price.
Through these cycles, the extent of the rises and falls in the yellow line and black lines differed, but the direction of both lines was consistent.
Predicted the Covid inflation?
Curious readers may ask at this point – am I saying that this model predicted the Covid stimulus inflation BEFORE Covid even hit? Surely that would be impossible because Covid was an external shock out of the blue that nobody could predict!
That is exactly what the chart says. It did not predict Covid of course, but it pointed to rising inflation, regardless of the cause.
The gold price was rising strongly in 2019 (Fed rate cuts and US recovering from the 2018 ‘recession scare’ triggered by Fed rate hikes in 2017-8). This was all before the Covid lockdowns and stimulus measures, and that is precisely what is behind the strong rise in the yellow line that coincides with the Covid inflation 18 months later! The extent differed but the direction was consistent.
Long-standing model
I have not retrofitted this model to suit the facts after the event. I developed it about 15 years ago, and it was one of the inputs to the tactical decision to buy silver before the 2011 price spike (I was going to buy gold, but the favourable gold/silver ratio at the time meant that silver did even better than gold), and also when adding AUD gold to client portfolios in 2018 (gold price remained flat in USD, but rose nicely in AUD as the AUD fell in the 2018 sell-off that was triggered by US recession fears with the Fed rate hikes).
Where are we now? Pointing to higher US inflation next year
At the moment (September 2024), the USD gold price has risen by +40% over the past 12 months, pointing to a likely rise in US inflation over the coming 18 months. This is represented by the red dots at the far right of the chart.
Other motivations for buyers and sellers
As with any commodity, the price of gold rises and falls because of the balance of buyers and sellers. There are many reasons for buying or selling gold, not just in anticipation of higher or lower inflation. For example, over the past year, central banks of several non-US aligned authoritarian regimes have been buying gold in the wake of the US sanctions and freezing of Russia’s US dollars following its invasion of Ukraine.
In addition, Chinese citizens have also been big buyers of gold in the past couple of years in the wake of the collapse of the Chinese property market and several Chinese ‘wealth management products’ that lost money lending to failed Chinese property developers.
Of course there have always been many different motivations for buyers and sellers of gold over the decades, but the relationship between changes in the gold price in US dollars and subsequent US inflation has always managed to remain reasonably consistent.
Why is this important for investors?
It is important because it is another piece of evidence pointing to the prospect that the US Federal Reserve may not be done yet with fighting inflation.
This would be reasonably bearish for US/global share markets. It may even turn out to be like the early 1980s (albeit with inflation not as high this time around), when a second round of aggressive interest rate hikes by Paul Volcker at the Fed resulted in the deep ‘double-dip’ recessions in the early 1980s that finally killed off the 1970s inflation.
Recession?
The prospect of a revival of US inflation and further rate hikes ahead does not rule out a US recession, as this is essentially the ‘stagflation’ scenario of the 1970s – ie stagnant economic growth/recessions at the same time as high inflation.
This gold price-inflation relationship is only one measure of course, but it has been a reasonably reliable predictor of US inflation for the past five decades since the US abandoned the gold standard. And it is one of the reasons I am reasonably bearish on the outlook for US inflation and interest rates in the coming year or so.
Just to reiterate – this story is NOT about the gold price, or why it is in the portfolio, so readers should NOT infer or imply a recommendation on gold. This story is about forming a view on US inflation in the coming year or so, which would flow through to US monetary policy and knock-on impacts on US/global share and bond markets.
I am still bullish on US/global shares for the time being, and still have gold in the portfolio. This model is just one of the inputs into forming views as to likely developments for US inflation and interest rates.
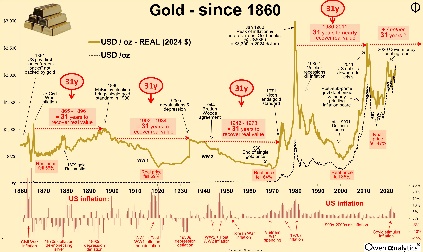
For my longer term story on gold over the past 150 years, and my short-ish term gold price target - see:
On US rate cuts and what to watch for – see:
For my current views on asset classes and asset allocations - see:
‘Till next time – happy investing!