Gold is hitting new all-time highs – above US$2,100 and nearing $2,200, after exceeding $2,000 briefly in 2023 - so investors and the chattering media are asking how, or whether, to jump in on the action.
As an aside, it is interesting that a price surge (in anything) will inevitably trigger a flood of enquiries about how to get in on the boom (‘FOMO’), never a price drop.
When prices are falling, the questions become: ‘Is it time to sell?, ‘Should I get out?’
This makes no sense at all, of course. It is the exact opposite of ‘investing’. However, all I am doing here is responding to the weight of media and investor sentiment and questions.
Perennial gold bugs
I know many people who are perennial ‘gold bugs’ – who swear that gold is always a good ‘safe haven’ investment for all seasons, and/or ‘inflation hedge’, regardless of the current price or current conditions. Whatever the question is, their answer is always: ‘Buy gold!’
I know of some advisory firms that have a fixed allocation to gold across all client portfolios, regardless of individual client needs or objectives, and regardless of the price.
The problem is that gold is a lousy inflation hedge, and also a lousy investment, over most time periods, and suffers huge bubbles and busts about every 30 years. People tend to get excited and buy in the speculative bubbles, only to see the price fall (in real terms after inflation) for the next 3 decades until the next bubble comes along.
Today’s chart shows gold price in real (inflation-adjusted) US dollars per troy ounce since Abe Lincoln took America off the gold/silver standard to print money (‘green backs’) to finance the US Civil War. It is my ‘medium term’ price chart, covering the past 165 years.
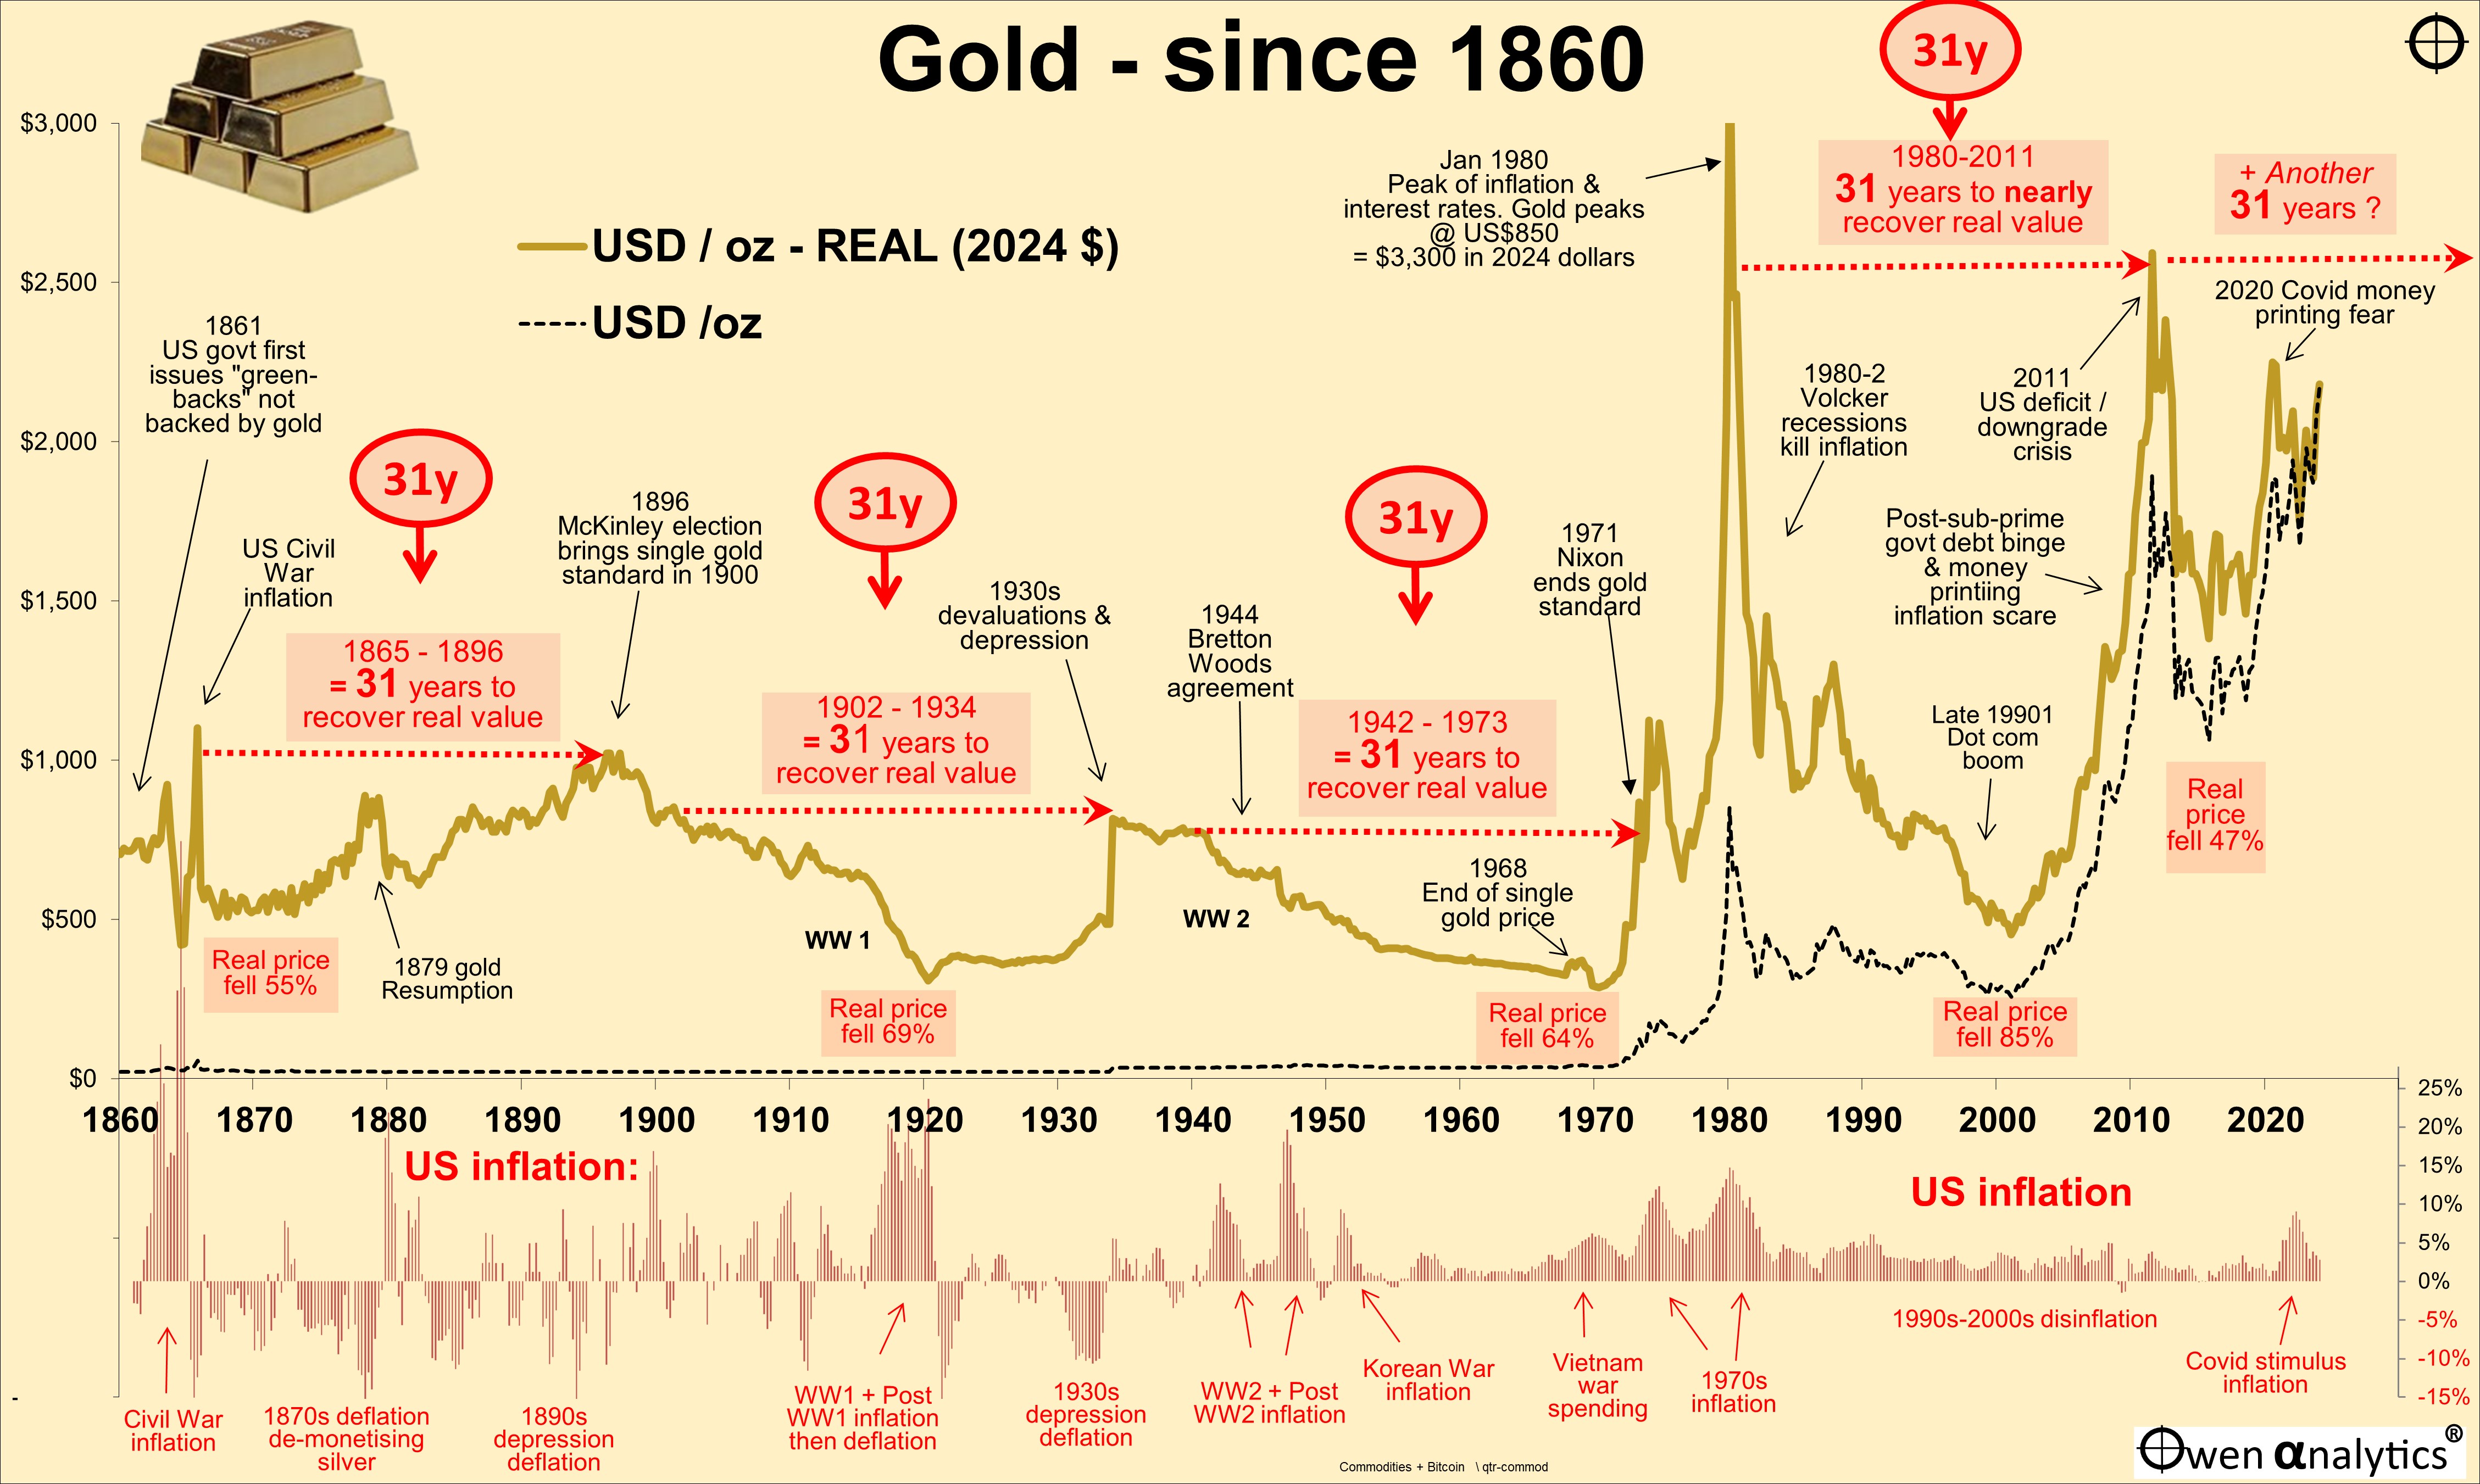
The ‘nominal’ price of gold in US dollars is shown as the black dotted line (we deal with nominal versus real prices below), and the lower section of the chart shows US annual inflation rates over the period.
The initial stand-out feature of this chart is the huge spikes in the real price or value of gold, each of which takes 31 years to recover. We will get to the 31-year cycle a little later.
NB - When I say a ‘price spike’ for gold, that is really a plunge in the value of paper US dollars against gold, because paper US dollars have no real intrinsic or commodity value, but gold does.
Lousy inflation hedge over long periods
If gold was a long term inflation hedge, then we would expect its ‘real’ (inflation-adjusted) value or price to be more or less constant (to neutralise the damaging effects of inflation on purchasing power of paper dollars), or at least be relatively stable. It has been neither.
Instead, the real value of gold has gone through enormous swings from frenzied booms, where the gold price in paper dollars soars steeply upward, then collapses into deep slumps in value for long periods.
From the tops of the booms, the real price of gold:
- fell by –55% from the 1865 peak,
- fell by -69% from the 1902 peak
- fell by -64% from the 1942 peak,
- fell by -85% from the 1980 peak,
- and fell by -47% from the 2011 peak.
For gold, these price spikes are higher and more exagerated than the share market, and the troughs are deeper and longer-lasting than the share market.
Because of these huge swings in value, timing is everything, even more so than the share market, because the price slumps for gold are deeper and longer than the share market.
Inflation hedge over shorter periods?
The gold price has mostly been more of a barometer of current/recent inflation, than a hedge against future inflation, which is would we would want from a true inflation hedge.
For example, the January 1980 gold price peak of US$850 per oz ($3,030 in today’s dollars) was at the top of the US inflation cycle, when CPI inflation running at 14%.
I would only pay that much for one ounce of gold if I were expecting double-digit inflation forever (or at least for many years). By January 1980, Fed chair Paul Volcker had already hiked interest rates up to 13%, and was talking tough about the need to hike rates even higher to kill off the 1970s inflation.
As it turned out, the Volcker rate hikes, and the deep double-dip economic recessions they caused, brought inflation back to below 2.5% by the middle of 1983, and below 2% by early 1986.
I remember the gold fever in 1980, and it was as hard then (and again in 2011) as it is today, to hose down people’s enthusiasm to jump on the bandwagon. (I had no money to buy back then anyway, I was a university student studying this stuff!).
From the 1980 peak, the nominal price of gold fell by -70% to $250 by 2001, and the real price fell by -85%.
A lousy inflation hedge and a lousy investment. Even today, more than 40 years later, gold is still 30% below its 1980 peak price in real terms after inflation.
Covid and beyond
Recently, gold and inflation have gone through wild surges in opposite directions:
- From the start of 2020, the gold price spiked up +33% to above $2,000 by August 2020, but US inflation had fallen below 1% pa (and negative monthly inflation in mid-2020) – in the Covid lockdown crisis.
- Then, in 2021, when inflation soared to 7%, the highest in 40 years, the gold price fell! why?
- From the end of October 2022 to early May 2023, US inflation fell from above 7% back to 4%, but the gold price jumped +25%. Why?
- So far in 2024, the gold price has risen +6%, but inflation is still falling slightly from, 3.3% to 3.2%. Why?
This is the opposite of an inflation hedge.
Ultra-long hedge against money de-basement and policital crisis
Gold may not have been an effective inflation hedge over short, or even multi-decade periods, as we show here, but it has proven to be the ultimate hedge against inflation of paper currencies, and also a hedge against the fall of political and economic systems, over periods spanning thousands of years.
When economic systems break down – like the fall of the Roman Empire after the price inflation due to centuries of money debasement by successive Emperors, especially during the period 148-284 AD, citizens rejected the Empire’s debased ‘silver’ denarii and reverted to gold aureus and solidus, and other ‘real’ assets, like bags of flour, for daily transactions and stores of wealth.
While it is true that gold has proven its worth as the ultimate store of real value over thousands of years spanning the rise and fall of empires and economic systems – that is another story for another day! Here we are concerned about its use over our effective lifetimes, which is counted in decades, not millenia.
We find that, over periods like a few decades or so, the gold price has been highly volatile (in paper money terms), and therefore timing is critical.
When to buy?
If gold has not been an effective inflation hedge over short or even multi-decade time periods, is it ever worth buying?
Yes, when it is cheap. Take a look at the chart. Fortunately, gold is cheap most of the the time.
A simple rule of thumb would be that gold is cheap when it is in the lower half of the price cycles.
Personally, I have a fair bit of gold (in various forms), bought over many years.
The gold price is now in the upper half of the price cycles, so at first look it would seem too expensive to add to the holdings. However I give some reasons for taking another look below.
31-year cycles
The chart shows that each price peak for gold has taken 31 years to recover in real terms after inflation.
The last price spike (ie collapse in the value of paper dollars against gold), was in 2011, right on cue 31 years afer the 1980 peak.
(I bought silver, via ETF, during the run-up in prices because of temporary distortions in the gold-silver ratio in 2010-1, which made returns on silver even better than gold.)
The causes of the 2011 gold price bubble were mostly not about inflation. It is true there were fears that US money printng may lead to Weimar-style hyper-inflaton, but mostly the reason for the sudden popularity of gold was a loss of faith in the US government as a result of the post-GFC trillion dollar budget deficits, the cavalier use of tax-payer funds to bail out Wall Street banks and pay bankers’ bonuses, and the US government losing its coveted ‘AAA’ credit ratng from Standard & Poor’s.
The gold price hit $1,900 USD per ounce in September 2011 after the credit downgrade. I was flooded with emails in late 2011 and early 2012 from people predicting gold was going to further double or treble in price.
At the time, there were price targets of $3,000 and even $5,000 per oz trumpeted from the usual frenzied media and so-called ‘experts’ – it was a sure thing! I dug out my early versions of this same chart and tried my best to talk people out of buying at peak prices.
Today’s story is essentially an updated version of the story I wrote at the start of 2012 to try to stop investors from jumping on the bandwagon in the middle of the media hype.
What happened after the 2011 gold price spike?
The gold price promptly fell by 40% over the next four years. The fall was -47% in real terms after inflation. Ouch!
Prices of gold and all other industrial commodities plummeted in the ‘China slowdown’ crisis through to the end of 2015 and early 2016. Suddenly, gold was out of fashion again, and nobody would touch it or talk about it.
(That’s a sure sign that it is probably cheap and unloved enough to think about buying. Never follow the crowd – a good rule of thumb is to do the opposite.)
Why focus on ‘real’ prices after inflation?
It is true that the ‘nominal’ price of gold has risen spectacularly from US$20.67 per oz in 1860 to US$2,100 now. That’s a 100-fold price rise!
But that ignores inflation.
$20.67 in 1860 dollars would buy goods and services worth more than $700 in today’s dollars (or 34 times what it bought in 1860) – ie paper US dollars have lost 97% of their purchasing power over the period.
If gold is supposed to be an ‘inflation hedge’, or a ‘store of real value’, then we need to focus on the real price or value after inflation.
(For Australians and other non-US investors, we need to also look at returns in our ‘local currency’ terms, but that is another story for another day. Here we just look at the US dollar price.)
Losses in ‘nominal’ terms
Some people are tempted to say, “Even if we ignore inflation, we can just buy it because surely it will go up over time.”
Maybe over very, very long periods but, as with all forms of investing, timing is everything.
Even in ‘nominal’ terms, gold has gone backwards for many years at a time, especially if bought during a price spike. For example:
- People who bought in the 1865 price spike had to wait 107 years until 1972 to get their money back in nominal terms before inflation (and they finally got their money back in real terms after inflation in 1974).
- People who bought in the 1980 price spike had to wait 28 years until 2008 to get their money back in nominal terms before inflation (and are still waiting today to get their money back in real terms after inflation).
- People who bought in the 2011 price spike had to wait 12 years until 2023 to get their money back in nominal t erms before inflation (and are still waiting today to get their money back in real terms after inflation).
Some readers may object to me picking the tops of price spikes as the starting points for this exercise.
I do it because that is precisely when the buying frenzy is at is peak, when hordes of otherwise careful people finally capitulate and ‘take the plunge’ because ‘everyone else is doing it’. ‘FOMO’ is a powerful emotion, but it is sure to lead to disappointment.
Current price rise?
If inflation rates are is still declining in the US and around the world, what is driving the gold price higher? There is no one single dominant factor in the recent buying.
The main buyers over the past couple of years have been central banks, seeking to diversify away from the US dollar and, in particular, to reduce their vulnerability to US sanctions.
This motivation gained momentum when US government froze Russia’s US dollar assets after it invaded Ukraine in February 2022. This was a big wake-up call for governments (and their central banks) specially in anti-US dictatorships. No prizes for guessing who.
There are also reports of buying from Chinese citizens, as an alternative form of saving, with residential property prices falling and construction companies collapsing and leaving unfinished apartment blocks everywhere.
Why 31 years?
Each cycle in the real gold price has lasted around 30-odd years. I have chosen 31 years as that was the time it actually took for the real price to recover from the each of the peaks over the past 160 years, as highlighted in the chart.
The fact that it has been 31 years may be linked to the time-frame for investor memory. 31 years happens to be about one generation, which is enough time to give birth to a new generation of gold bugs, and long enough for people who got caught at the top in the last cycle to forget about their losses and dive into the next one.
However, this is unlikely to be a major cause, because most of the gold holding and buying over the past few centuries has been by banks and governments (central banks), not individuals. Recall also that US citizens were banned from owning gold for forty years between 1934 and 1974, so individual buying had nothing to do with price cycles in that period.
The cycle of economic orthodoxy
My thesis is that 30-odd years is the lifecyle of one incumbent economic orthodoxy to be replaced by the next.
As gold has been at the centre of how humans think about money for at the past three thousand years, the price of gold against other currencies (eg copper, silver, paper) has been a function of changes in economic orthodoxy over time.
Throughout history, humans have lurched from one set of economic theories to the next, and it has often taken about 30-odd years for each incumbent economic orthodoxy to run its course and be replaced by the next, and then the next, and the next.
Recent cycles in economic orthodoxy
For example, it took 30-odd years for the US Civil War inflation to be resolved, through the de-monetisation of silver in the 1870s and 1880s, depression and deflation in the 1890s, with William Jennings Bryan’s pro-inflation, agrarian, ‘silver lobby’ finally being defeated by the ‘hard-money’ city-based gold lobby, culminating in the McKinley election win in 1896, and single gold standard in 1900.
That new era lasted 30-odd years through the WW1 inflation, the 1920s boom, hands-off, free-market governments, culminating with hard-line Hoover in the Great Depression, and deep deflation in the early 1930s, which spawned Roosevelt’s Keynesian ‘New Deal’, involving a switch to heavy government intervention, spending, control, support, and regulation.
That new era of interventist, full-employment, centrist, high-taxing, expansionary governments, lasted 30-odd years through the inflexible Bretton Woods fixed exchange rate system, where Vietnam war spending and expansionary policies forced Nixon to break the gold link in 1971, and stagflation in the 1970s, which was finally broken by the switch from Keynesian to Monetarist policies, and Volcker’s inflation-busting recessions of the early 1980s.
That new era of disinflation, de-regulation, globalisation, neo-liberal, free-market capitalism, tax cuts, and ‘Fed-puts’, lasted 30-odd years, culminated in the 2008-9 ‘global financial crisis’ and 2011 US credit down-grade crisis.
The transition from one era of economic orthodoxy to the next is marked by a gold price spike (ie a sudden collapse in the value of paper US dollars against gold) – and each price spike happened to take 31 years for the real gold price to recover its value.
Prior to 1860?
Today’s chart just looks at just the past 160 years, to highlight recent cycles. In earlier periods we look to Britain and Europe as the global centres of capital markets before the US ascended to that role.
30-odd years before the US Civil war money-printing inflation, we had the ‘Corn Law’ repeal, and depression/deflation of the 1840s.
30-odd years before that, we had Napoleon’s war-time inflation spike. And so it goes back through history (although not all excactly 31 years per cycle of course!)
Current cycle
We are now into the next era of economic orthodoxy (the start marked by the 2011 gold price spike) – back to interventionist, centrist, re-regulating, big spending, interventionist governments, with expansionary deficits, and rising debts.
The current era was epitomised and cemented during the Covid lockdowns, when governments ramped up deficit spending, interventions, and hands-on controls. It is now expanding into protectionism, subsidising/picking winners, on-shoring and reviving local manufacturing, all funded by ballooning deficits and debts.
If history is any guide, there is a good chance the current economic orthodoxy will last around 30-odd years, until the early 2040s.
Why 30-odd years per cycle? Probably because it takes that long for a new economic orthodoxy to go through a few iterations, a few tweaks, a few government cycles, and it is enough time for a new generation of political leaders and economic thinkers to go from being radical outliers to accepted wisdom, and finally become the next incumbent orthodoxy replacing last one.
Gold price target?
If the 31-year theory holds true, then we are currently around 13 years into the current 31-year cycle from the last gold price spike of $1,900 in 2011.
(That also assumes around 2042 for the next turning point in economic orthodoxy – from the current (new) round of interventionist, big-government, re-regulating, centrists, etc, to shift into the next one, whatever that might be, probably another backlash against big government, triggered perhaps by a government default or civil uprising. Who knows! Bring it on!).
That puts the next gold price peak in about the year 2042, some 18 years from now, for the price of gold to recover its 2011 peak, in real terms.
What is our price target for gold in 2042?
The 2011 peak price of $1,900 at US inflation at say 2.0% pa for the next 18 years = $2,700 per oz in nominal dollars in 2042.
[ $1,900*(1+2%)^18 – 1 = $2,713 ]
If we were to buy gold today at say US$2,200, expecting it to reach our target of nominal price target of $2,700 by 2042, that would be an average nominal return of just 1.2% pa for the next 18 years to 2042.
[ ($2,700/$2,200)^(1/18) - 1 = 1.2% ]
That would be a lousy return on investment, and well below the expected inflation rate, even in a most optimistic outlook for inflation. This potential 18-year hold from now (2024) to 2042 would thus not be ecnomic, however shorter term tactical holds may make more sense, depending on conditions. I am looking at this closely now.
Stickier inflation?
As an alternate scenario to the above, if we allow for US inflation to be ‘sticky’ for a while, and average say 2.5% over the next 18 years until the next gold price spike:
The 2011 peak price of $1,900 at US inflation of 2.5% pa for 18 years = $3,000 per oz in nominal dollars in 2042.
[ $1,900*(1+2.5%)^18 - 1= $2,962, rounded up to say US$3,000 ]
If we were to buy gold today at say US$2,200, expecting it to reach our target of nominal price target of $3,000 by 2042, that would be an average nominal return of 1.7% pa for the next 18 years to 2042.
[ ($2,960/$2,200)^(1/18) - 1 = 1.7% ]
That would still be a lousy return on investment, and well below expected inflation during the period.
The reason for the lousy forecast returns on these assumptions is that the current gold price is simply too high at current levels for a near 20-year price target, relative to the centuries-old price cycle.
As always, I am not intending to give ‘advice’ on whether to buy, sell, or hold anything. I simply urge readers to ignore the media chatter, take a step back to look at the bigger picture, and form their own views.
You decide!
Disclosure: I personally hold gold in various forms, although readers should not imply or infer anything from this, as it reflects decisions made years ago, that may or may not be applicable today. If and when I add it to portfolios I will write about it.
As always, my analysis is fact-based and intended to be as dispassionate as possible, regardless of whether or not I am a buyer, a seller, or holder of any security or asset. This quick, initial snapshot is no substitute for detailed research required to make investment decisions.
This is intended for education and information purposes only. It is not intended to constitute ‘advice’ or a recommendation to buy, hold, or sell and stock or security or fund. Please read the disclaimers and disclosures below.