Key points:
-
- This relatively simple 10-year goal appears straightforward, but the outcomes seem little more than a coin toss – pure luck based on when you happen to start.
- To double your money in 10 years with a simple shares/bonds mix - sometimes you need 100% bonds, at other times you need 100% shares, about half the time you need a shares/bonds mix of some sort (with very wide variations in the mix), and quite often there is no possible portfolio that doubles in 10 years.
- The outcomes are virtually the same for Australian and US markets.
- This exercise with a simple goal illustrates some of the big problems for long-term investors. It gets even more difficult for more complex, real-life financial goals.
- For under 30-year-olds, the answer is - ‘Bitcoin, bro…duh!’
- For the under-25s - create a meme-coin with $100 borrowed from your Mum, pump it up for about 10 minutes, cash out, buy a boat, sail around the world for the next 10 years, wondering what out-dated legacy humans like me are carrying on about!
Double your money in 10 years – is that all?!
First of all, we’re not talking about crypto’s or meme coins, where the aim is to double your money in 10 minutes! Here we’re talking about the trillions of dollars invested to achieve long-term financial goals for billions of people across the world – in their own hands, or via private or public pension funds, etc.
This story is not intended for single-solution zealots – like perennial gold-bugs, or bitcoin bro’s, or ai evangelists, where the answer to every question and every situation is always their single solution of choice. This story is for professionals and serious long-term investors who are open to use different asset classes to achieve different goals in different conditions for people in different circumstances.
Mind you, by the time you finish reading this, you may be tempted to try your luck with crypto’s and meme coins!
Asset allocation dilemma
The purpose of investing is to achieve a financial goal or goals. But how do we know what particular asset or mix of assets will give us the best chance of achieving a given goal?
Before we get into complex goals like funding regular withdrawals, or building a retirement capital base with contributions, or keeping pace with inflation, or not running out of money before we die, etc, let’s start with a very simple financial goal - to double our money in 10 years.
I am not suggesting here that this goal applies to you or other readers. It is just a nice, simple goal that everyone can relate to, and it illustrates some of the problems of investing to achieve even a simple goal like this.
Doubling our money, ie gaining 100% over 10 years would require an average return of 7.2% per year over the 10 years. [On a calculator or spreadsheet: (1+100%)^(1/10)-1 = 7.2% pa].
(By the way, this is what started the widely-used ‘Rule of 72’ – you start with 72, divide it by the number of years to double your money, to get the required return: 72 / 10 = 7.2. Or you can start with 72, divide it by the annual return to get the number of years to double your money at that rate of return: 72 / 7.2 = 10 years.)
Shares & bonds – the simplest portfolio building blocks
For the available investment assets we can use to achieve this goal, let’s take the two most common asset classes used in long-term portfolios (in textbooks and in real life) – shares and bonds.
For bonds we use government bonds because they are so-called ‘risk-free’ assets, with relatively low returns much of the time. They have almost zero risk of permanent loss of capital if held to maturity, but do have some price volatility in market values along the way to maturity.
Shares are generally called ‘risky’ assets - offering the potential for higher returns but are more volatile. Diversification across a whole market (via a passive fund/ETF) can minimise the risk of total permanent loss of capital.
(For a diversified portfolio of shares (eg the broad Australian or US stock market index fund/ETF) there is still a risk of total permanent loss of capital for example if the country is invaded and all listed companies and or private assets are confiscated or destroyed. In that event, government bonds would probably also be worthless as well. Invasion and complete confiscation and/or destruction of assets and repudiation of debts may seem like an extremely remote risk for us today, but it has happened to many countries over the course of history – including over the past 100 or so years, which is not that long ago.)
For Australian investors – for shares we use the broad investable Australian share market, and for government bonds we use 5-year Commonwealth bonds. Both are investable via low cost index funds/ETFs.
For the US – we use the S&P500 and 10-year Treasury notes (we’ll call T-notes ‘bonds’ in this exercise as the Aussie market generally uses the term ‘bonds’ for all types of debt securities). Both are investable via low cost index funds/ETFs.
Why use 5-year bonds in Australia, but 10-year bonds in the US? Because US bonds are usually longer term than in Australia, and the US 10-year T-note has long been regarded as the ‘risk-free’ benchmark in the US. In Australia the 5-year bond has been more popular, and bond funds/ETFs generally have an average maturity much closer to 5 years than 10 years.
For this exercise we are looking at nominal total returns (ie capital gains plus income reinvested, not adjusted for inflation). All returns are before fees & taxes. (Fees can be minimised using ultra-low cost index funds/ETFs, and taxes can be minimised in superannuation accounts in pension mode.) Even allowing for fees and taxes, the results or this exercise are similar. There is also no allowance for fund ‘alpha’. Don’t laugh – some people actually forecast alpha! However, if there is any fleeting alpha, it is more than eaten up by fees.)
Long-term returns from Australian Shares & Bonds
The starting point for thinking about a mix of shares and bonds to achieve a 10-year return goal is to ask what are the long-term returns from our two asset classes - shares and bonds?
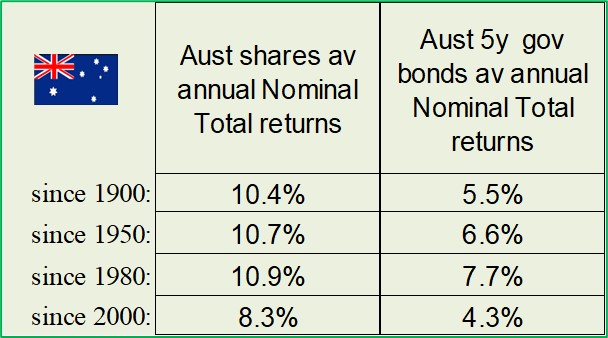
If we look at average long-term returns from shares & bonds, we see that the returns differ significantly depending on which particular ‘long-term’ we are talking about (returns are to December 2024):
In the US, we also have some big differences in returns over different long-term periods:

What is immediately obvious is the differences in returns over different long-term periods. This is, of course, the crux of the problem for long-term investors, as we see in a moment.
Some preliminary comments on differences in long-term average returns
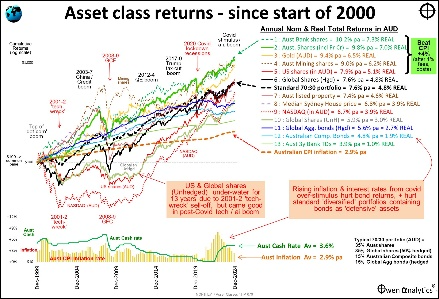
In the above tables, we see that the returns from shares since 2000 are markedly lower than other ‘long-term’ periods in both Australia and the US. This is because the starting point (beginning of 2000) was right at the top of the late-1990s ‘dot-com’ tech boom. US shares were more over-priced than Australian shares in the boom, and collapsed further than Australian share market, so the subsequent average returns from 2000 are lower in the US than in Australia. Pricing matters. Over-priced markets lead to low subsequent returns.
Likewise, the returns from bonds since 2000 are also markedly lower than other long-term periods in both Australia and the US. This is because the starting point was a low in the inflation cycle, and bonds in both markets (and around the world) were clobbered by the return of inflation in 2021 and 2022, which reduced the overall post-2000 average returns from bonds. Inflation matters. Rising inflation leads to lower returns from shares and bonds.
So, even these two simple tables at the outset illustrate the powerful impact of inflation and pricing on subsequent returns, and ‘long-term’ average returns.
Works in theory, not in practice
Looking first at Australia - if we take the period since 1950 as a starting point for example, Australian shares returned an average of 10.7% pa and bonds returned an average of 6.6% pa. With these average returns, a 14% / 86% mix of shares / bonds should, mathematically, have delivered 7.2% pa to double our money in 10 years.
The problem is that what should work in theory doesn’t actually work most of the time in the real world!
If a different investor started a 14% / 86% shares / bonds portfolio each month from the start of 1950 to the start of 2014 (the most recent completed 10-year period), only 38% of those investors / portfolios actually achieved our required 7.2% pa to double their money in 10 years. The majority (62% of investors / portfolios) fell short of the goal.
In the case of the US market - if we take the same period since 1950 as a starting point, US shares returned an average of 11.6% pa and US 10-year bonds returned an average of 5.2% pa since 1950. With these average returns, a 31% / 69% mix of shares / bonds should, mathematically, have delivered 7.2% pa to double our money in 10 years.
However, if a different investor started a 31% / 69% US shares bond portfolio each month from the start of 1950 to the start of 2014, only 37% of those investors / portfolios actually achieved the required 7.2% pa. 63% of investors / portfolios fell short.
Why did most investors / portfolios fall short of the goal which they mathematically should have achieved? Because those ‘average’ returns mask a host of ups and downs along the way, which greatly affect the 10-year portfolio returns.
Testing portfolio mixes
To simplify things, let’s pick nice, round numbers, for average returns. Let’s assume that we can get average returns of say 10% pa from shares and 5% pa from bonds. (Both of these are lower than the actual returns in the very ‘long-term’ periods on the above tables.)
With those return assumptions, mathematically a 44% / 54% mix of shares / bonds should achieve our 7.2% pa average return that will double our money in 10 years.
If we simplify it even further, let’s just use a simple 50/50 shares/bond portfolio. (This should do even better than a 44/54 mix because shares beat bonds overall.)
A 5/50 mix is the advice of Ben Graham (Warren Buffett’s university professor, mentor, and first boss, and is often referred to as the father of financial analysis and value investing) in his timeless classic, ‘The Intelligent Investor’:
-
-
- ‘The simplest choice would be to maintain a 50-50 proportion between the two.” – 4th Revised Edition, 1973, p 22, and
- “Our proposed 50-50 division is undoubtedly the simplest ‘all purpose’ program” (p.91)
If shares return 10% pa on average, and bonds return 5% pa on average, a 50/50 mix should mathematically return 7.5% pa, which is above our required 7.2% pa to double our money in 10 years. (Actually, the maths is a little more complex than just a simple arithmetical weighted average of the asset class returns, but the differences are minor.)
This may be good in theory, but using real world conditions, a 50/50 shares/bonds portfolio would only have achieved our 7.2% pa return goal 65% of the time in Australia, and just 52% of the time in the US.
Here are the outcomes for Australian 10-year 50/50 shares/bonds portfolios:
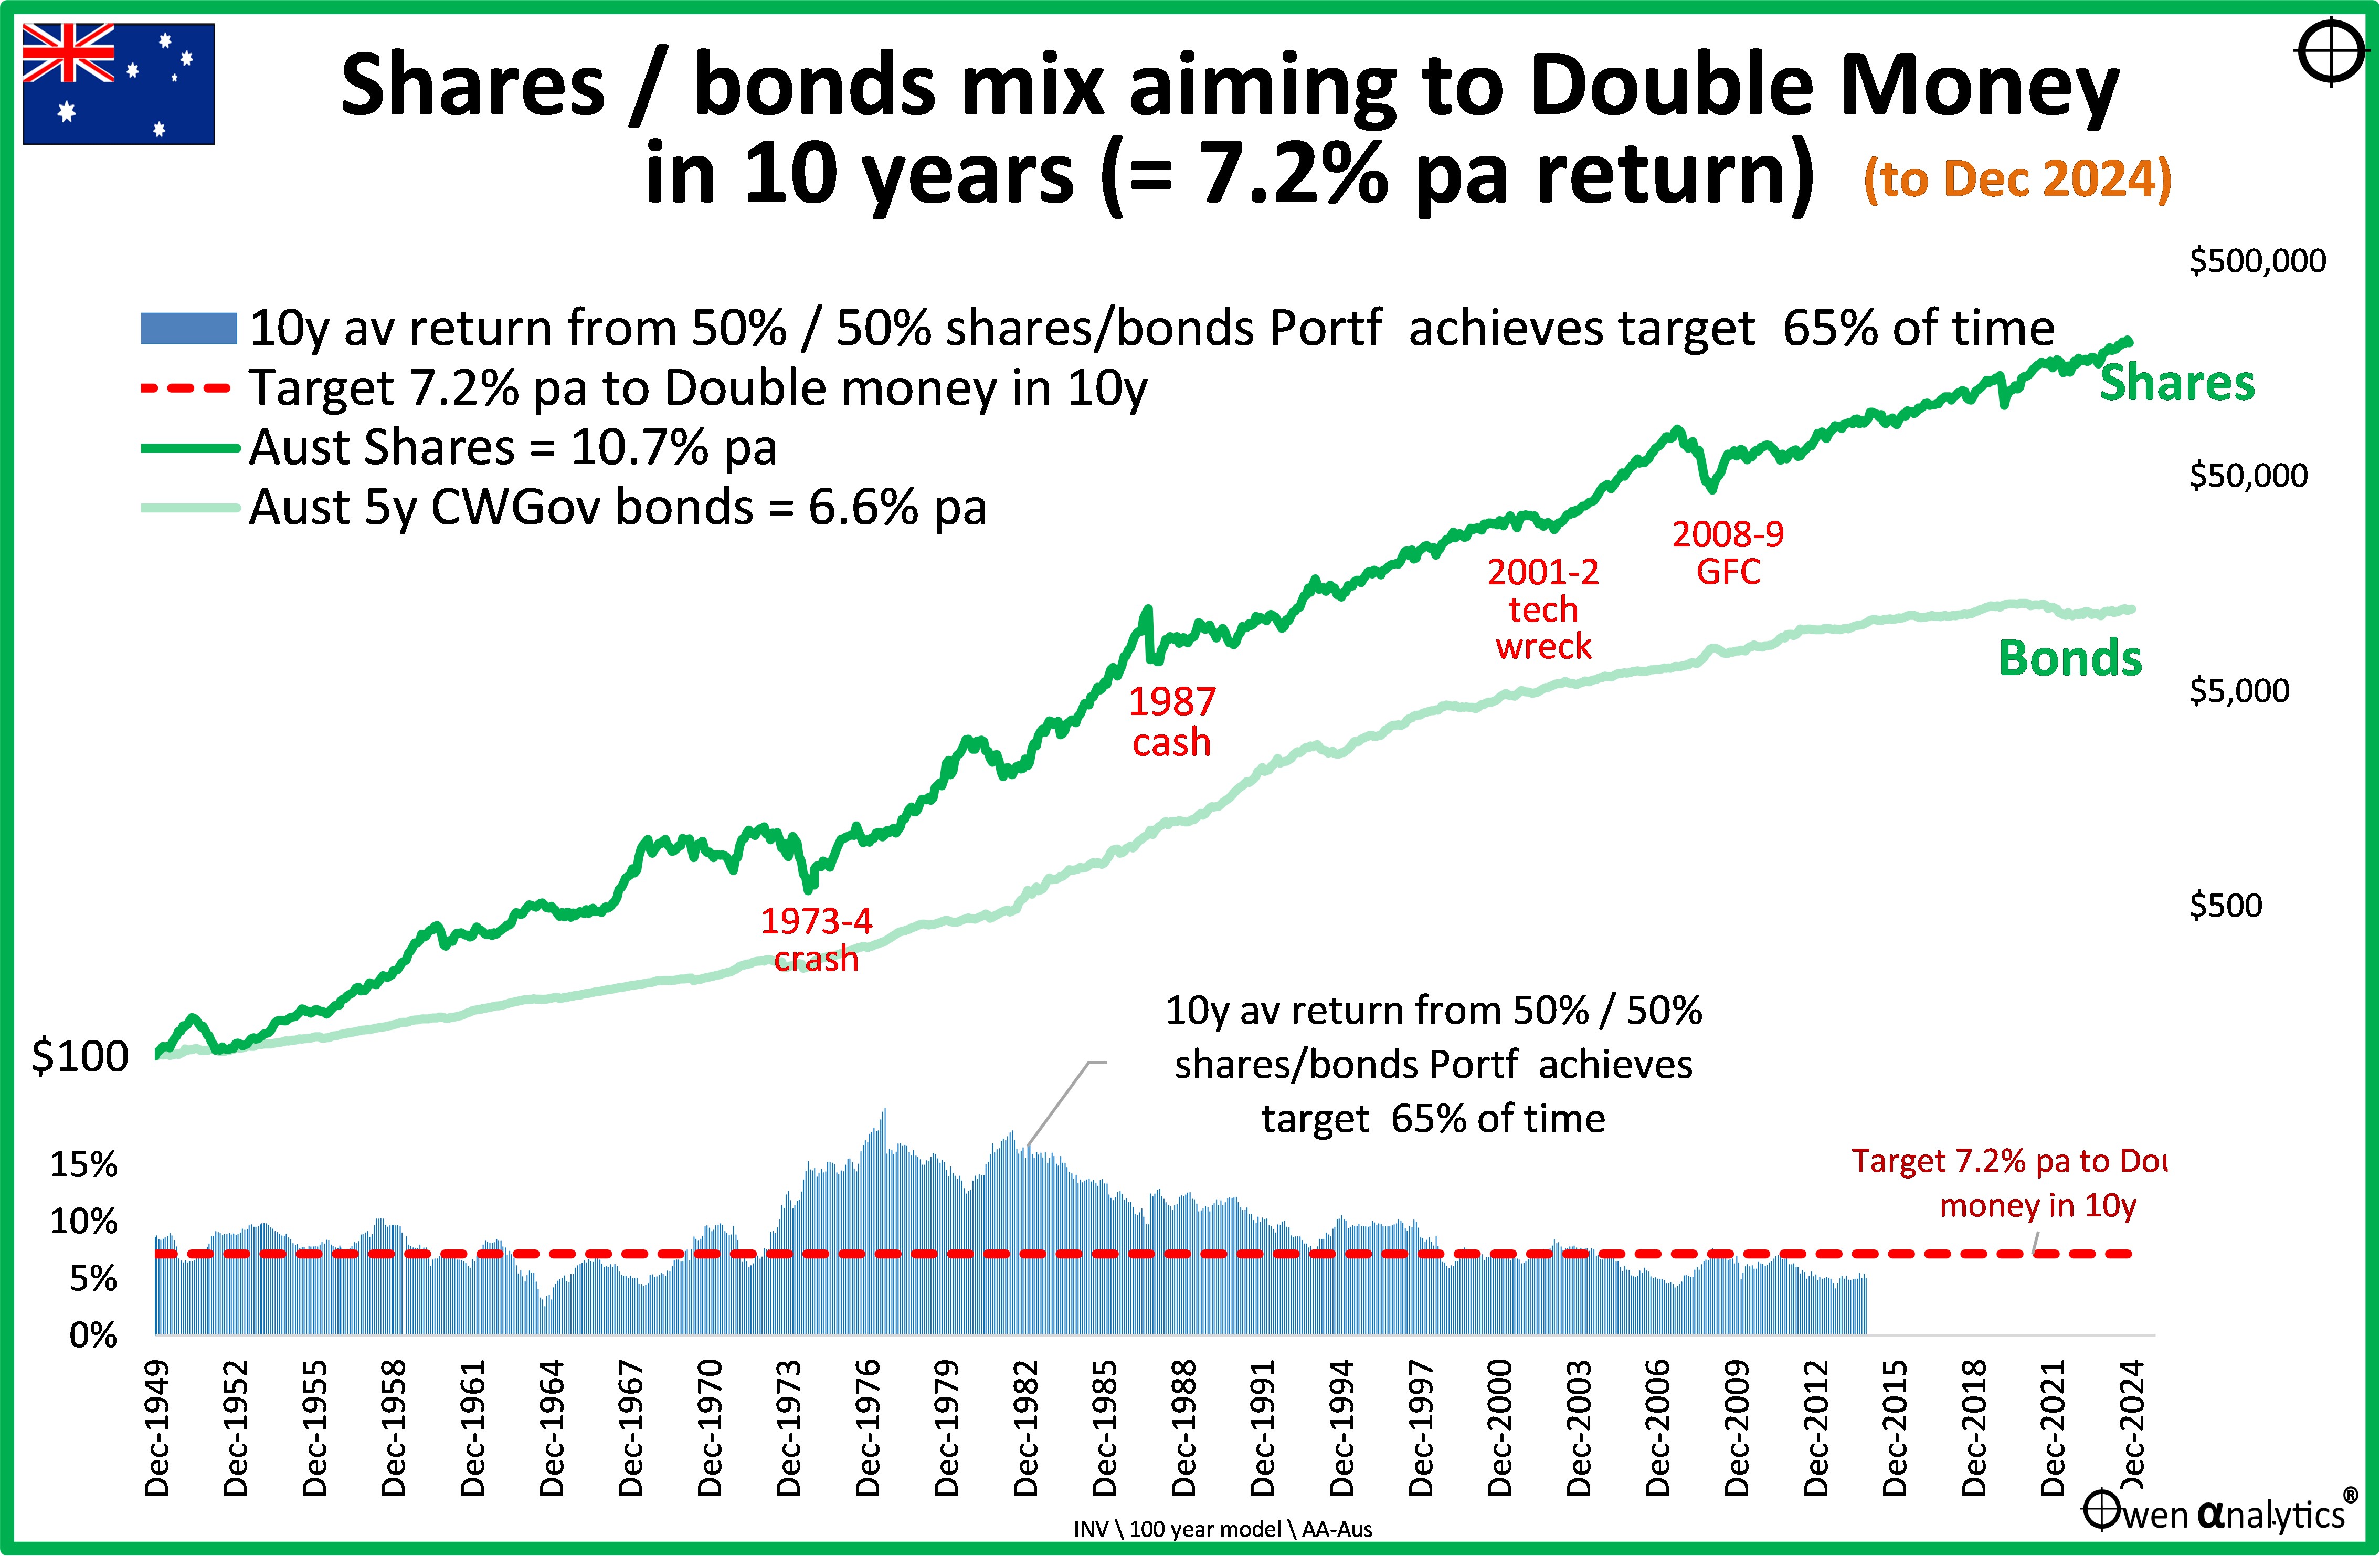
The blue bars in the lower section are the 10-year annualised returns from each of the 10-year 50/50 shares/bonds portfolios commencing each month from the start of 1950 in Australia. The portfolios are rebalanced regularly to maintain their target mix.
65% of the blue bars are above the required 7.2% target return line, and most of these are in the 1970s to 1990s. The rest are mostly below the target return line – ie they failed to reach the goal.
The best 10-year return from a 50/50 shares/bonds mix in Australia was a phenomenal 20% pa for the 10 years commencing September 1977, when shares returned 27.5% pa and bonds returned 12.5% pa in the 10 years from September 1977 to September 1987. (That was, of course, immediately before the October 1987 crash, when shares lost 50% and bonds lost 4%.)
The worst 10-year return from a 50/50 shares/bonds mix in Australia was a rather poor 2.6% pa for the 10 years commencing September 1964, when shares returned just 1.5% pa and bonds returned 3.6% pa in the 10 years from September 1964 to September 1974 (that was right at the bottom of the 1973-4 crash in which shares and bonds were both clobbered by high inflation and by the fiscal/monetary tightening measures to fight it)
Likewise for US 10-year 50/50 shares/bonds portfolios over the same period:
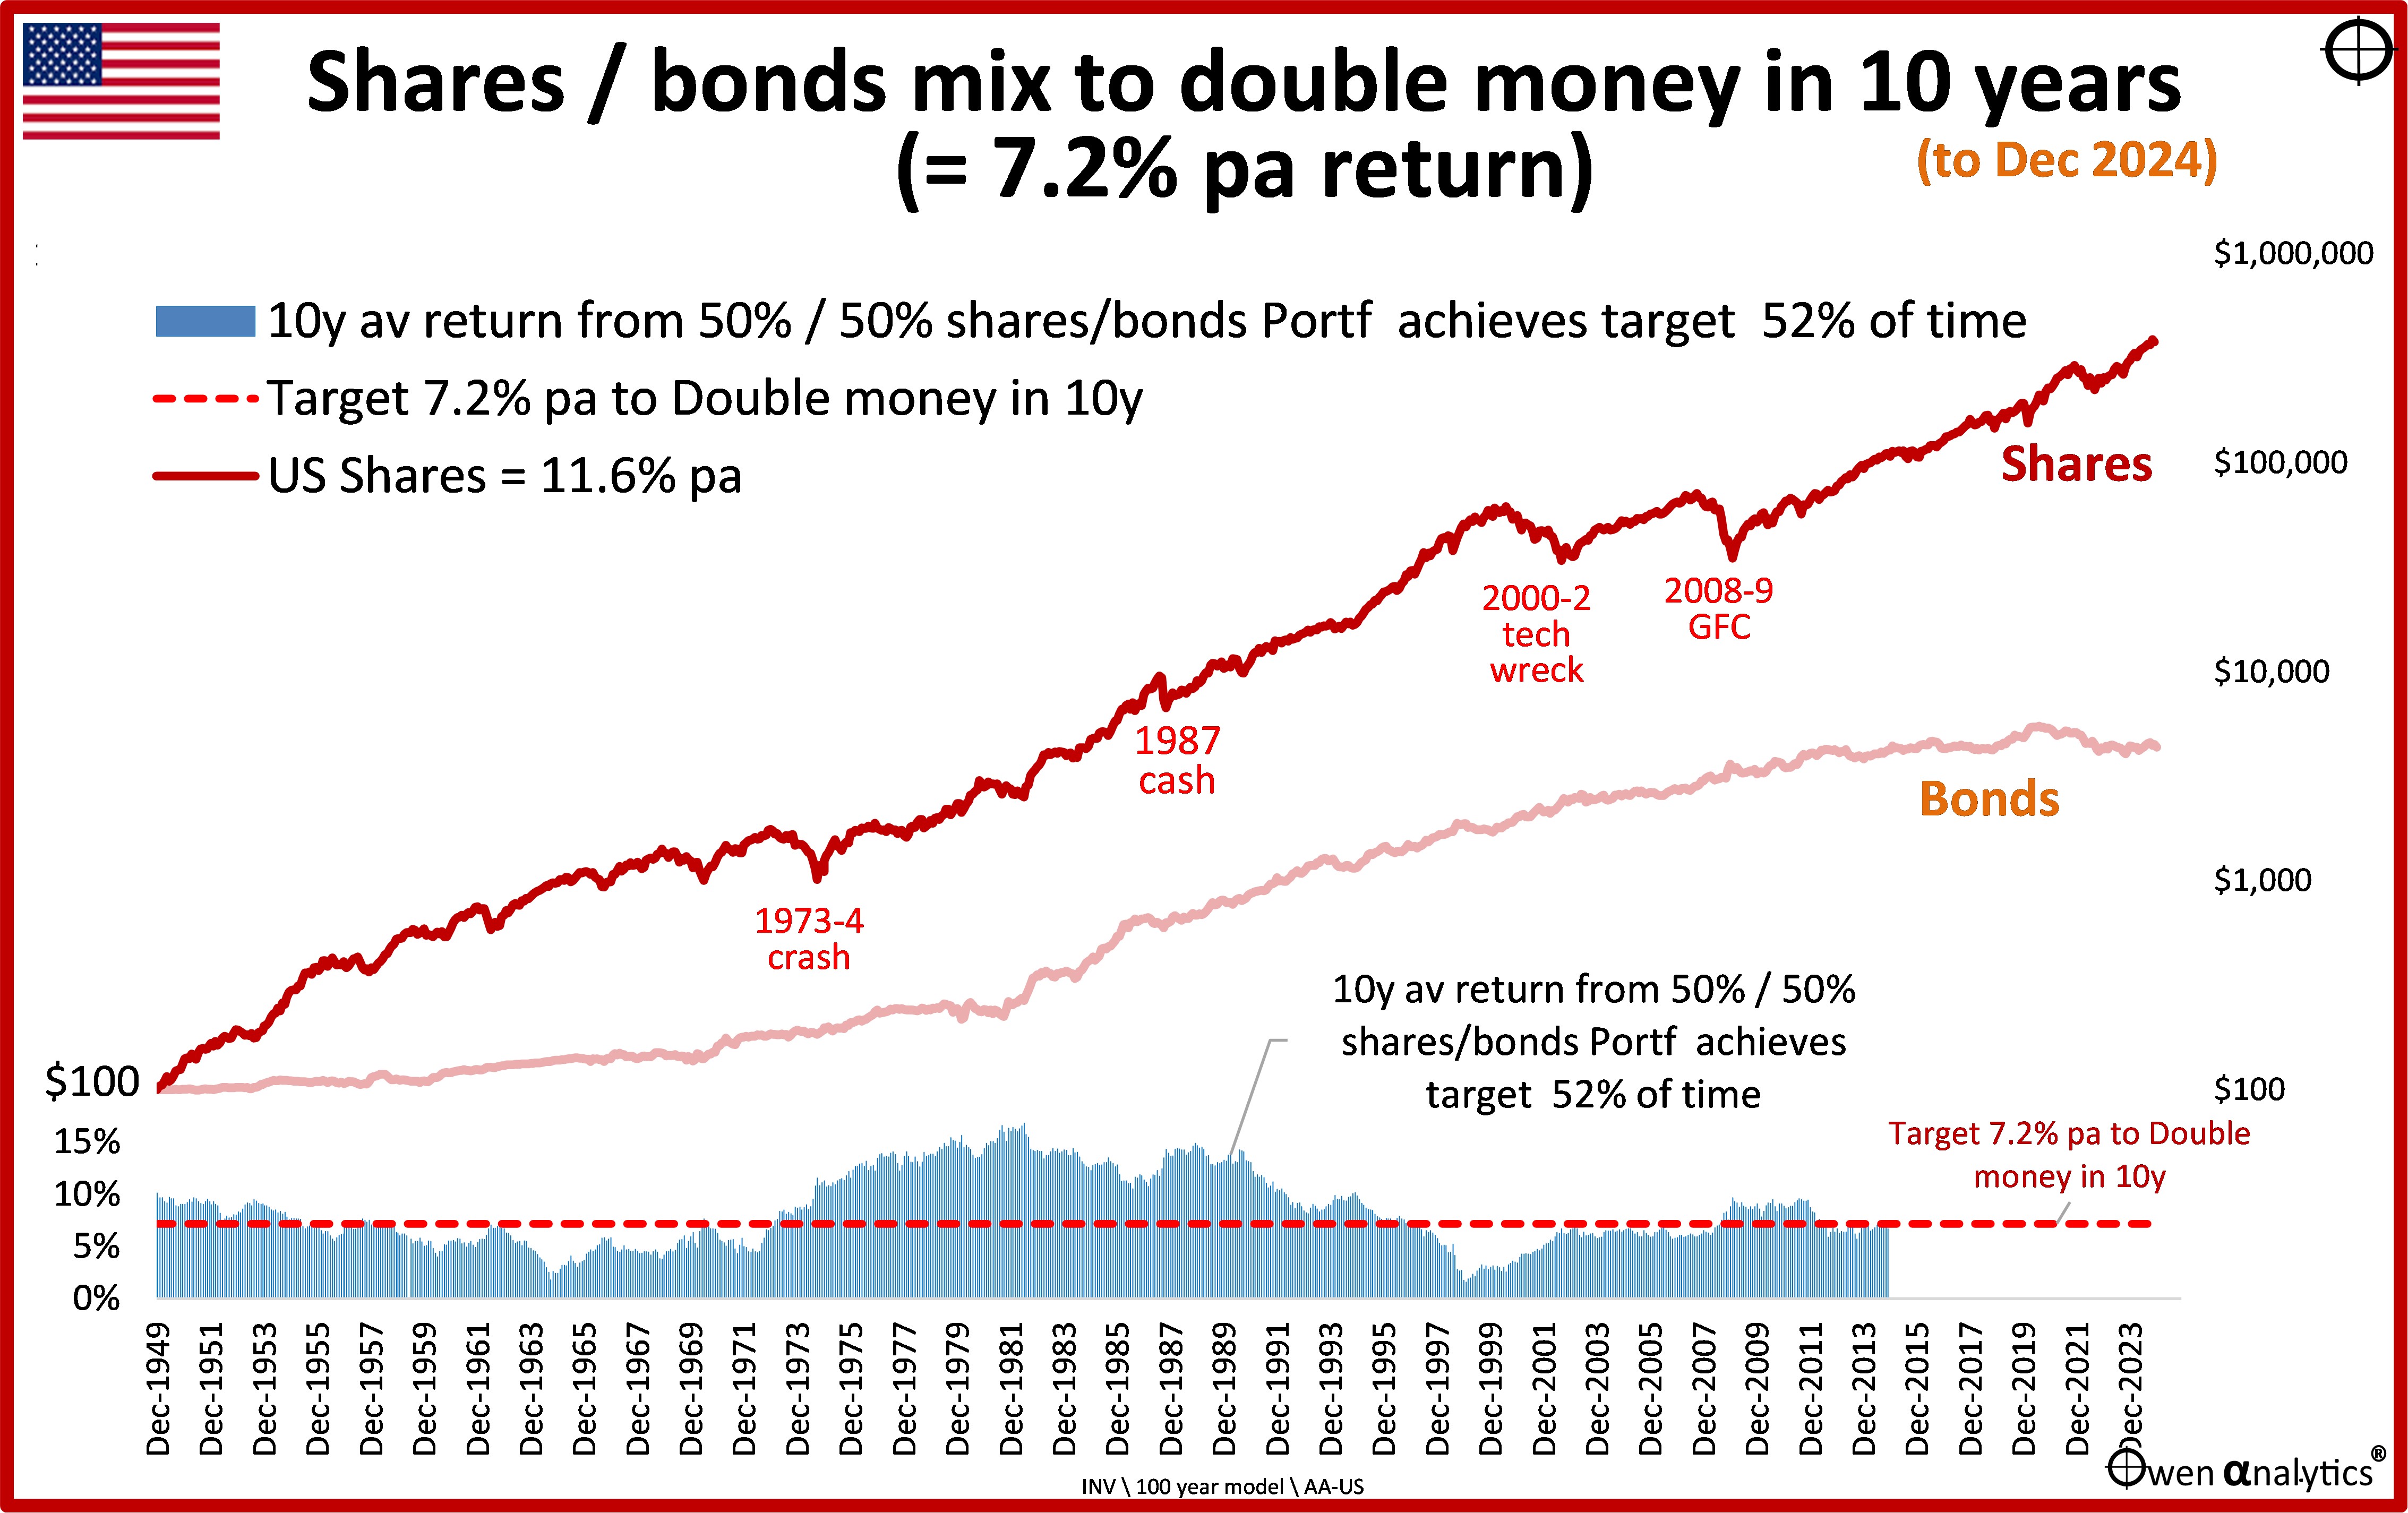
In both charts, the blue bars along the bottom are the annualised average 10-year returns from each of the 10-year 50/50 shares/bonds portfolios, compared to the required 7.2% average return target (red dots).
Like in Australia, most of the US 10-year 50/50 portfolios that achieved the required 7.2% annual return were started in the mid-1970s to the late 1990s. Outside of that period, most 50/50 mixes fell short of the goal.
What Asset mix will achieve 7.2% ap to double our money in 10 years?
If a 50/50 shares/bonds mix does not achieve the 7.2% average return goal much of the time in real life, despite the maths saying it should (on average), then what asset mix will achieve the goal?
The answer is - it depends:
-
-
- There are quite a few times when NO mix of shares and bonds achieve the 7.2% goal because neither shares nor bonds return 7.2% pa over the 10-year period,
- There are other times when bonds alone achieved the goal because bonds returned 7.2% or more over the 10 years,
- At other times, a mix of shares/bonds achieves the goal, but the actual mix varies greatly in each 10-year period.
The problem is that we can only see these things in hindsight.
On the next chart, the dark/light green bars in the lower section show the actual shares/bonds mixes that were required to achieve the 10-year 7.2% average return goal in each 10-year period / portfolio commencing each month from the start of 1950 in the Australian market:
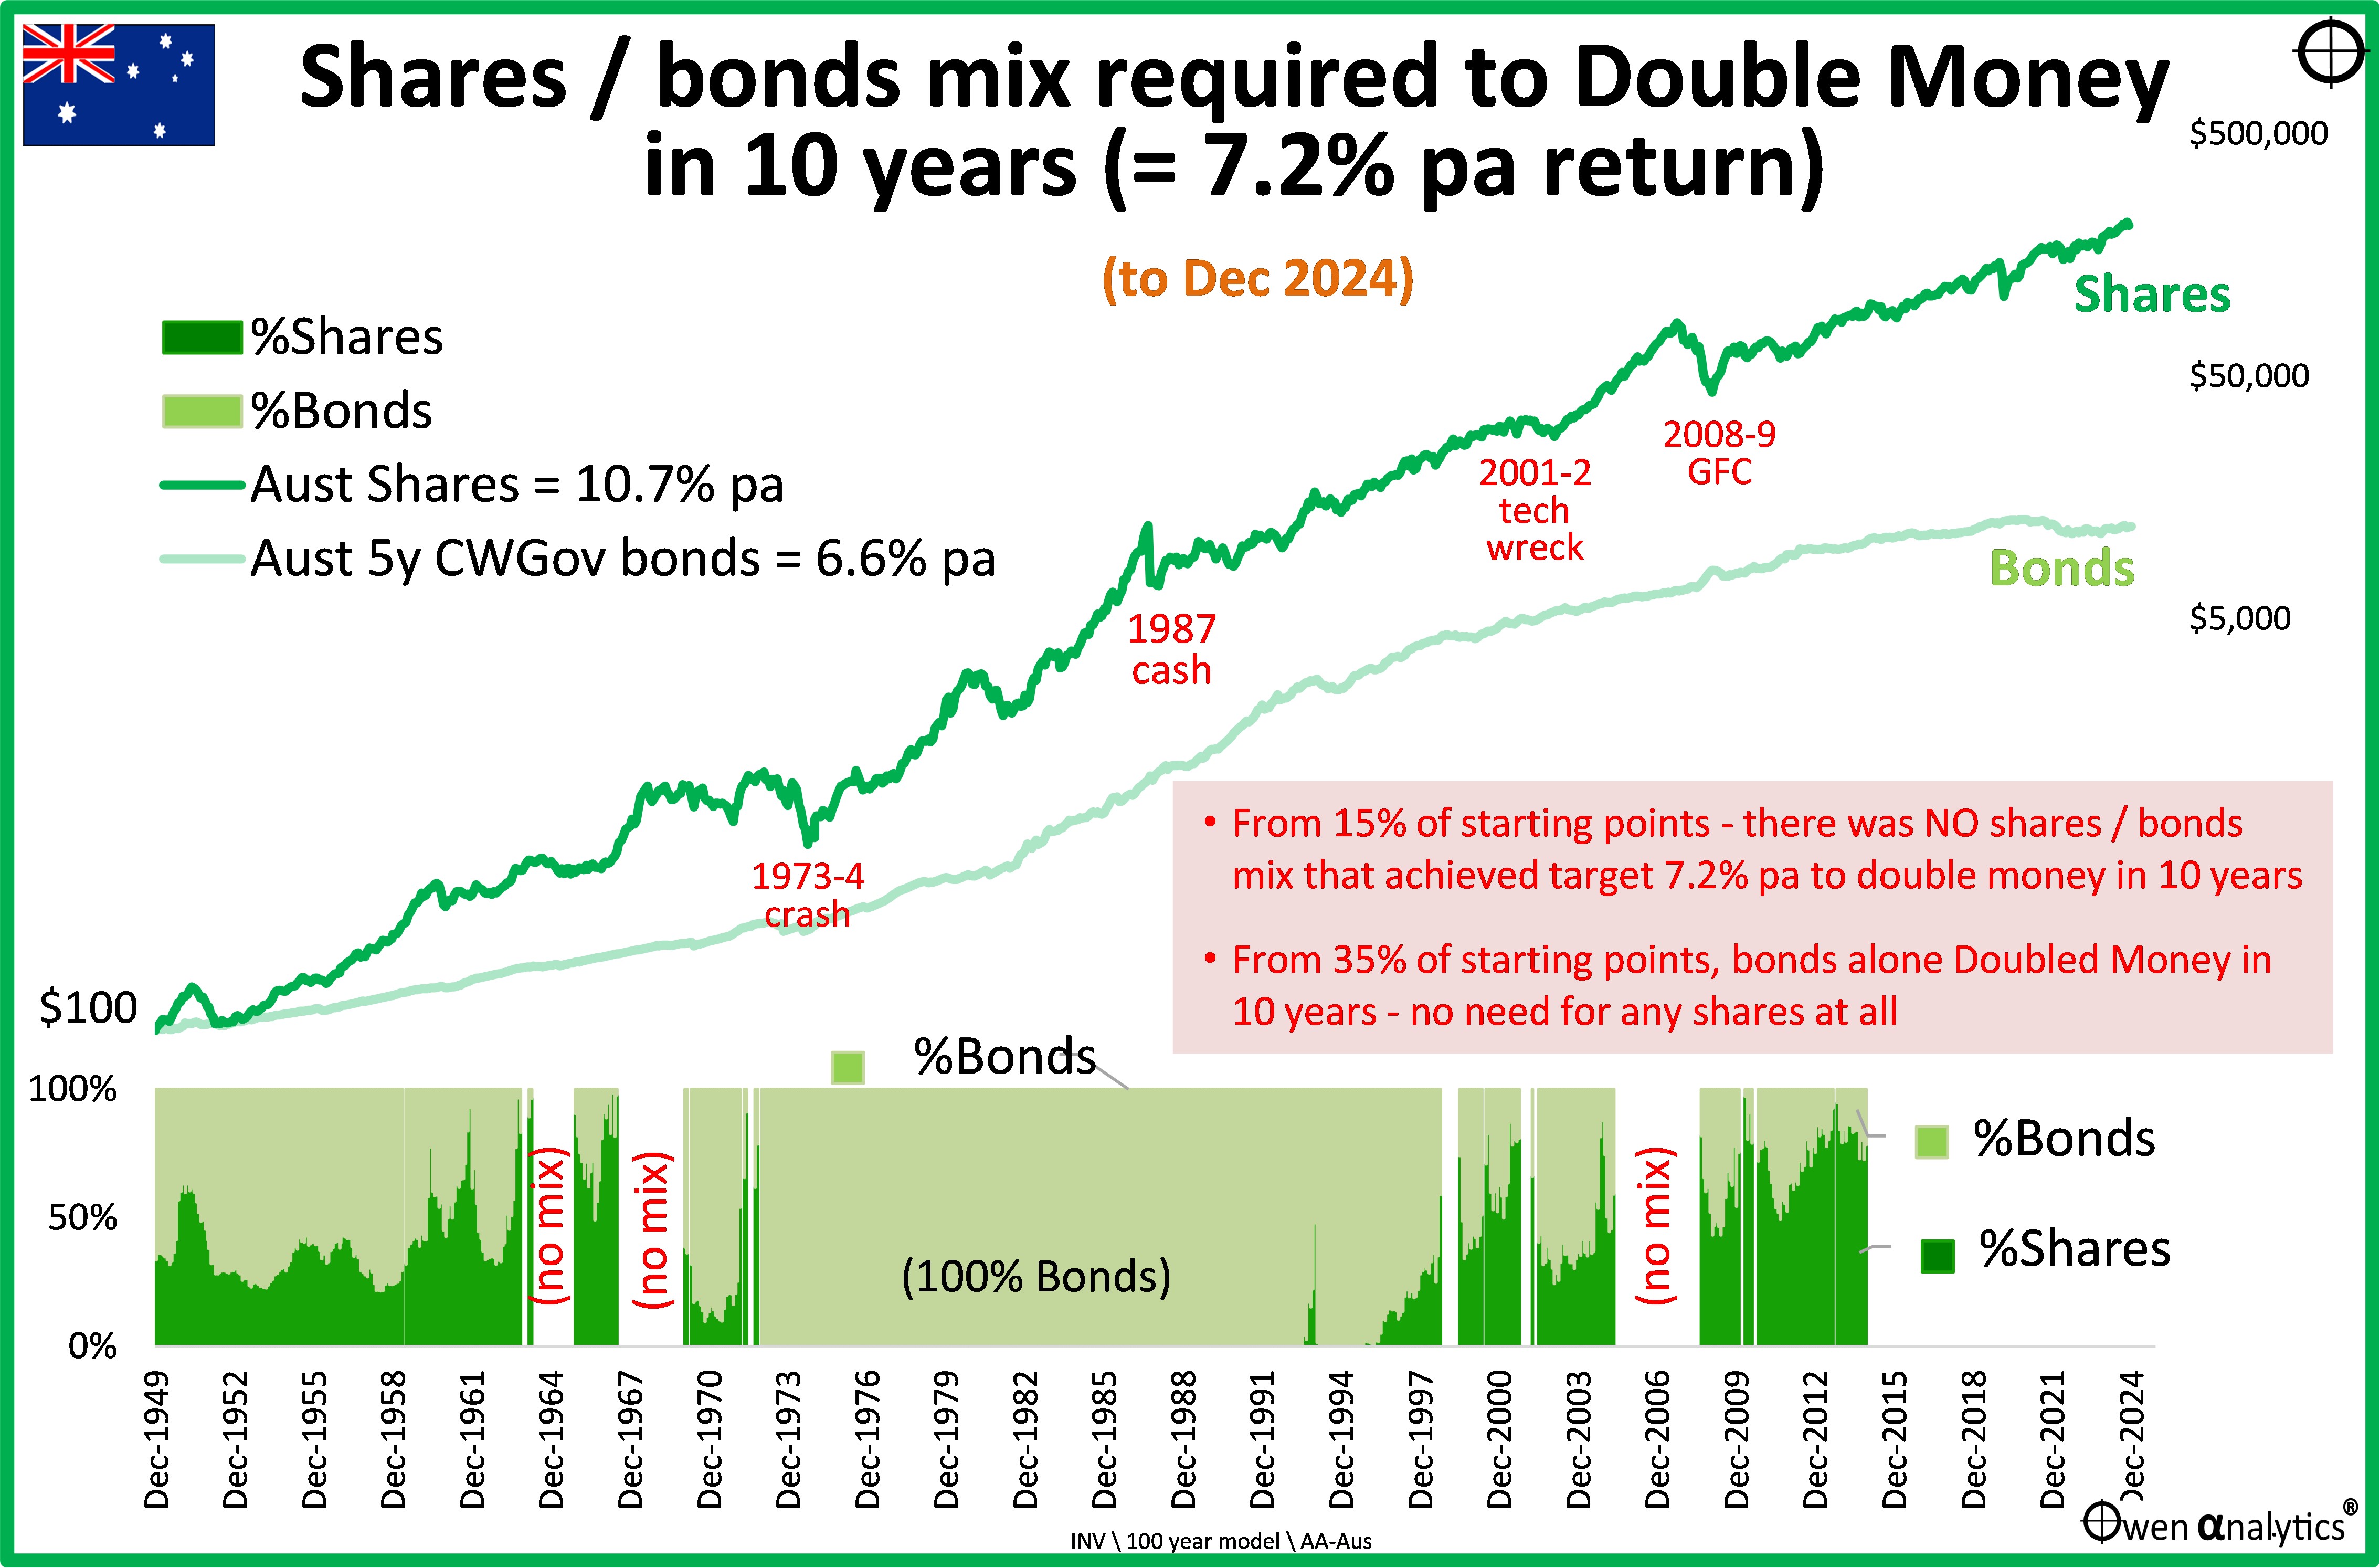
Each dark/light green bar in the lower section represents a 10-year portfolio mix commencing each month from the start of 1950.
-
-
- From 15% of starting points (10-year periods) - there was NO shares / bonds mix that would have achieved the target 7.2% pa to double the money in 10 years, because neither shares nor bonds returned 7.2% over the subsequent 10-year period. These ‘no mix’ periods were mainly in the mid-late-1960s, because both shares and inflation were hit badly in the 1970s inflation/recessions.
There was also a long stretch of ‘no-mix’ 10-year periods commencing from mid-2005 to 2008, when shares and bonds both failed to return 7.2% pa in the subsequent 10-year periods from those starting points.
-
-
- From 35% of starting points (10-year periods), bonds alone doubled the money in 10 years – there was no need for any shares at all in the mix because bonds returned the required 7.2% or more. Almost every 10-year period / portfolio between December 1972 and November 1995 were 100% bonds without the need for shares.
- The remaining 50% of 10-year periods / portfolios required a mix of shares and bonds to achieve the 7.2% pa return goal, but the mix varied greatly in each portfolio (each 10-year period).
- The most recent completed 10-year period / portfolio (January 2014 to December 2024) required a 78% / 22% mix of shares / bonds to achieve a portfolio return of 7.2% pa. That was quite a shares-heavy mix because bonds were hammered by inflation in 2021 and 2022.
Here is the same picture for the US market (US shares and US bonds):
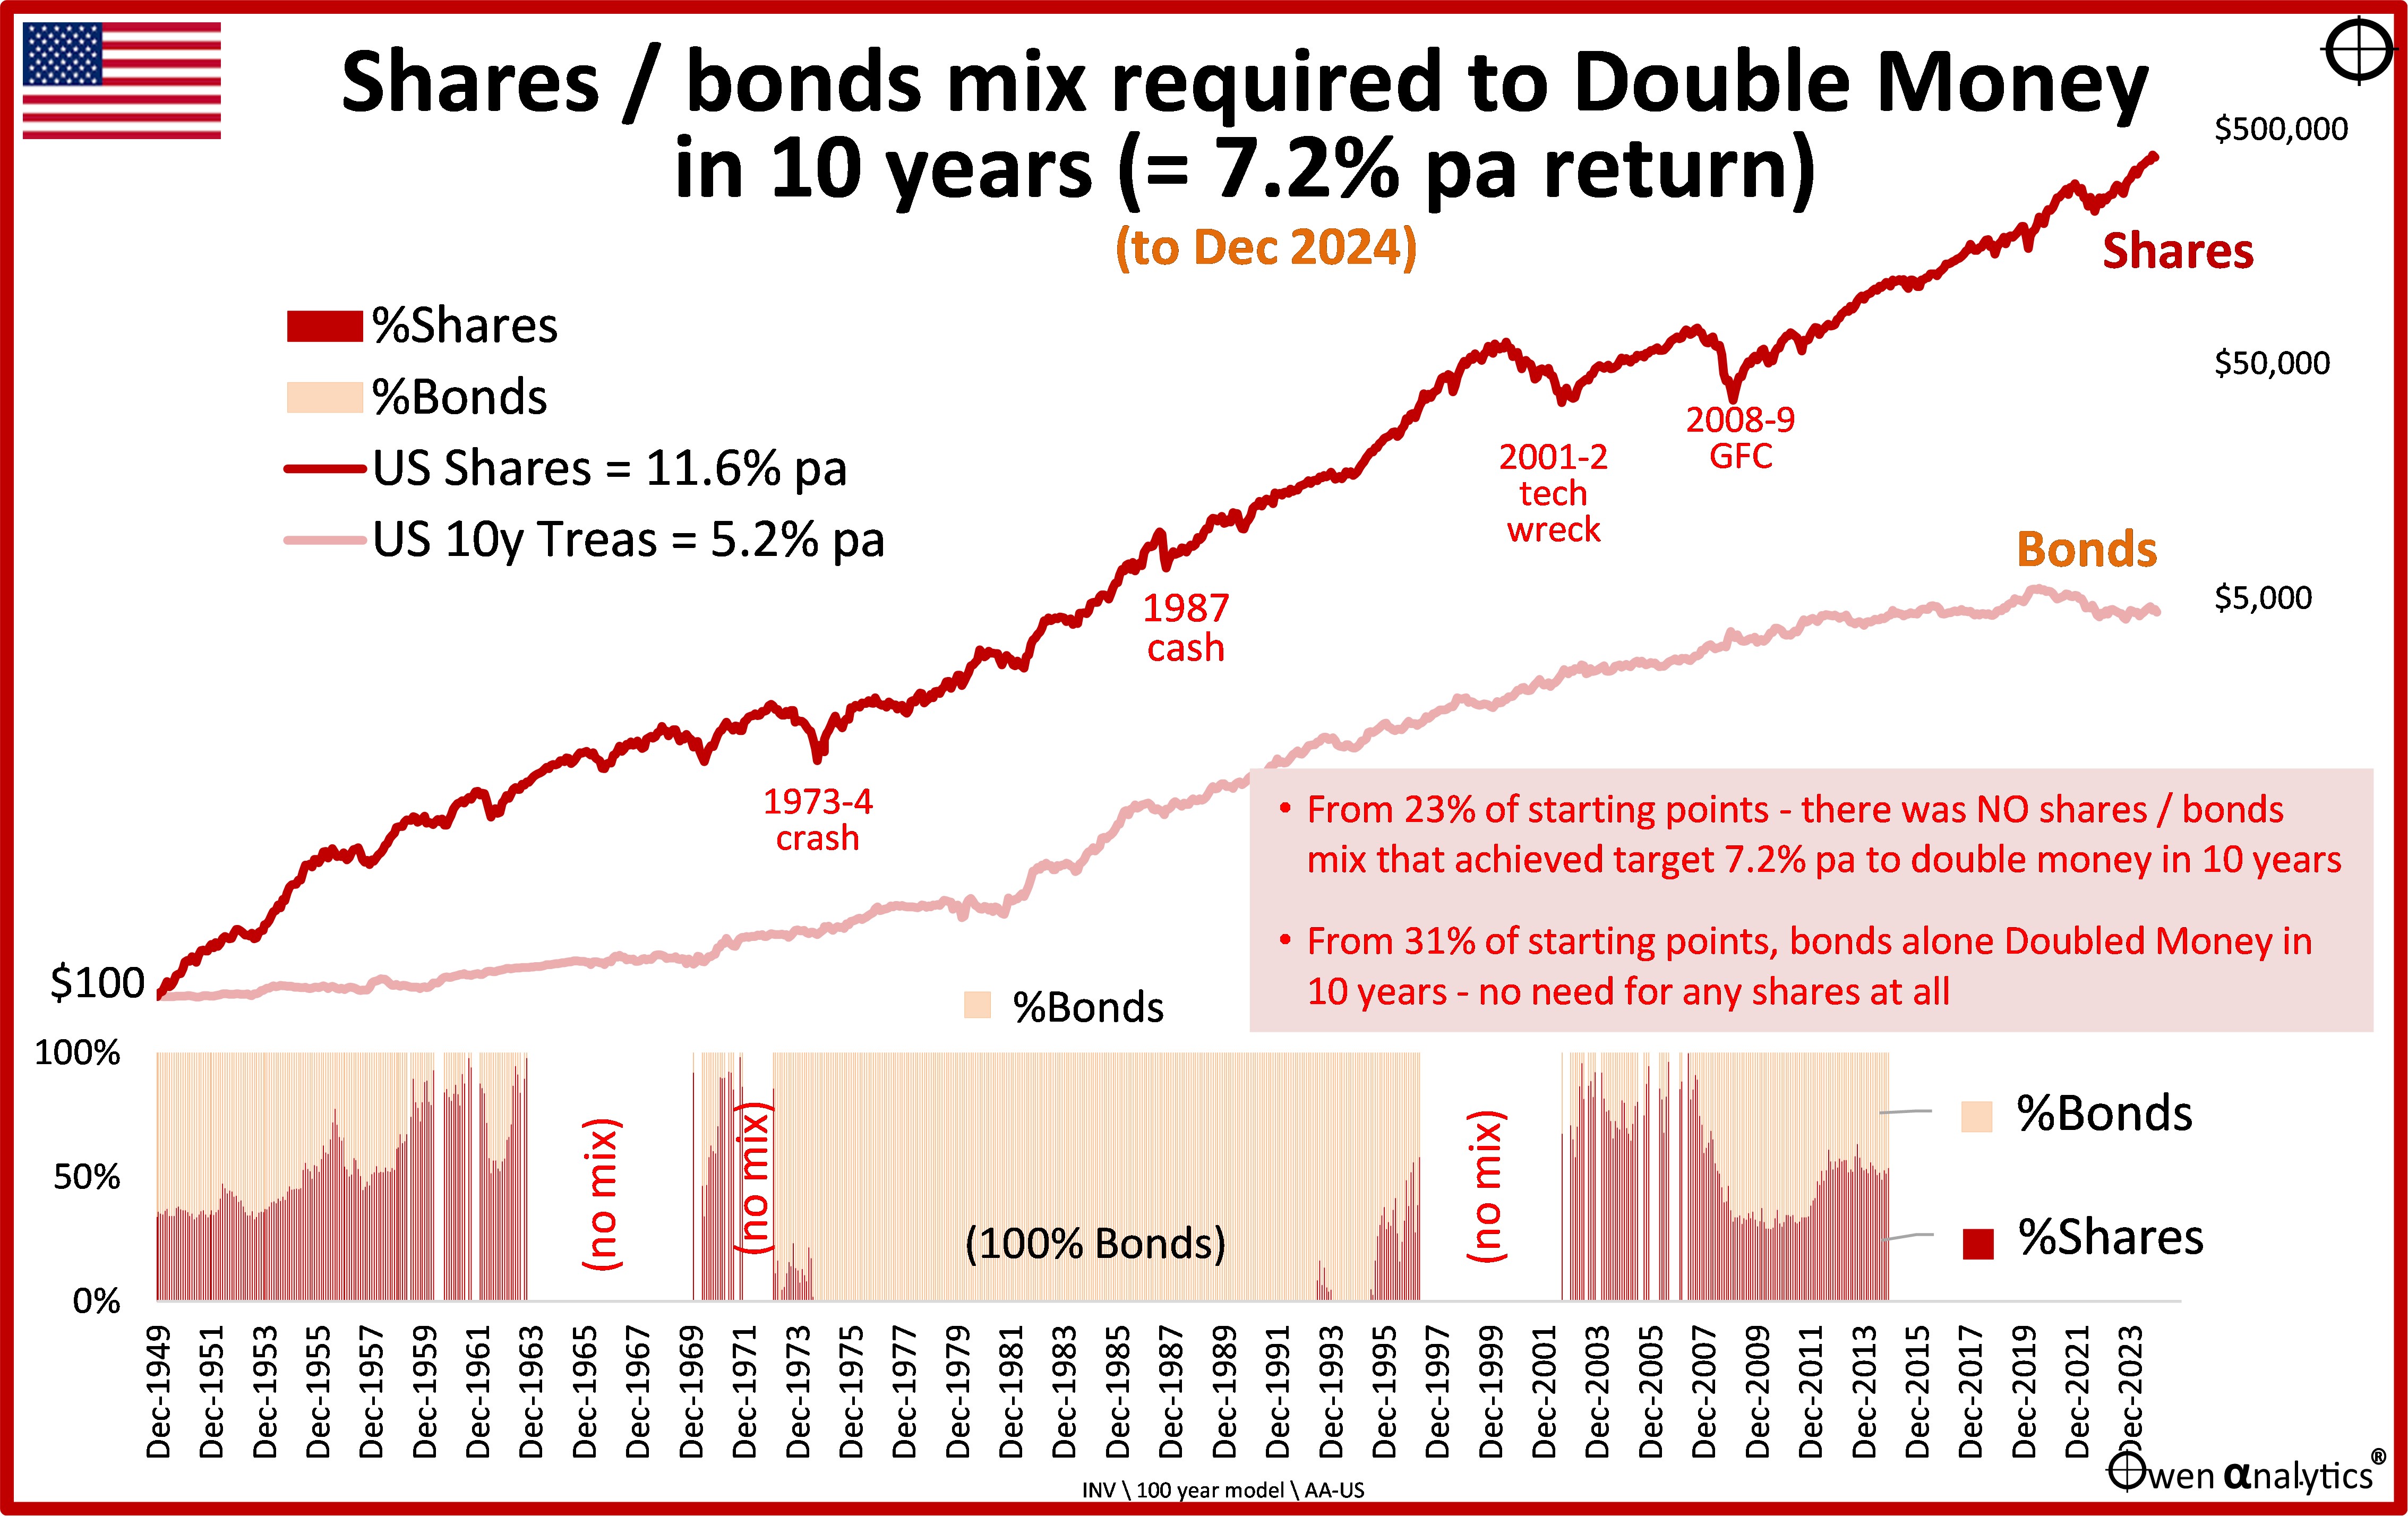
The outcomes are similar to the Australian market (because share and bond cycles are global):
-
-
- From 23% of starting points (10-year periods) - there was NO shares / bonds mix that would have achieved target 7.2% pa to double our money in 10 years, because neither shares nor bonds returned 7.2% over the 10 year periods. These were mainly in the mid-late-1960s, because both shares and inflation were hit badly in the 1970s inflation/recessions, as they were in Australia.
There were also several 10-year ‘no-mix’ periods starting from mid-1997 to late 2002, because shares and bonds both failed to return 7.2% over the subsequent 10 years.
-
-
- From 31% of starting points (10-year periods), bonds alone doubled the money in 10 years – there was no need for any shares at all in the mix because bonds returned the required 7.2% or more. Almost every 10-year period / portfolio between late 1973 and late 1995 were 100% bonds without the need for shares. Why take on the volatility of shares when you can achieve your goal with just bonds?
- The remaining 45% of 10-year periods / portfolios required a mix of shares and bonds to achieve the 7.2% pa return goal, but the mix varied greatly in each portfolio (each 10-year period).
- The most recent completed 10-year period / portfolio (January 2014 to December 2024) required a 54% / 48% mix of shares / bonds to achieve a portfolio return of 7.2% pa.
Observations and implications
When investing money to achieve any financial goal, even for a very simple goal as we have here -
-
-
- From any point in time, subsequent (future) returns are often very different from recent past returns and also very different from ‘long-term’ historical averages, so if we make allocation decisions based on recent past or ‘long-term’ historical averages, the chances of achieving our goals are probably going to be quite low.
- With the most widely used and deeply researched asset classes (shares and bonds) to achieve a very simple goal over a reasonably ‘long’ period like 10 years, the range of asset mixes required to achieve a given goal is extremely wide – from 100% to zero, from vastly exceeding the goal to failing altogether, for decades at a time.
- Simplistic text-book (and retirement planning) models like the standard 50/50 or 60/40 or 70/30 mix are based on long-term averages, but they lead to outcomes that are often radically different from investor expectations and goals, depending entirely on when you happen to start. Actual real world outcomes are so widely distributed and different from the theoretical projections, they seem little more than a random coin toss.
Not entirely a coin toss
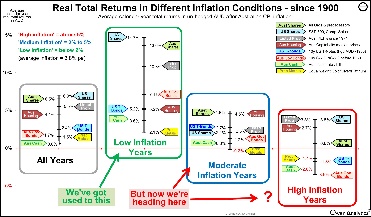
It is clear that, from any given starting point, subsequent returns for both shares and bonds (and other asset classes) are driven not by recent past returns, nor by long-term averages. The outcomes are determined by other factors, in particular: inflation conditions and pricing levels.
Fortunately these driving forces can be studied and can be used to form views on asset classes that make for more informed portfolio decisions that start to make investing more like an art and a science, and less like a coin toss as it appears on the surface.
These conclusions became obvious from our simple exercise to achieve a relatively simple one-dimensional goal – to double our money in 10 years. Things become even more difficult when we start to plan portfolios to achieve more complex financial goals like keeping pace with inflation, or building a retirement capital base with contributions, or funding regular withdrawals, or not running out of money before we die, etc,
Where are we now?
Given what I have learned from the above charts and analysis - if I had to select a shares/bonds mix to double my money in 10 years starting today – what would it be?
I could look at the most recent 10-year period on the above charts and see that the most recent shares/bonds mixes that achieved the goal are a 78/22 mix in Australia and a 54/45 mix in the US.
But that is no help to me now because that was the mix that achieved the goal 10 years ago (Jan 2014 to Dec 2024). A lot has changed in the world over the past 10 years – Trump, Covid, ZIRP/QE, China stalling, trade wars, massive rises in government deficits and debts, inflation, rate hikes, Russia/Ukraine war, Trump. . . .
What would your asset allocation be to double your money in the next 10 years? Please let me know what you think! (no single-solution zealots please!)
I thank you for your time, and hope this provides some food for thought on your investing journey. I certainly learned a lot from doing the exercise.
‘Till next time . safe investing!
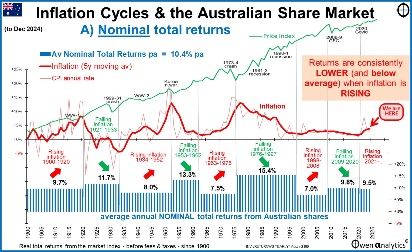
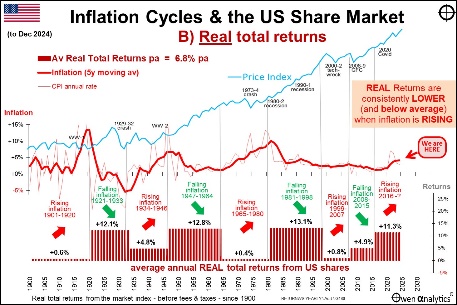
Here are some recent stories on the impact of inflation on share market returns -
For inflation impacts on other asset classes -
For a long-term perspective on asset class returns -
For my latest monthly market snapshot -