Greetings fellow investors! - Here’s my monthly snapshot on global markets for Aussie investors.
Key points:
- Share markets surge back in May after three negative months under Trump.
- My base case scenario – ‘TACO’ (‘Trump Always Chickens Out’) is proving correct. (I didn’t come up with that acronym unfortunately, but I wish I had!)
- Moody’s strips the US government of its Aaa credit rating, so shares surged – just like they did after the S&P downgrade in 2011.
- Labor wins ‘landslide’ election in Australia (how 34% of the primary vote can be a ‘landslide’ remains a mystery to me) – so it’s all systems go for even more debt-funded government spending, and tax-the-rich!
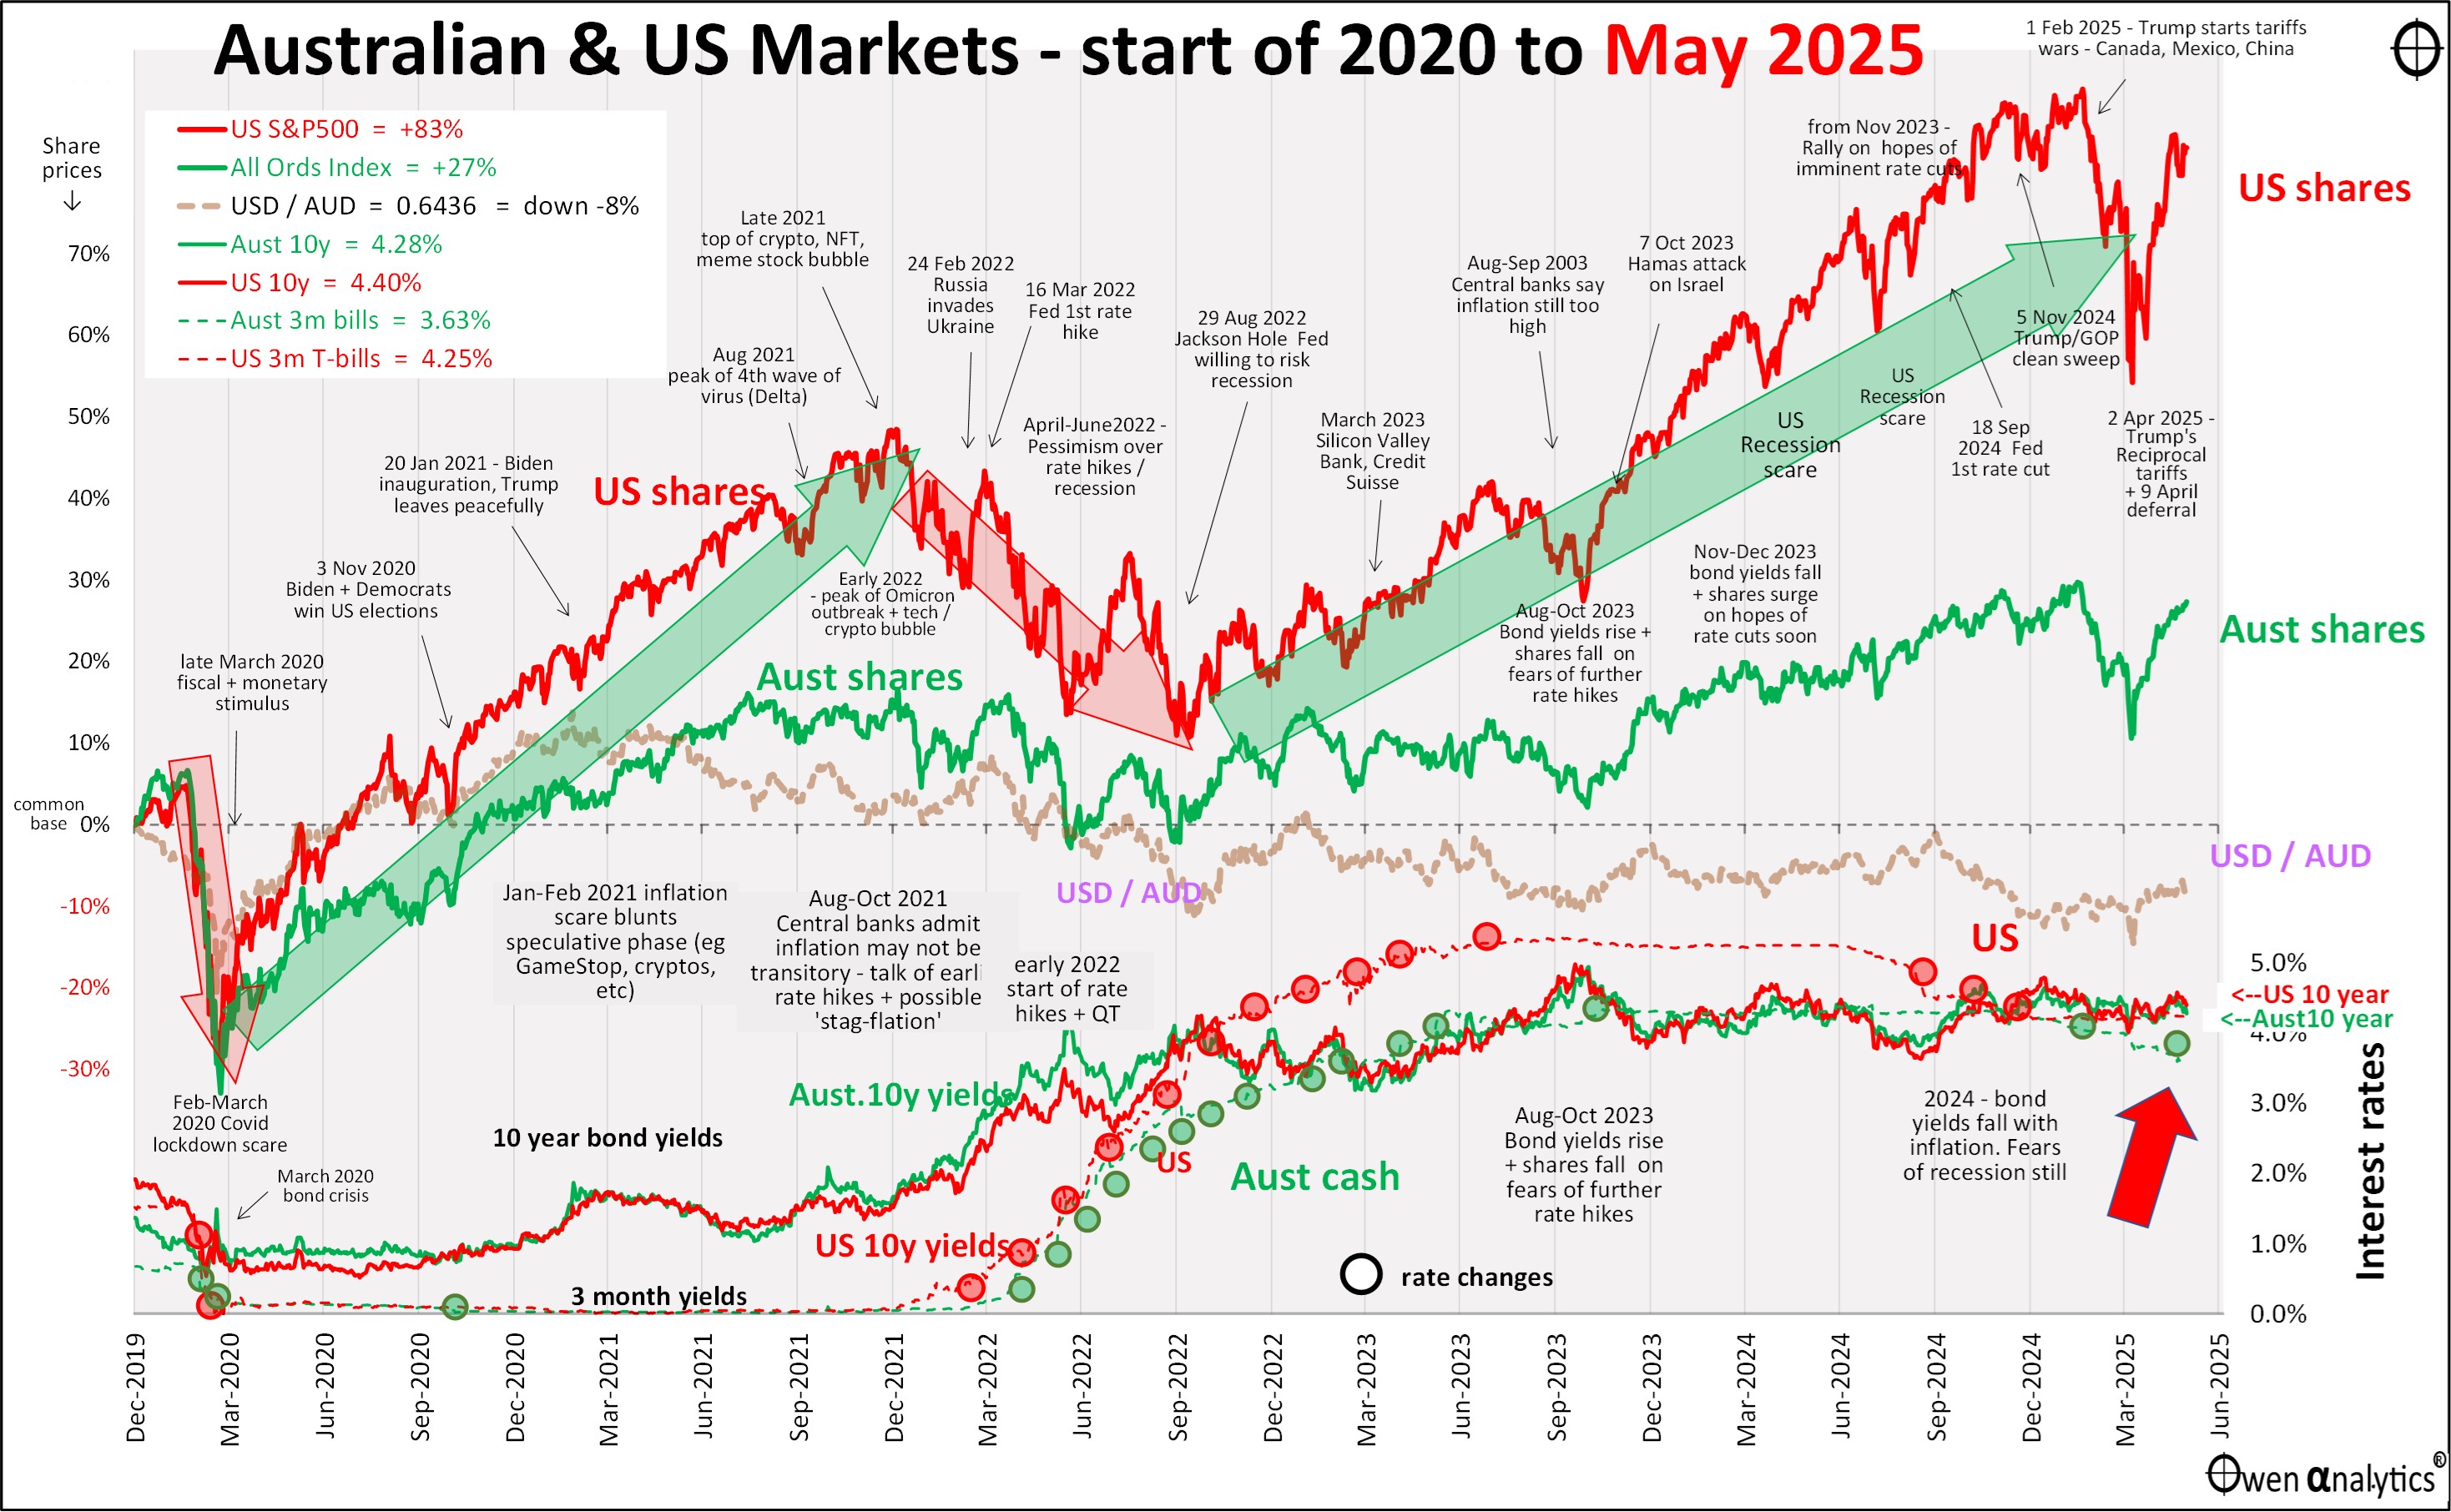
But first - my essential 1-page snapshot chart - covering Australian and US share markets, short and long-term interest rates, inflation, and the AUD/USD exchange rate. As usual, there are two versions – first is the traditional version on a single chart:
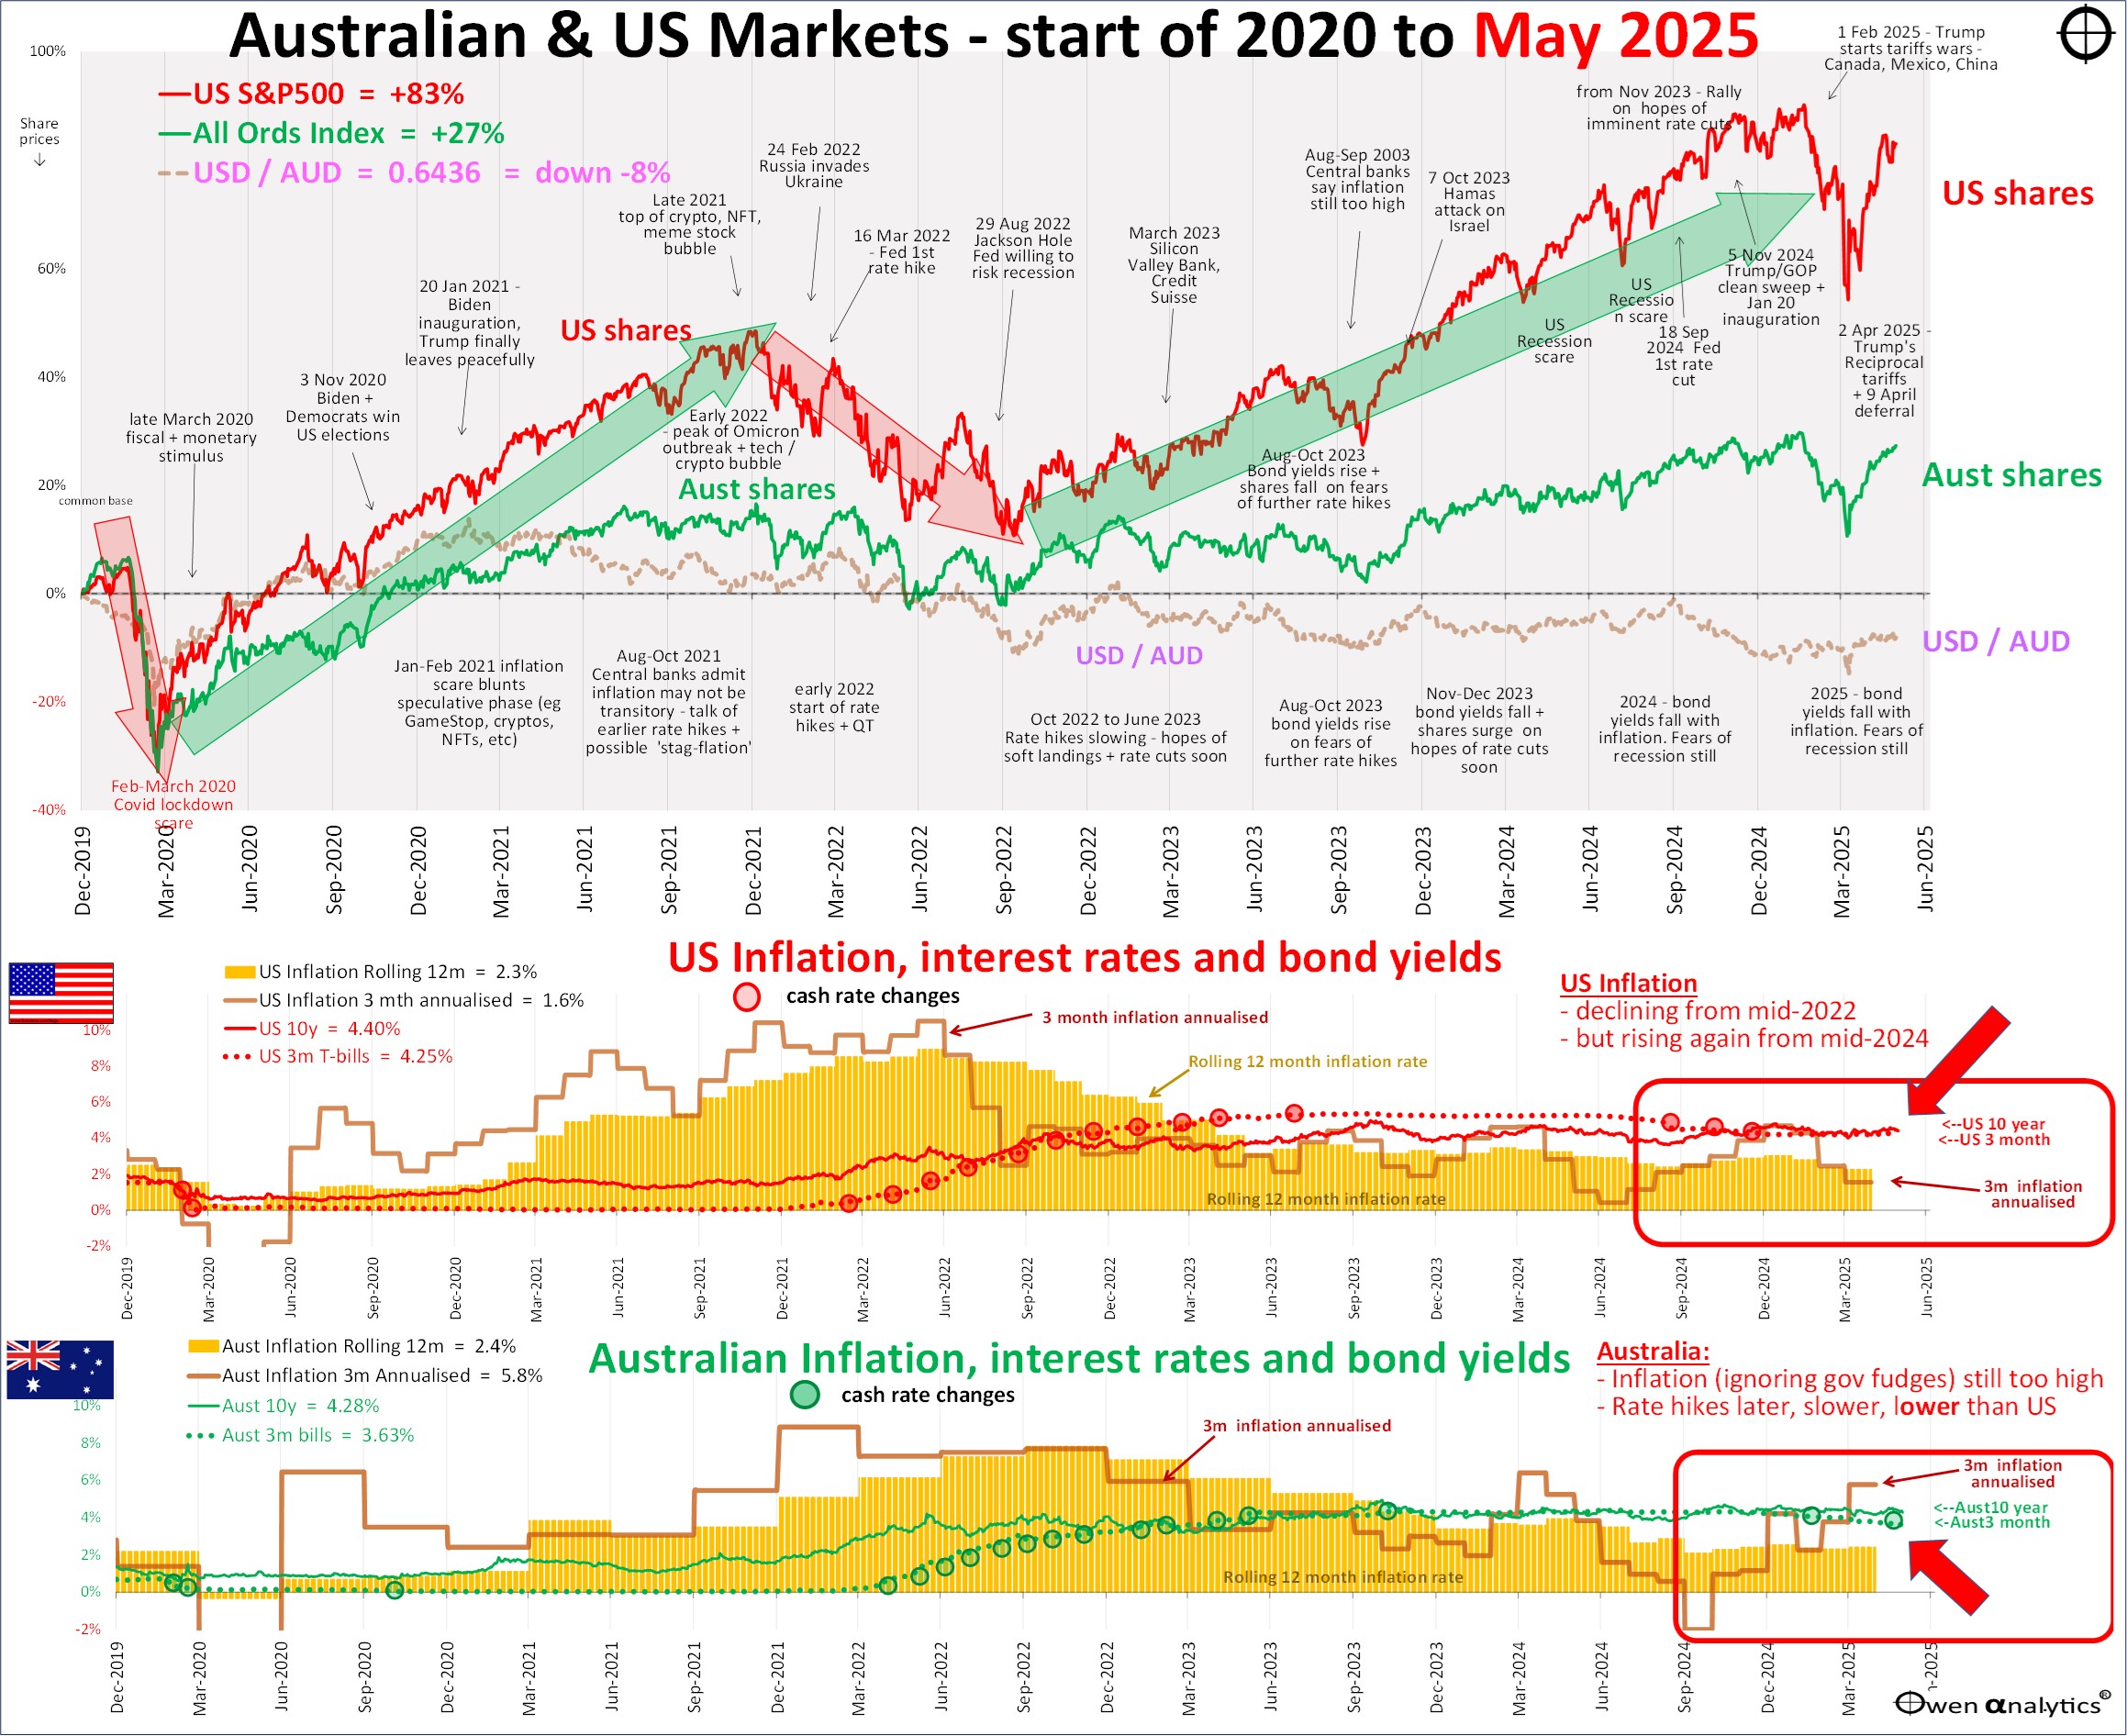
Plus the alternate version below, requested by several advisers - showing Australian and US inflation separately in the lower sections (I deal with inflation in greater detail below):
Share markets were up across the board in May, and back near their all -time highs again.
Share markets in May
Share markets had a very strong month in May after three negative months. As a result, most global markets are back to around square for the 2025 calendar year.
When share markets fell sharply in April when Trump announced his ‘reciprocal tariffs’, I did not ‘buy the dip’, but nor did I panic sell. I just held current positions in portfolios – boring I know!
Here are my articles written at the time:
For the 2024/5 financial/tax/Super year, even if June is flat, we are looking at another double-digit total return year from share markets (including dividends). Not bad, given the unusually high level of drama over the past 12 months!
Industry Sectors
All global industry sectors were up in May except Health Care, which was dragged down by Ely Lilly (Novo Nordisk’s GLP-1 rival), and US health insurer United Health’s ever-expanding litany of problems.
Major stocks
Here is the picture for the major global stocks (all of which are US based):
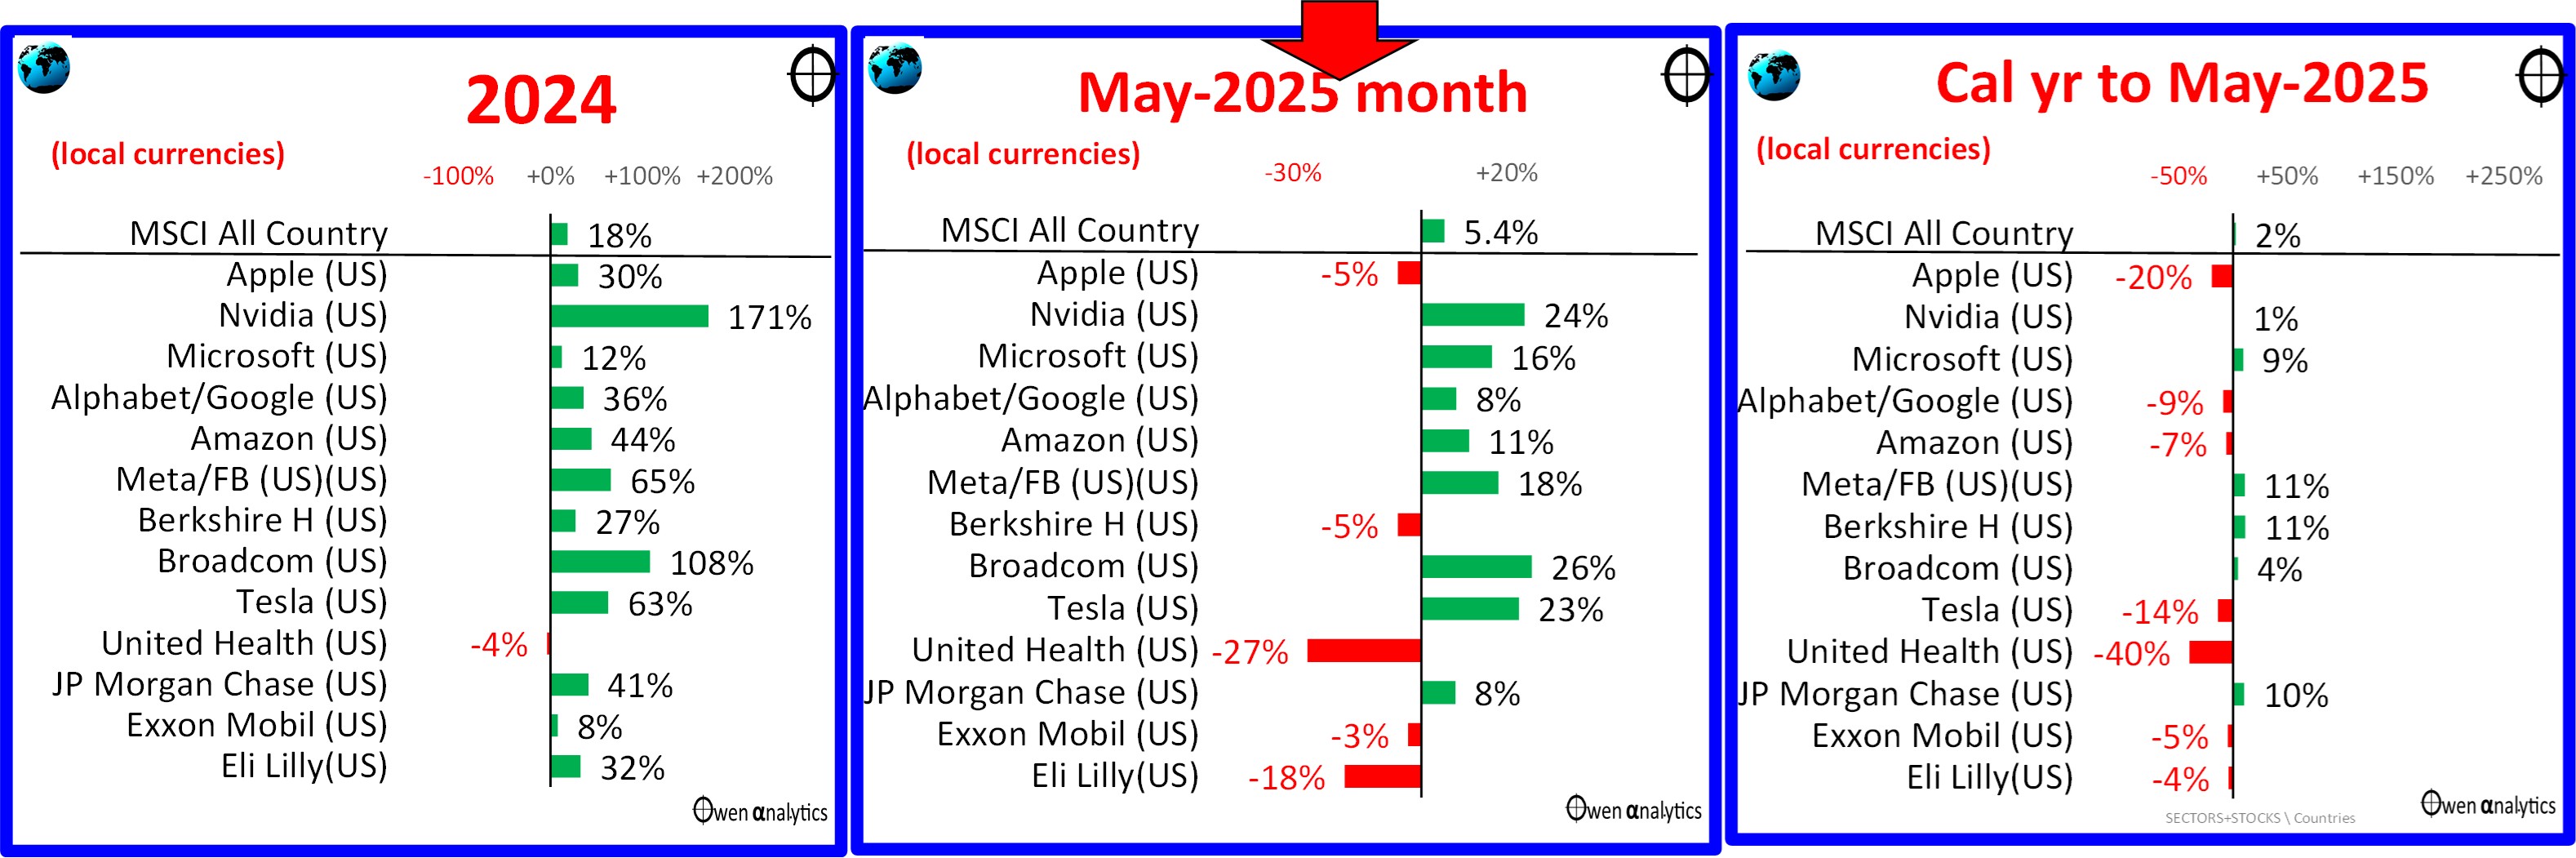
After the strong gains in May (middle chart), Most are back near square for the year to date (right chart).
For context, here are the share prices of the so-called ‘Magnificent Seven’ stocks over the past decade (plus China’s Alibaba and Tencent)-
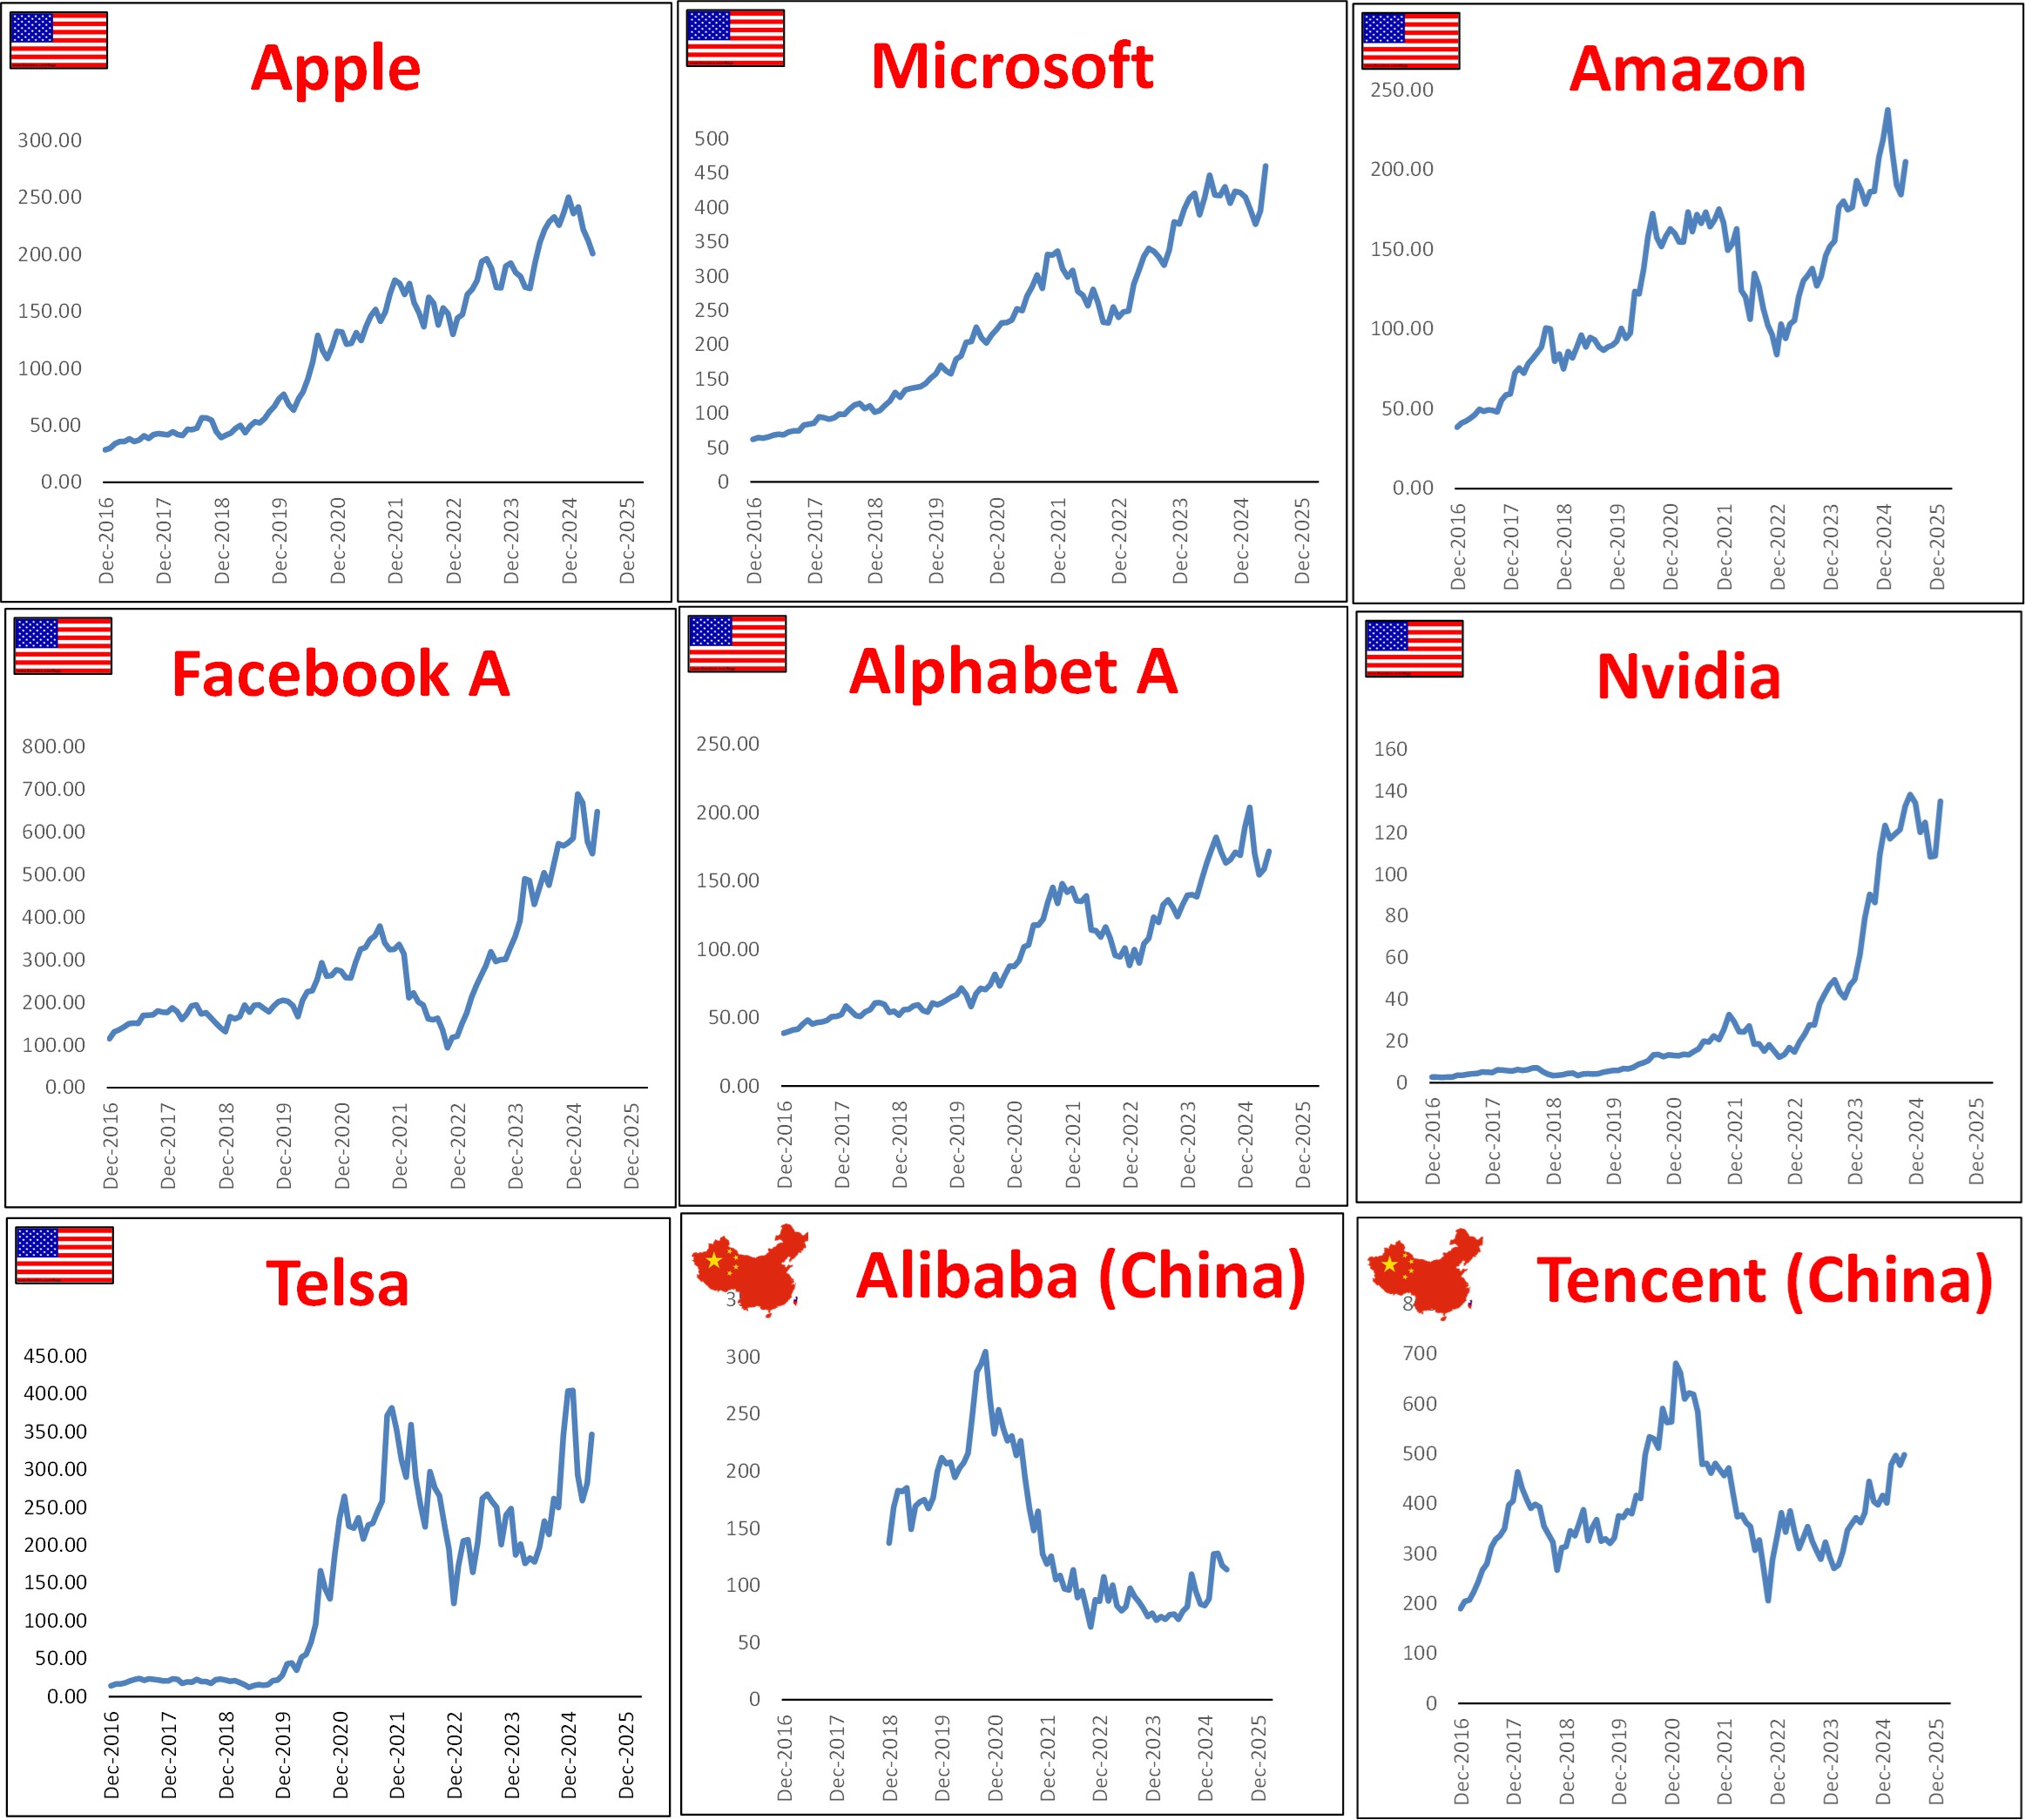
There is no Y-axis scale trickery going on here – the vertical y-axes all start at zero and have regular, nominal scales, highlighting their explosive growth of the US giants from very low levels in the past decade.
Only Microsoft hit new highs in May. China’s Alibaba and Tencent were up strongly in the Chinese rally this year, but are still well below their 2021 peaks. By comparison, all of the US majors are well above their previous peak in the 2021 Covid stimulus boom.
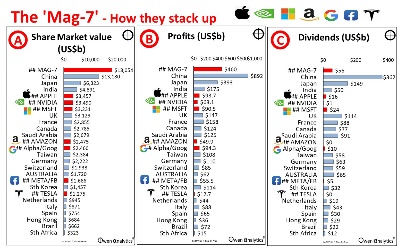
The US tech giants are still very expensive on a range of metrics. See my recent report on how they stack up individually on revenues, profits, dividends, and pricing -
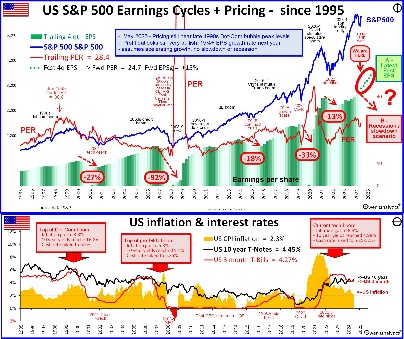
Profits and Pricing
In the March quarter reporting season (wrapped up in April-May), S&P500 companies posted good earnings growth of +13% for the past 12 months, following decent +9% growth in the previous 12 months.
Consensus forecasts for the next two years have been cut over the past month (tariff impact fears), but they are still forecasting an acceleration of earnings to +15% growth in calendar 2025, plus another +15% growth in 2026. That’s still incredibly ambitious.
The problem is that S&P500 pricing is a very bullish 28 times trailing (past 12 months) earnings, and 25 times next year’s ambitious earnings forecasts. These are very optimistic multiples on very optimistic, accelerating earnings outlooks – a double layer of over-confidence, and highly vulnerable to negative shocks.
But so far, investors have shrugged off Trump’s tariffs, a negative quarter of US real GDP, and also Moody’s credit downgrade. Are US company earnings and investor optimism invincible?
For my full story on US profits and pricing – see:
Major country share markets
The May rally lifted nearly all of the major markets into positive territory for calendar 2025 (right chart below):
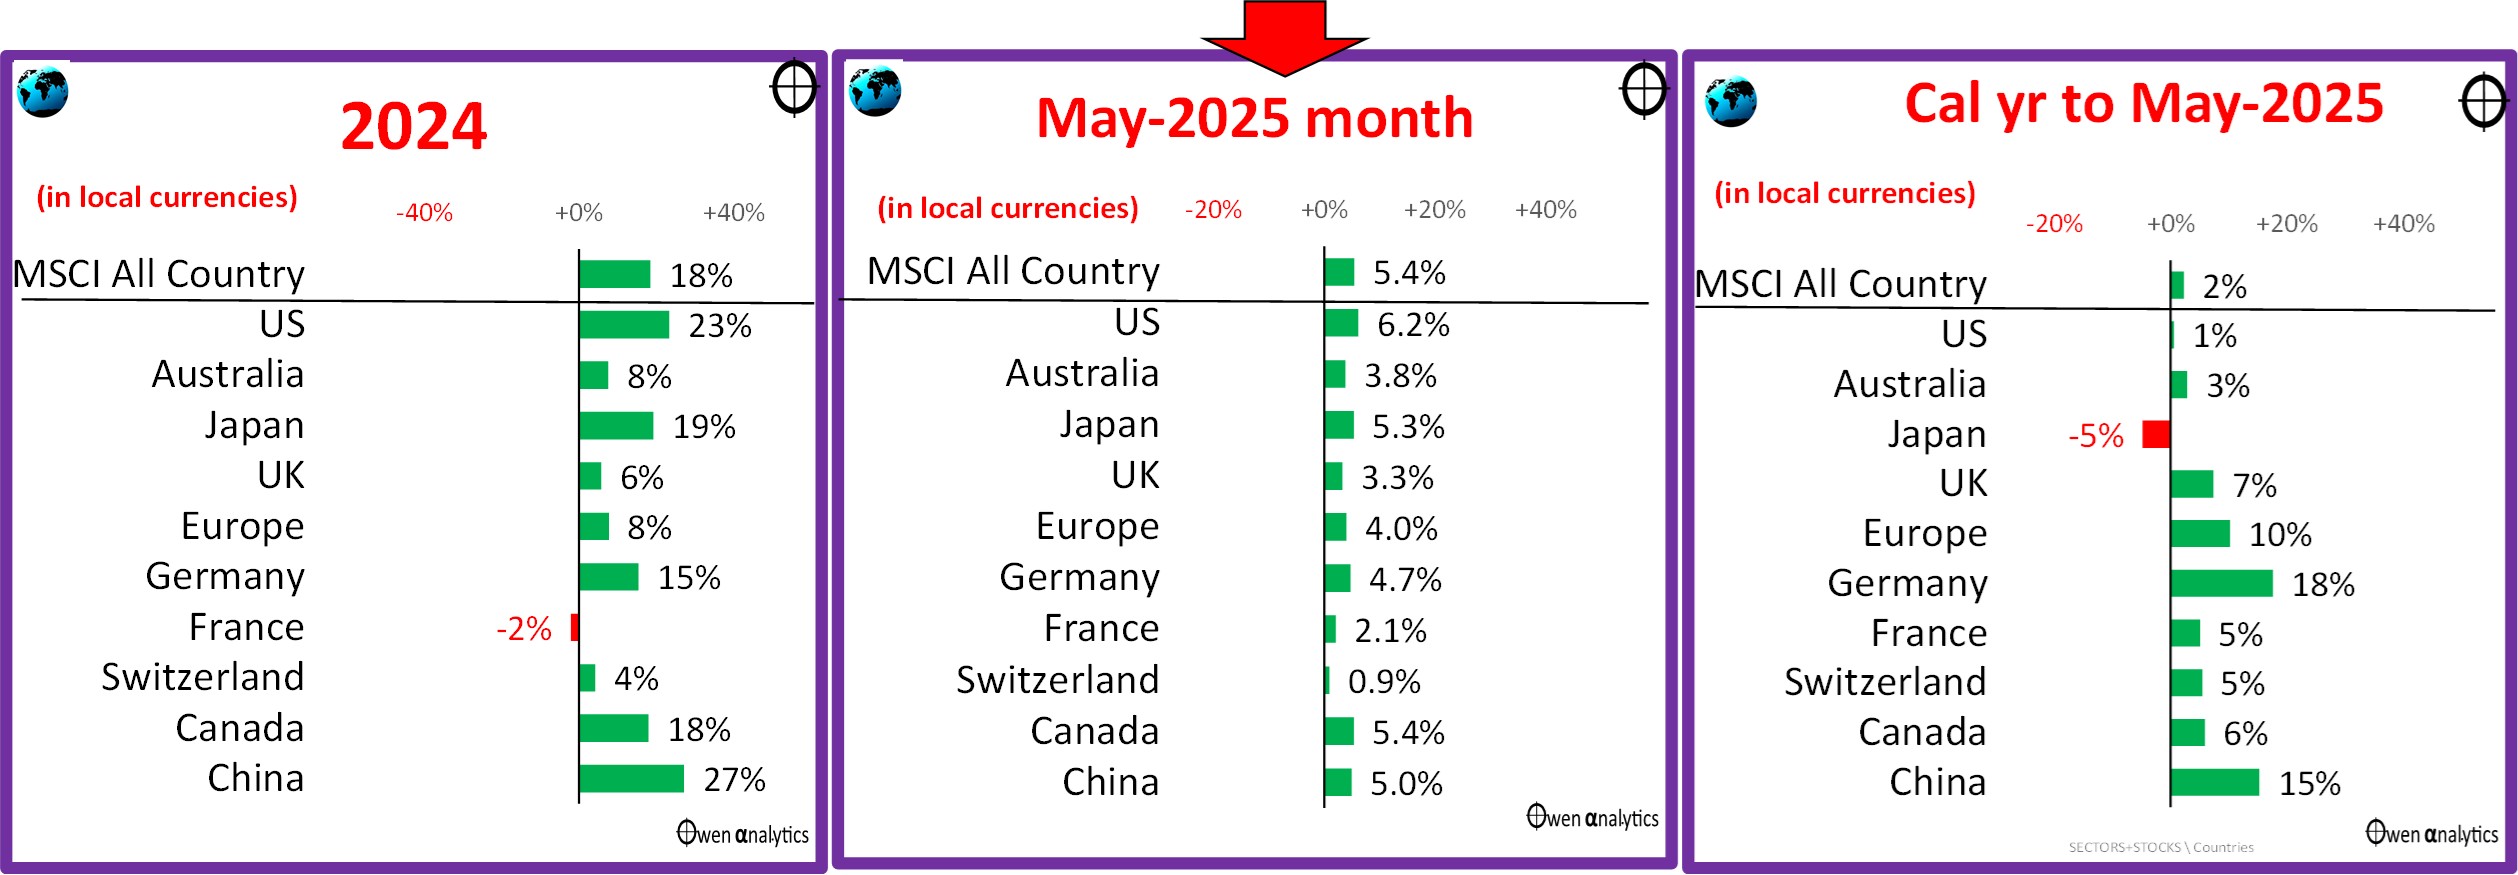
Japan is the exception (albeit after very strong years in 2023 and 2024), mainly due to falls in Softbank (stacked with over-priced tech holdings), and Toyota (tariff fears), plus also the rising yen.
Germany is the star so far this year – with gains in industrial giants like Bayer, Siemens, plus Allianz (insurance), and SAP (software).
China is also up this year - led by Alibaba and Tencent. Chinese shares have enjoyed a rally this year, for two main reasons. The first is Xi Jinping welcoming previously exiled tech oligarchs back into the fold. Xi suddenly realised he needs them for China to dominate world markets in new high-tech industries like ai, surveillance tech, EVs, solar panels, wind turbines, etc. (Whereas Trump loves his billionaire buddies, Xi philosophically detests and despises China’s billionaires, but he tolerates them as a necessary evil).
The second factor is the re-capitalising six of China’s state-controlled banks, to allow them to boost lending in an effort to stimulate China’s stalled economy, plus additional measures to support the economy with US tariffs likely to hit export industries.
Investors are beginning to see that the US needs China more than China needs the US. China is looking like having the upper hand against Trump.
Australian shares
The local share market was up with the rest of the world in May (middle chart below). Here are the main stocks:
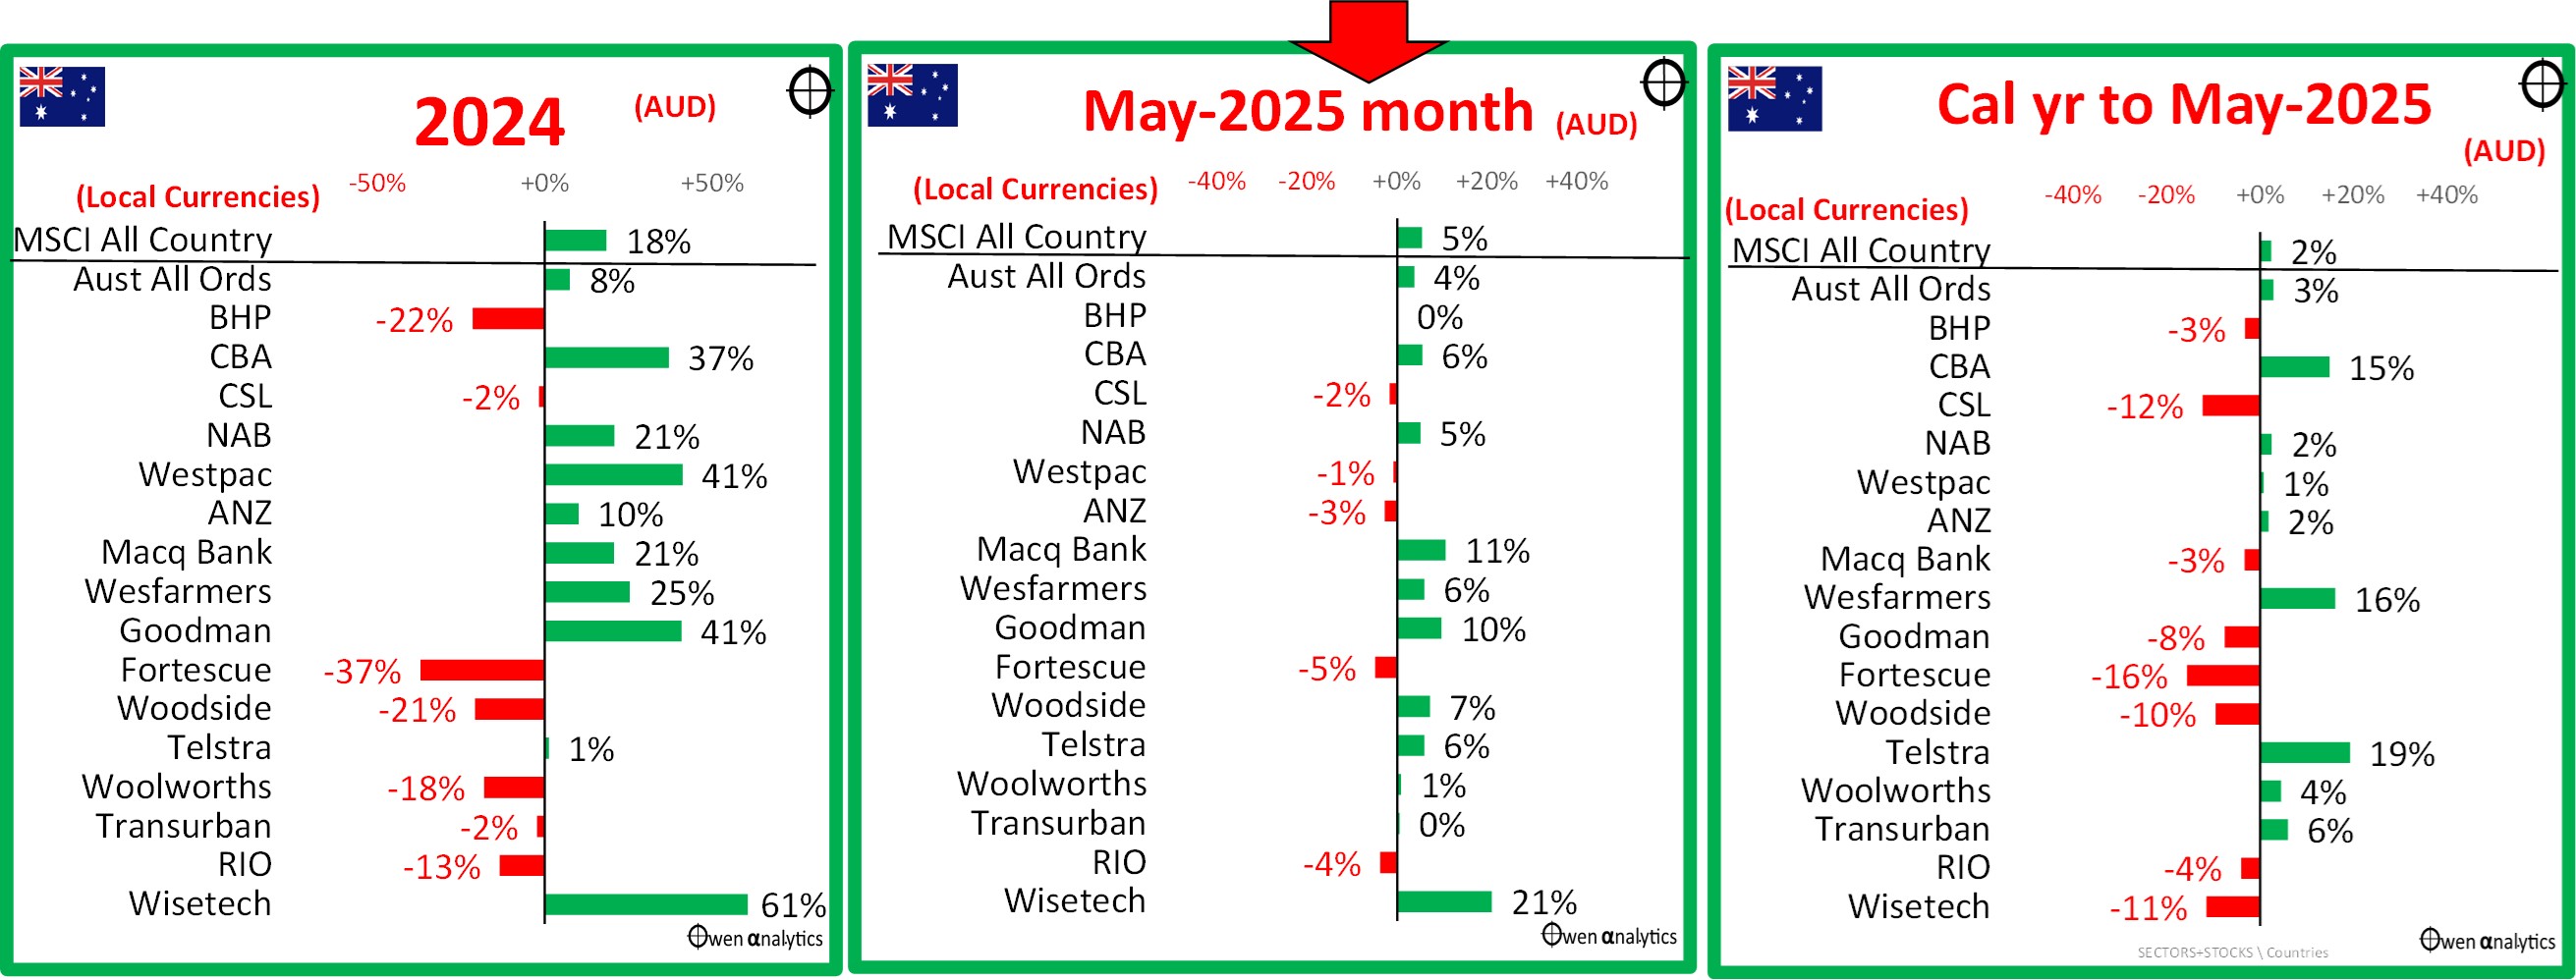
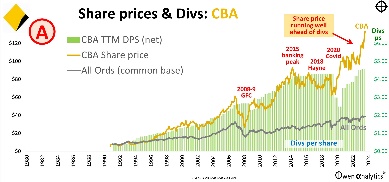
The stars this year (in share price terms anyway) have been CBA and Telstra – for mysterious reasons. They are hardly growth stocks – they are the opposite of growth. CBA’s earnings per share and dividends per share have been going backwards in real (inflation-adjusted) terms for a decade. Telstra’s earnings per share and dividends per share have been going backwards for the past 25 years, not just in real terms but in nominal dollar terms as well! Shareholders seem happy to keep bidding up the share prices of these decaying dinosaurs!
For my take on CBA see –
The other share price star this year (Wesfarmers) at least has some growing businesses (Bunnings, Officeworks).
The big miners are in the doldrums due to weak iron ore prices, although Chinese demand appears to be holding up reasonably well. Woodside and Santos had regulatory wins (new fossil fuel projects approved, finally), but they are facing weak oil/gas prices. Wisetech, still plagued with a debilitating founder/board battle, announced another acquisition, and CSL is still having problems with Vifor and US tariff impact concerns.
Inflation & interest rates
First, to the US market because the US drives all global markets including the ASX. After three rate cuts in September, November and December of 2024, the Fed hit the pause button and said they are in no hurry to cut rates further.
The 12-month inflation rate to April is 2.3%, but the annualised 3-month annualised rate is down to 1.5% pa, which is encouraging. However, the Fed’s preferred measure, Personal Consumption Expenditure (PCE) is still above target and is showing no signs of returning to target.
On top of that, the US jobs market remains surprisingly strong. The unemployment rate rose from 4.1% to 4.2% but is still relatively low. Here is the US picture:
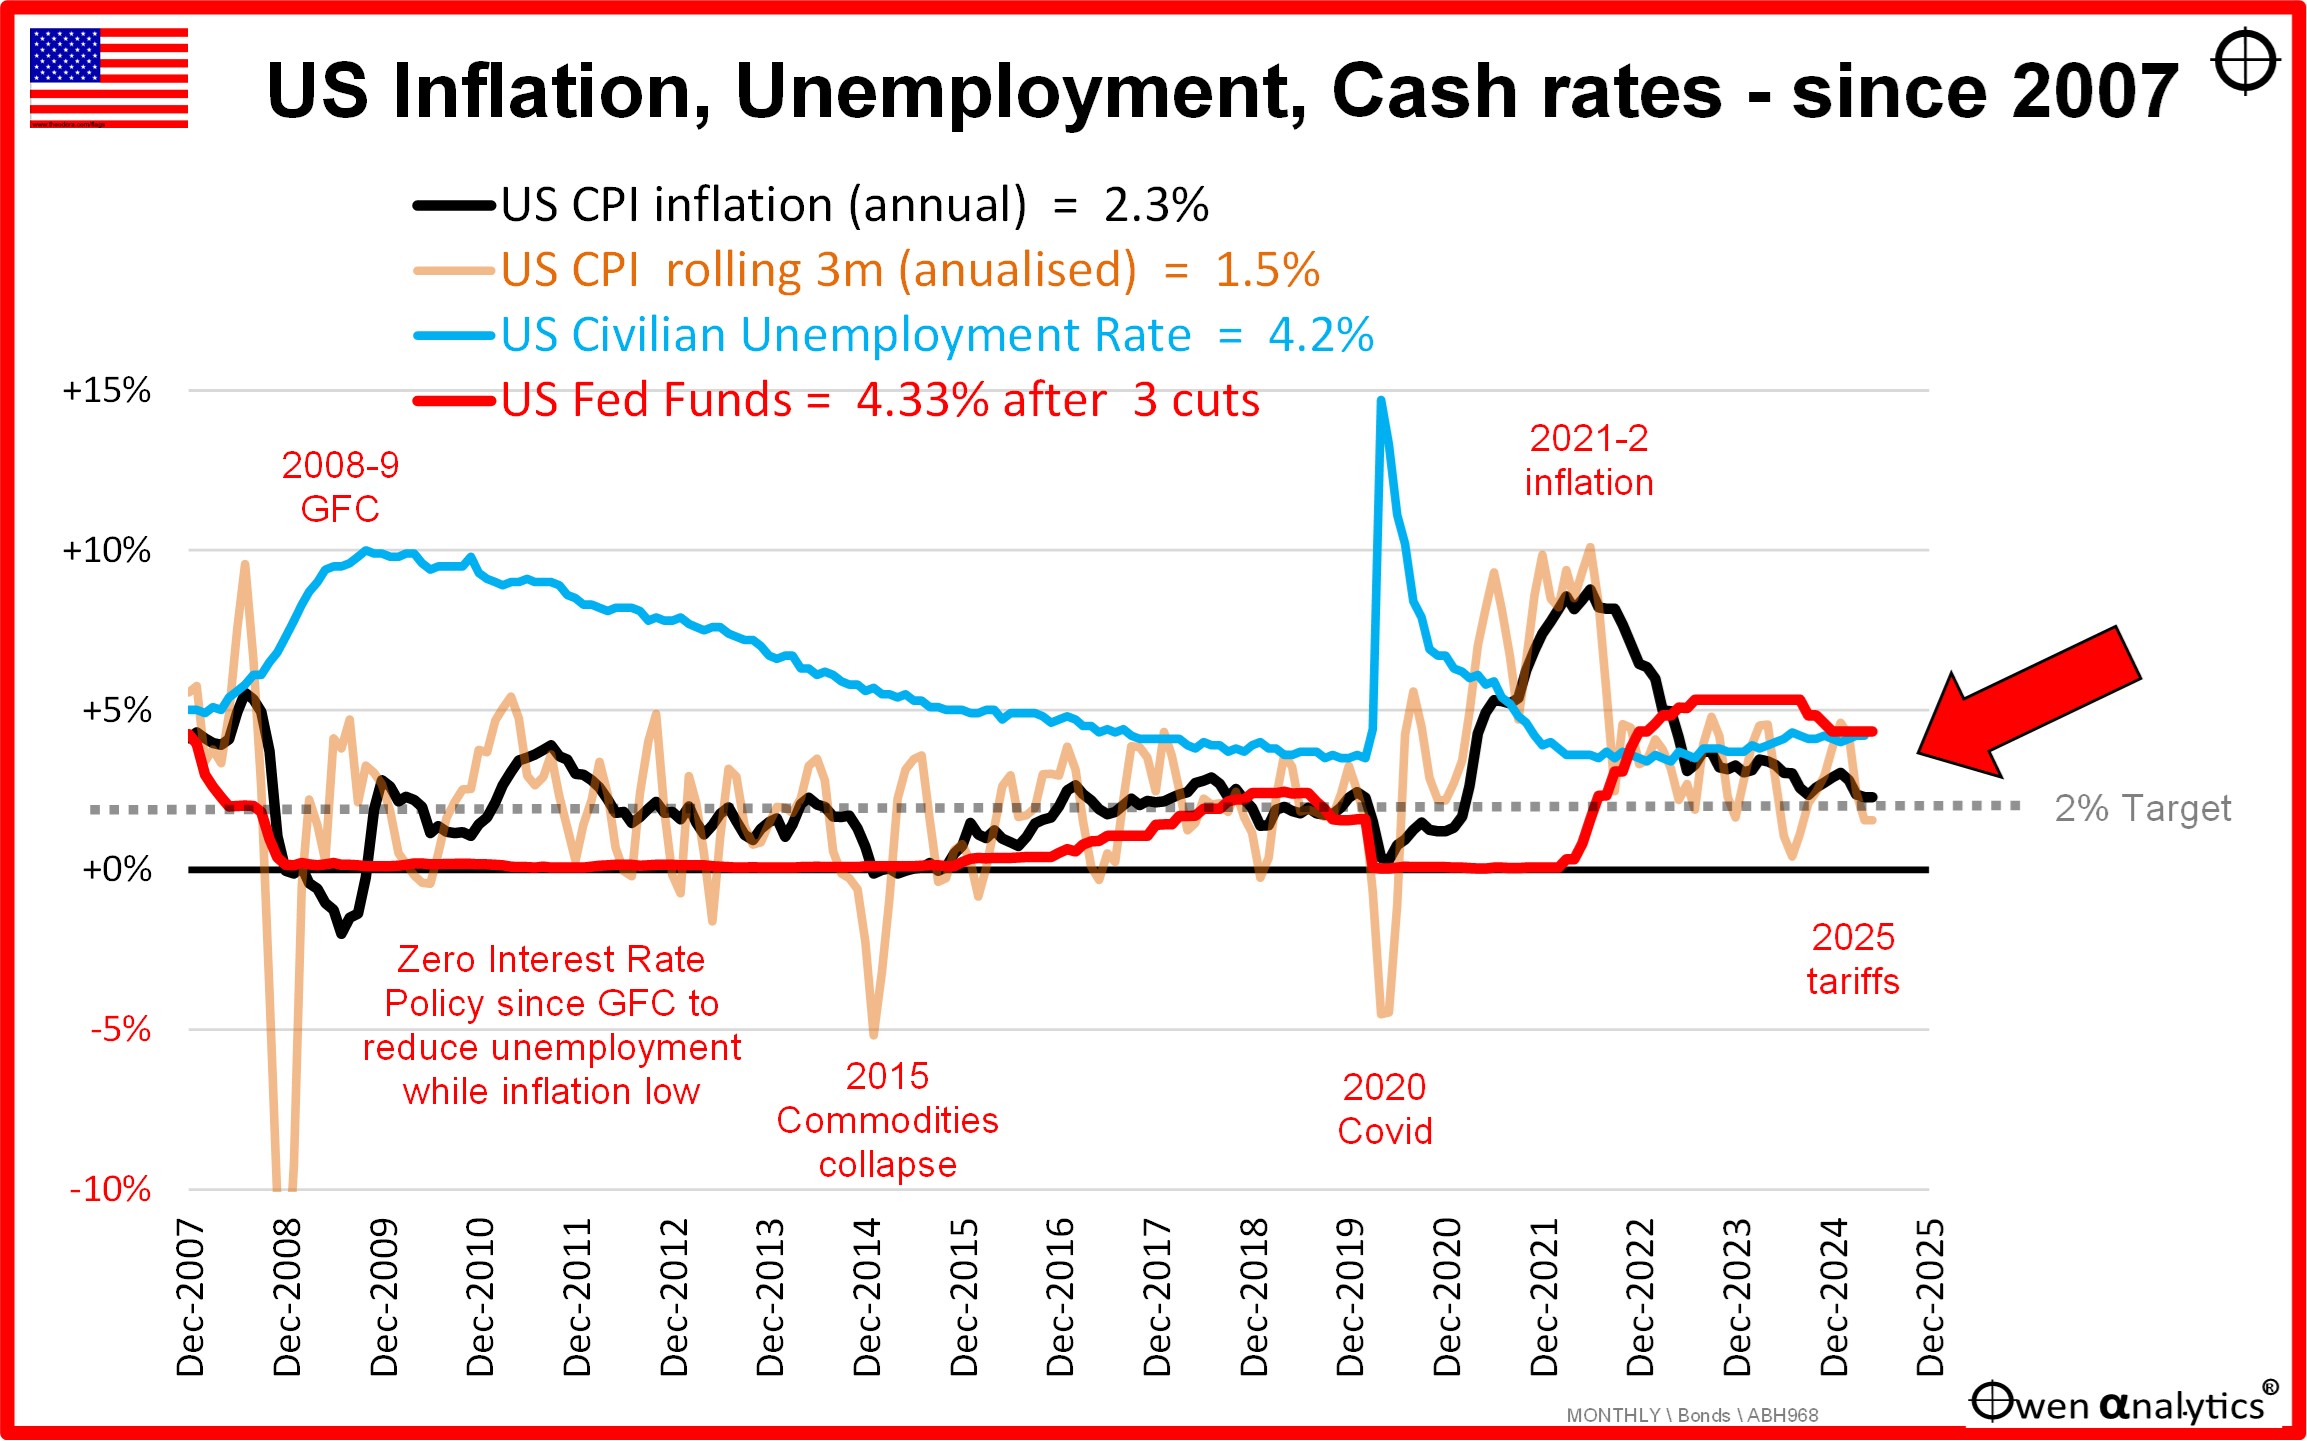
Fed chair Jerome Powell initially suggested that tariff-induced inflation in the US may be ‘transitory’, but he has since expressed concerns it may not be that simple after all.
(One would have thought after his unfortunate ‘transitory’ comments in 2021, that he would have banished the word to the dustbin of history, and also banished it from his personal vocabulary. In 2021 he was caught napping when he dismissed rising US inflation as ‘transitory’. It wasn’t, but he let it shoot up to 8.8% before belatedly admitting his error and switching to attack mode with rate hikes in 2022.)
The world waits with bated breath to see just how ‘transitory’ the Trump tariff inflation turns out to be. Our base case TACO scenario (Trump Always Chickens Out) is that tariffs rates will mainly settle at somewhere between 5% and 10%, with lots of exemptions and side deals, so the impacts will be much less than initially feared.
The worst case scenario would be that tariffs slow spending, output, and employment, but the Fed is unwilling to cut rates (which is the usual stimulatory tool in recessions and slowdowns) because inflation remains high - the nightmare ‘1970s stagflation’ scenario.
Tariffs -v- inflation
It is important to understand that a one-off increase in prices due to tariffs (or other taxes) is NOT inflationary. For example - the one-off rise in Australian consumer prices across the board due to the introduction of the 10% GST in 2001 was NOT ‘inflation’. A rise in CPI does NOT equal ‘inflation’.
It is highly likely that Trump had his sights set on a 10% tariff across the board (like Alexander Hamilton in 1792), and if this is where it ends up, a one-off tariff hike of 10% is not ‘inflationary’.
Why? Price rises due to taxes like tariffs only become ‘inflationary’ if they lead to a sustained ratcheting up of prices via retaliatory tariff hikes or wages. Central banks are not worried by one-off price rises. They are worried if the price rises turn into an upward spiralling of prices. The problem is that price rise spirals can quickly get out of control and change consumers’ expectations and spending patterns.
US Economy contracts in the March quarter
The US economy posted a contraction in the March quarter 2025 – by just -0.07%. Real GDP contracted by a miniscule $16b in the quarter, which is insignificant compared to an increase in annual real GDP of $2.5 trillion over the previous calendar year (2024 growth over 2023). The contraction was not caused by lower spending; it was a surge of imports as US importers scrambled to get stuff into the US before the tariffs hit.
Markets rightly shrugged off the March quarter 2025 GDP contraction, but attention turned to the twin problems of US government deficits and debt. A major event during May was Trump’s ‘Big Beautiful Bill’ (full text here) – which mainly gives tax cuts to the rich and cuts spending on services for the poor. It passed the House, so we will now see how it goes in the Senate. It is certainly testing some Republicans’ resolve.
Credit ratings agency Moody’s was already becoming increasingly concerned with US deficits and debt build-up, and it cut the US government’s credit rating from ‘Aaa’ to ‘Aa1’ on 16 May. Recall that when the other main credit ratings agency S&P stripped the US government of its ‘AAA’ rating in August 2011, that marked the start of an almighty rebound and multi-year rally in US shares. Credit rating cuts are strangely often a trigger for share market allies, not crashes – and the same has been true over the years for other countries including Australia and the UK.
Australian inflation, interest rates, unemployment
Australian inflation also remains problematic, but for different reasons. The RBA has only made two cuts in this cycle (including one in May), while most other countries have made several more cuts as inflation has edged down.
Here is the Australian picture:
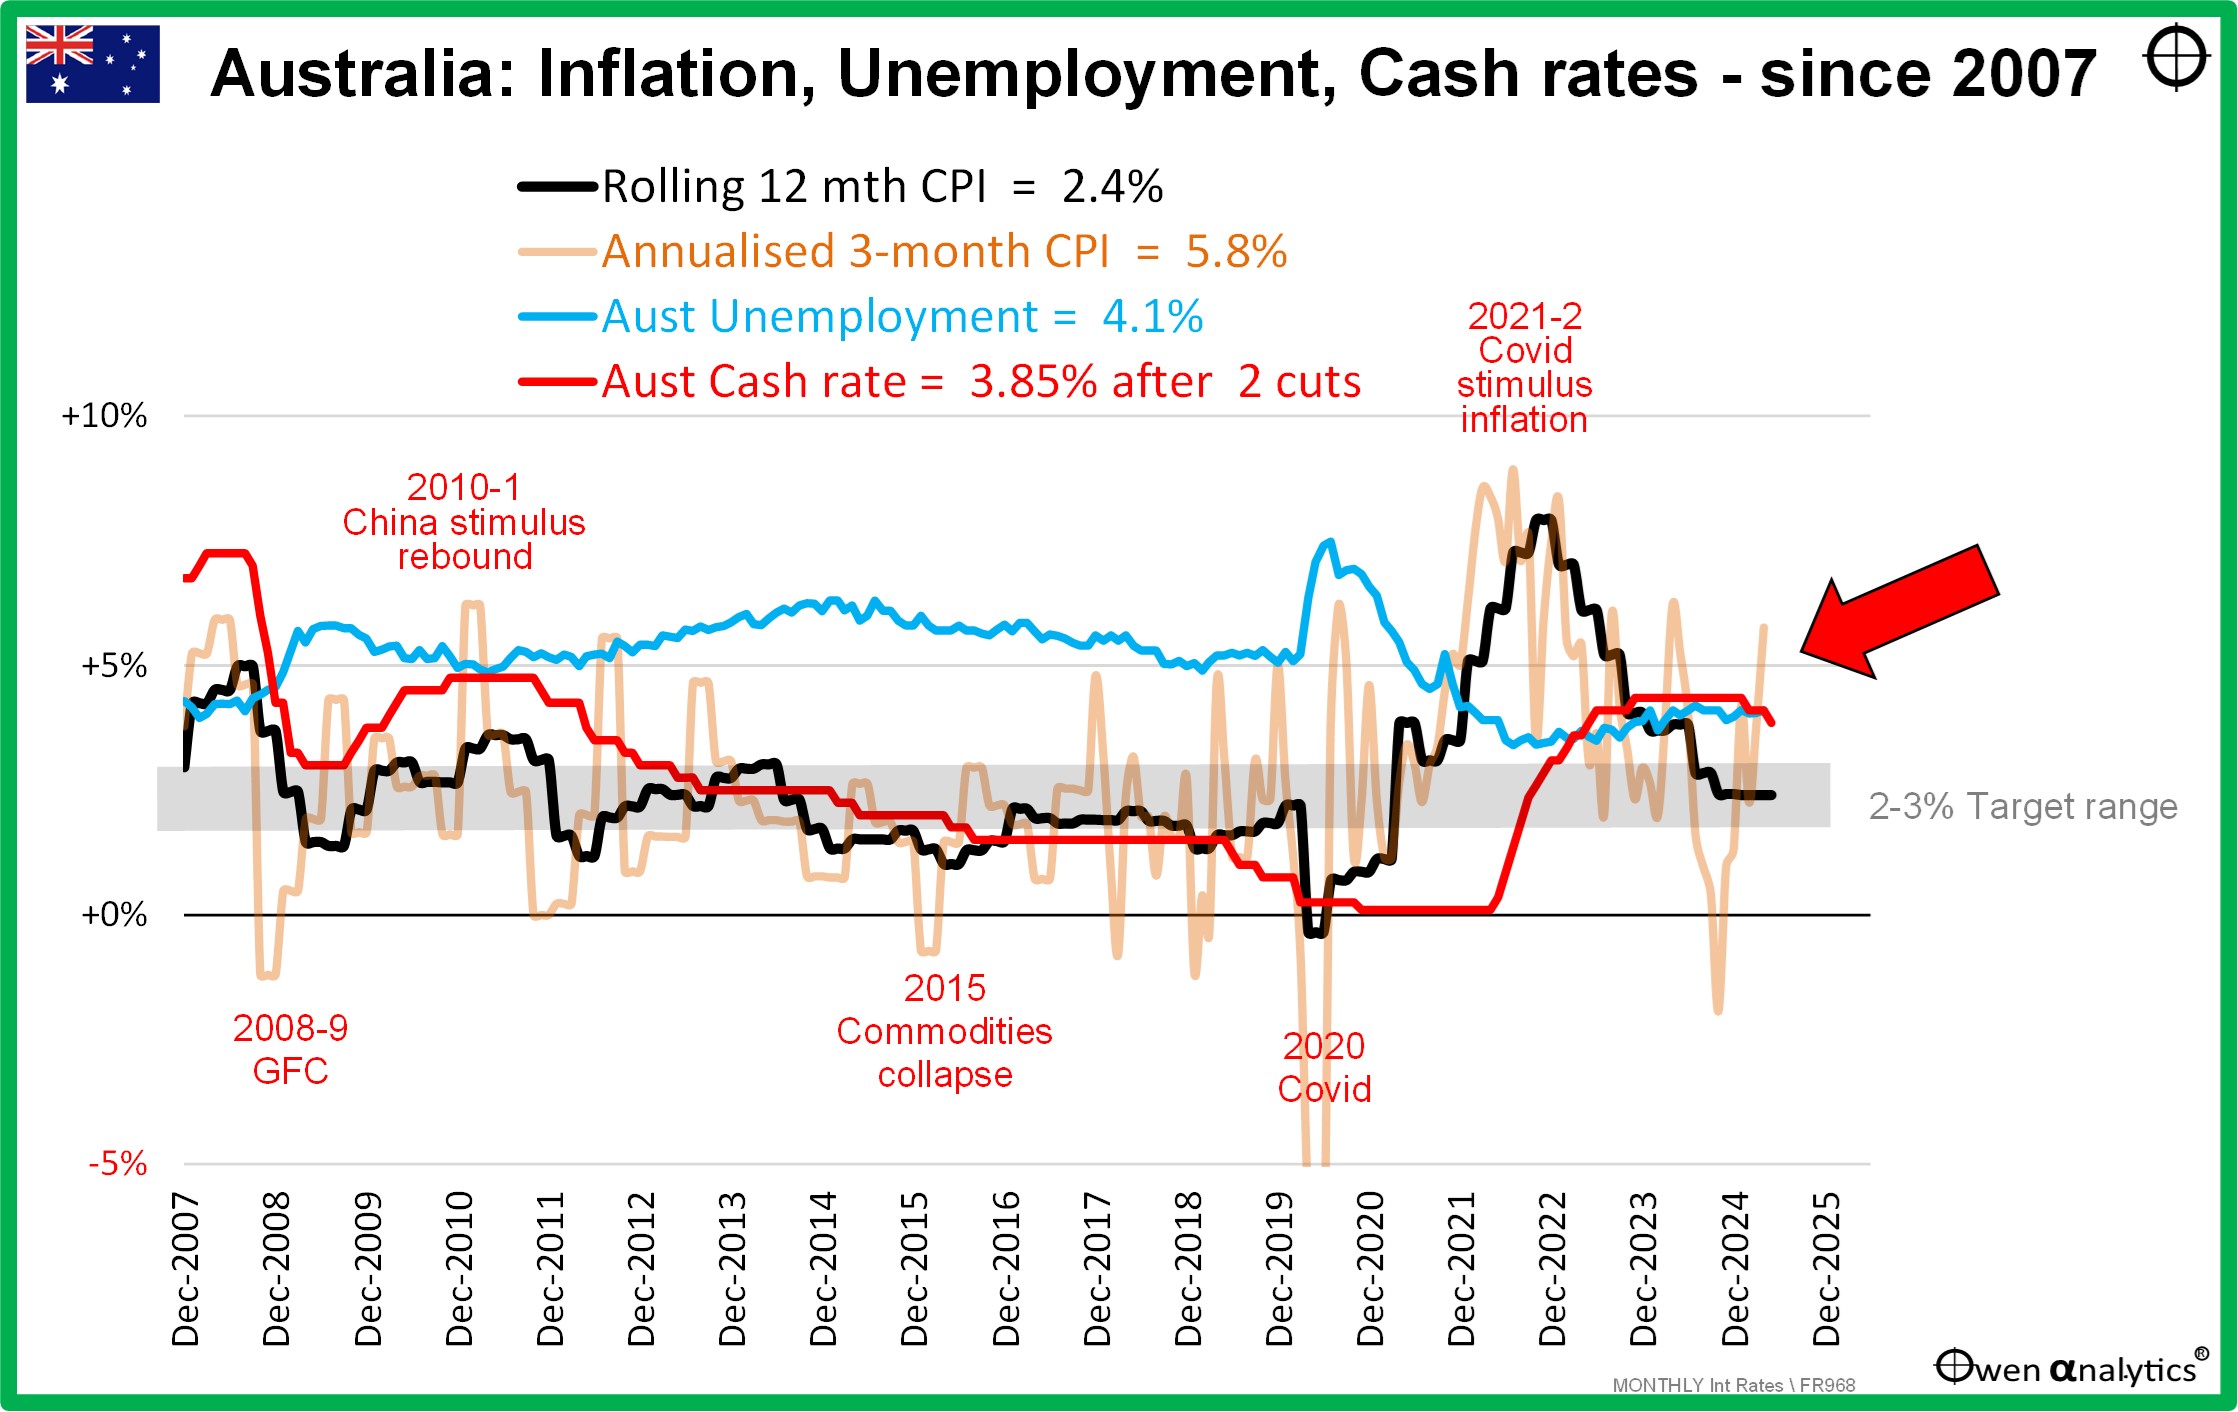
The 12-month CPI inflation is still running at 2.4%, but the annualised 3-month rate has increased to 5.8% pa, and the RBA’s preferred ‘trimmed mean’ measure is still stuck at 2.8%. However, these numbers are still being artificially depressed by temporary government power and rent subsidies, and the RBA has made it clear it is not being fooled by Smiling Jim Charmers’ trickery.
As in the case of the US, the most obvious motivation for rate cuts would be a local recession, which would lift unemployment and probably soften inflation pressures, allowing (or necessitating) rate cuts.
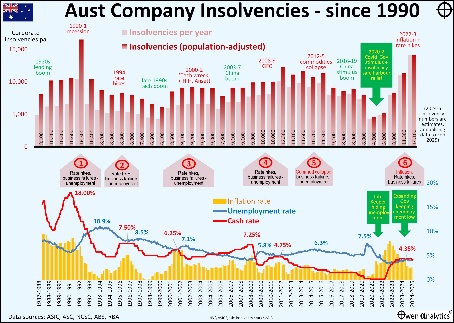
Unemployment in Australia remains a very tight 4.1%, with record ‘participation rates’ (the number of people in the workforce as a percentage of working age population), but that is almost entirely due to expansionary government hiring. The government sector has been expanding, but the real economy is doing it tough.
In the real world, business insolvencies have shot up to levels not seen since the deep 1990-1 recession. Job numbers are booming in the government sector, but business is doing it tough. See my recent report on insolvency numbers in Australia –
In summary - the government is artificially suppressing both the inflation numbers with deficit-funded subsidies and hand-outs, and it is also artificially supressing the unemployment numbers with deficit-funded jobs in the ever-expanding dead-weight, low-productivity, wealth-sapping, government sector.
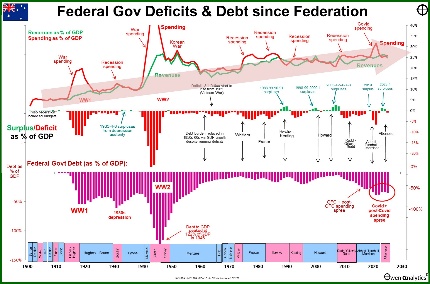
A reader asked me recently whether the ABS should report ‘private sector’ GDP and ‘public sector’ GDP numbers separately so we can see the government economy versus the real economy. I thought about that for a while, and my answer was that the government already thinks that the government IS the economy. Bottom line – we are in a state-directed, quasi-socialist economy, at Federal and State levels. There is no thought (or policy) of ever trying to ‘balance the budget’ – ever. Push that out for the next generation of taxpayers to worry about!
Check out my recent story on the history of Federal government deficits and debts in Australia –
Commodities
On the commodities front - oil is back above $60 per barrel, but iron ore is still below $100 per tonne, and battery metals are still in chronic over-supply, with more Chinese production hitting the market, and weak demand.
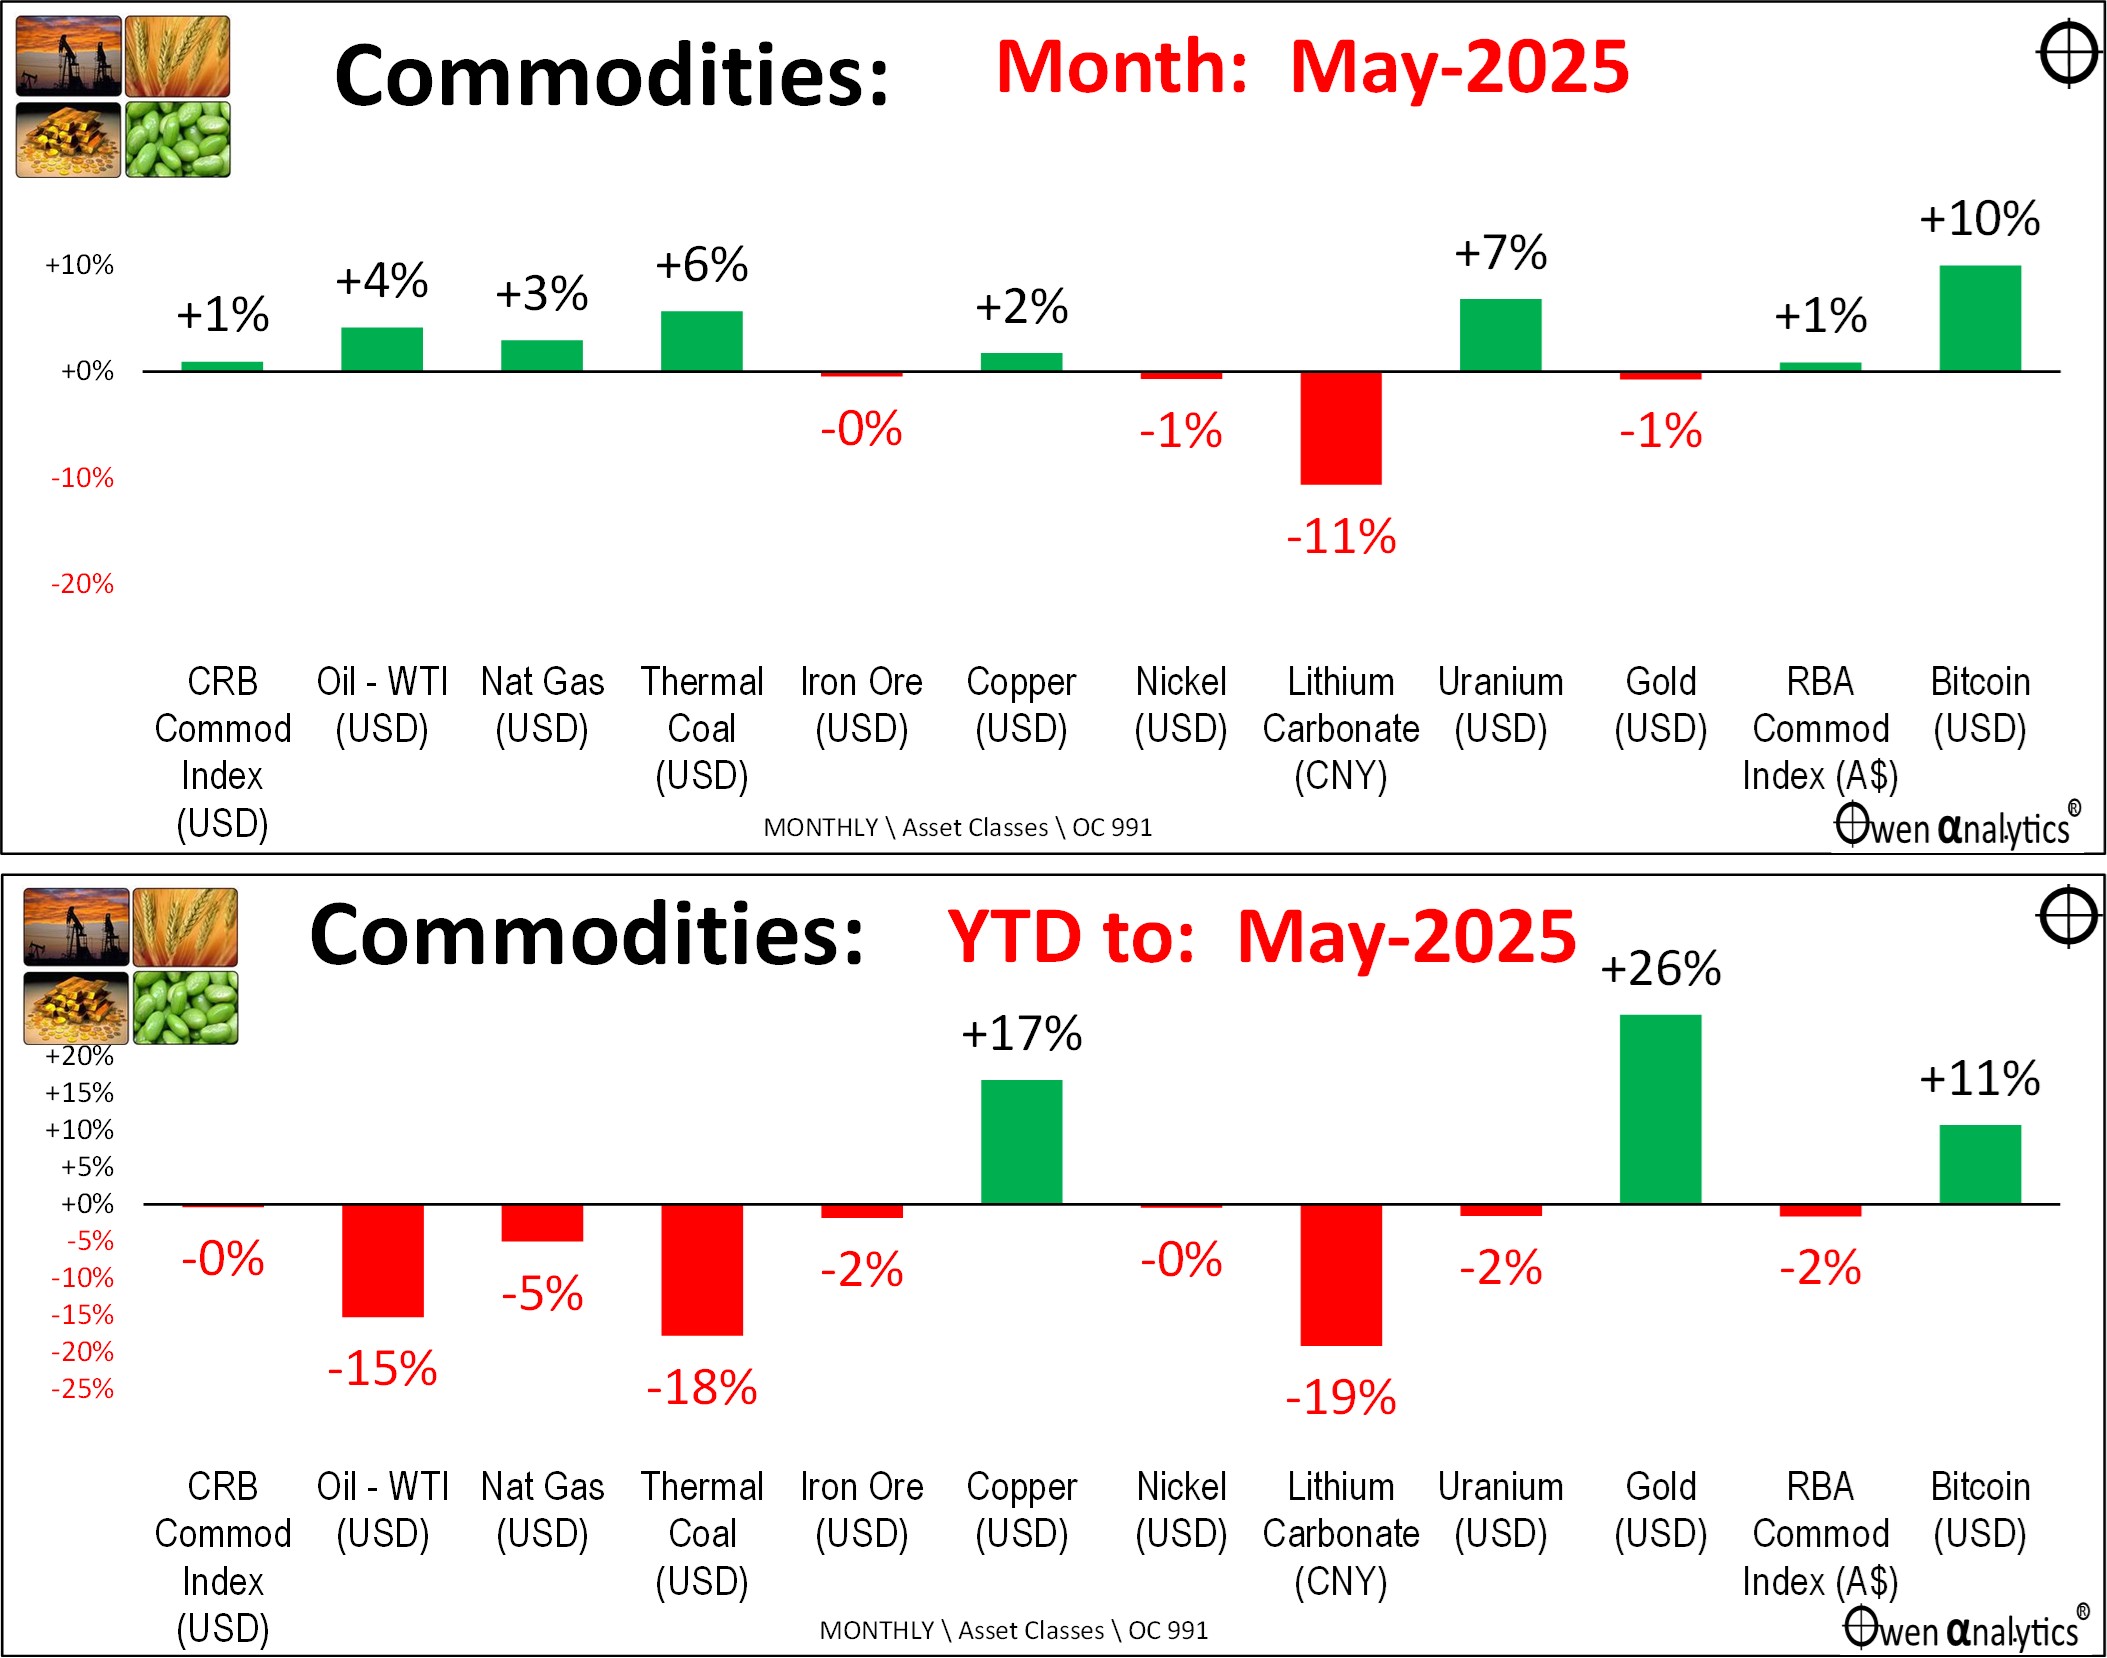
Year to date (lower chart) – all are down except Copper, which has spiked this year, mainly due to a frenzy of buying in advance of Trump’s tariffs, plus gold. . .
Gold
Gold is still the standout in the current environment. The gold price has been boosted by strong buying from central banks (terrified by the thought of US seizure of US dollar assets, as US did to Russia after its invasion of Ukraine). Also, Chinese nationals have been strong buyers of gold (after the collapse of the Chinese property market).
I put gold into diversified portfolios last year (including my own long-term ETF portfolio I publish), preferring the un-hedged AUD ETF version, so we get benefit of the falling AUD as well as the rising gold price.
But that does not mean readers should rush out and buy it now, of course! Every year we face a whole new set of challenges.
Bitcoin (right end of the charts) was also up in May, finally exceeding its peak on 11 January, Trump’s inauguration day. What of the future – who knows?!?!?
‘Till next time – safe investing!