Key points:
-
-
- The US stock market has had 31 ‘dips’ of -10% or more since 1900. We look what happened in each case if you ‘bought the dip’.
- In most cases, a 10% dip turned out to be just the start of a much larger fall (a further -15% fall on average), and for a much longer period (more than a year of further falls on average).
- Overall, buying the dips resulted in below-average returns over subsequent 1, 3, and 5-year periods from the buy-in price.
- However, there were several occasions when buying the dip resulted in above-average returns.
- Where are we now? How does today’s market compare to prior dips?
I’m sitting on a fair bit of cash at the moment (actually high-grade floating rate notes), because share markets have been super expensive in the current tech/ai boom. But we have now had a nice little mini-correction – so I could ‘buy the dip’ (a very common strategy advocated by investors and advisers here and around the world).
If I take advantage of a 10% discount and ‘buy the dip’:
-
-
- (a) am I trying to ‘catch falling knives’ - it’s impossible to pick the bottom, and I’m probably heading for more pain as prices keep falling?
- (b) or am I ‘bagging bargains’ - I am getting a discount below what people were happy to pay when prices were soaring before the dip, so my cheaper buy-in price should increase my subsequent returns from this point?
The case for ‘buying the dip’ (‘Bagging Bargains’)
‘Fundamental’ investors take time to do the research to understand what they are buying, and form a view of what it is worth. They aim to ‘buy on dips’ – ie wait for corrections and take advantage of lower prices when they are available, which is usually not often.
Most people do the exact opposite – they just throw money at things when (and because) prices are rising, then they panic sell when prices are falling. Humans are emotional, tribal animals, constantly seeking reassurance from the herd – so they tend to follow the herd and ‘buy high, sell low’, a sure recipe for poor returns - short-term, and long-term.
The case for holding off – even after a dip – don’t try to ‘catch falling knives’
Going against the herd and buying when prices are falling is known as trying to ‘catch falling knives’. It looks like you are trying to pick the bottom, and we all know that is impossible. You are bound to get egg on your face, and begin to doubt your decision when prices keep falling (which can result in ‘buy low – sell lower’).
As emotional animals, humans tend to shy away from falling share prices. The more prices fall, the more pessimistic people become.
Traders also don’t buy dips. Around 80% of trading strategies (including hedge funds) are ‘trend-following’ (also known as ‘momentum’). When prices are falling, they don’t try to ‘catch falling knives’. Instead, they wait until after prices start to rebound from the bottom, and then wait for the rebound to be ‘confirmed’ (usually by back-ward-looking technical signals like ‘MA’ or ‘MACD’ or ‘RSI’, etc). As a result, most traders usually miss out on the early, and usually strongest, part of the rebound from the bottom, but at least they avoid the rest of the fall on the way down.
If it were not for the crippling costs of brokerage, spreads, fees, taxes, and often-fatal leverage, trend-following / momentum strategies might otherwise be successful. Unfortunately 90%+ of individual traders and hedge funds lose money and give up / close down.
I am not a trader. I want to buy good assets at good prices. I actually like wild, emotion-driven price volatility because it makes good assets better value from time to time.
That’s enough on theory. Now for the facts. Does ‘buying the dip’ work in practice?
31 falls of 10% or more since 1900 in the US
Today’s chart shows the daily Dow Jones Industrial Average since 1900, highlighting the 31 times it has fallen by -10% or more from peaks.
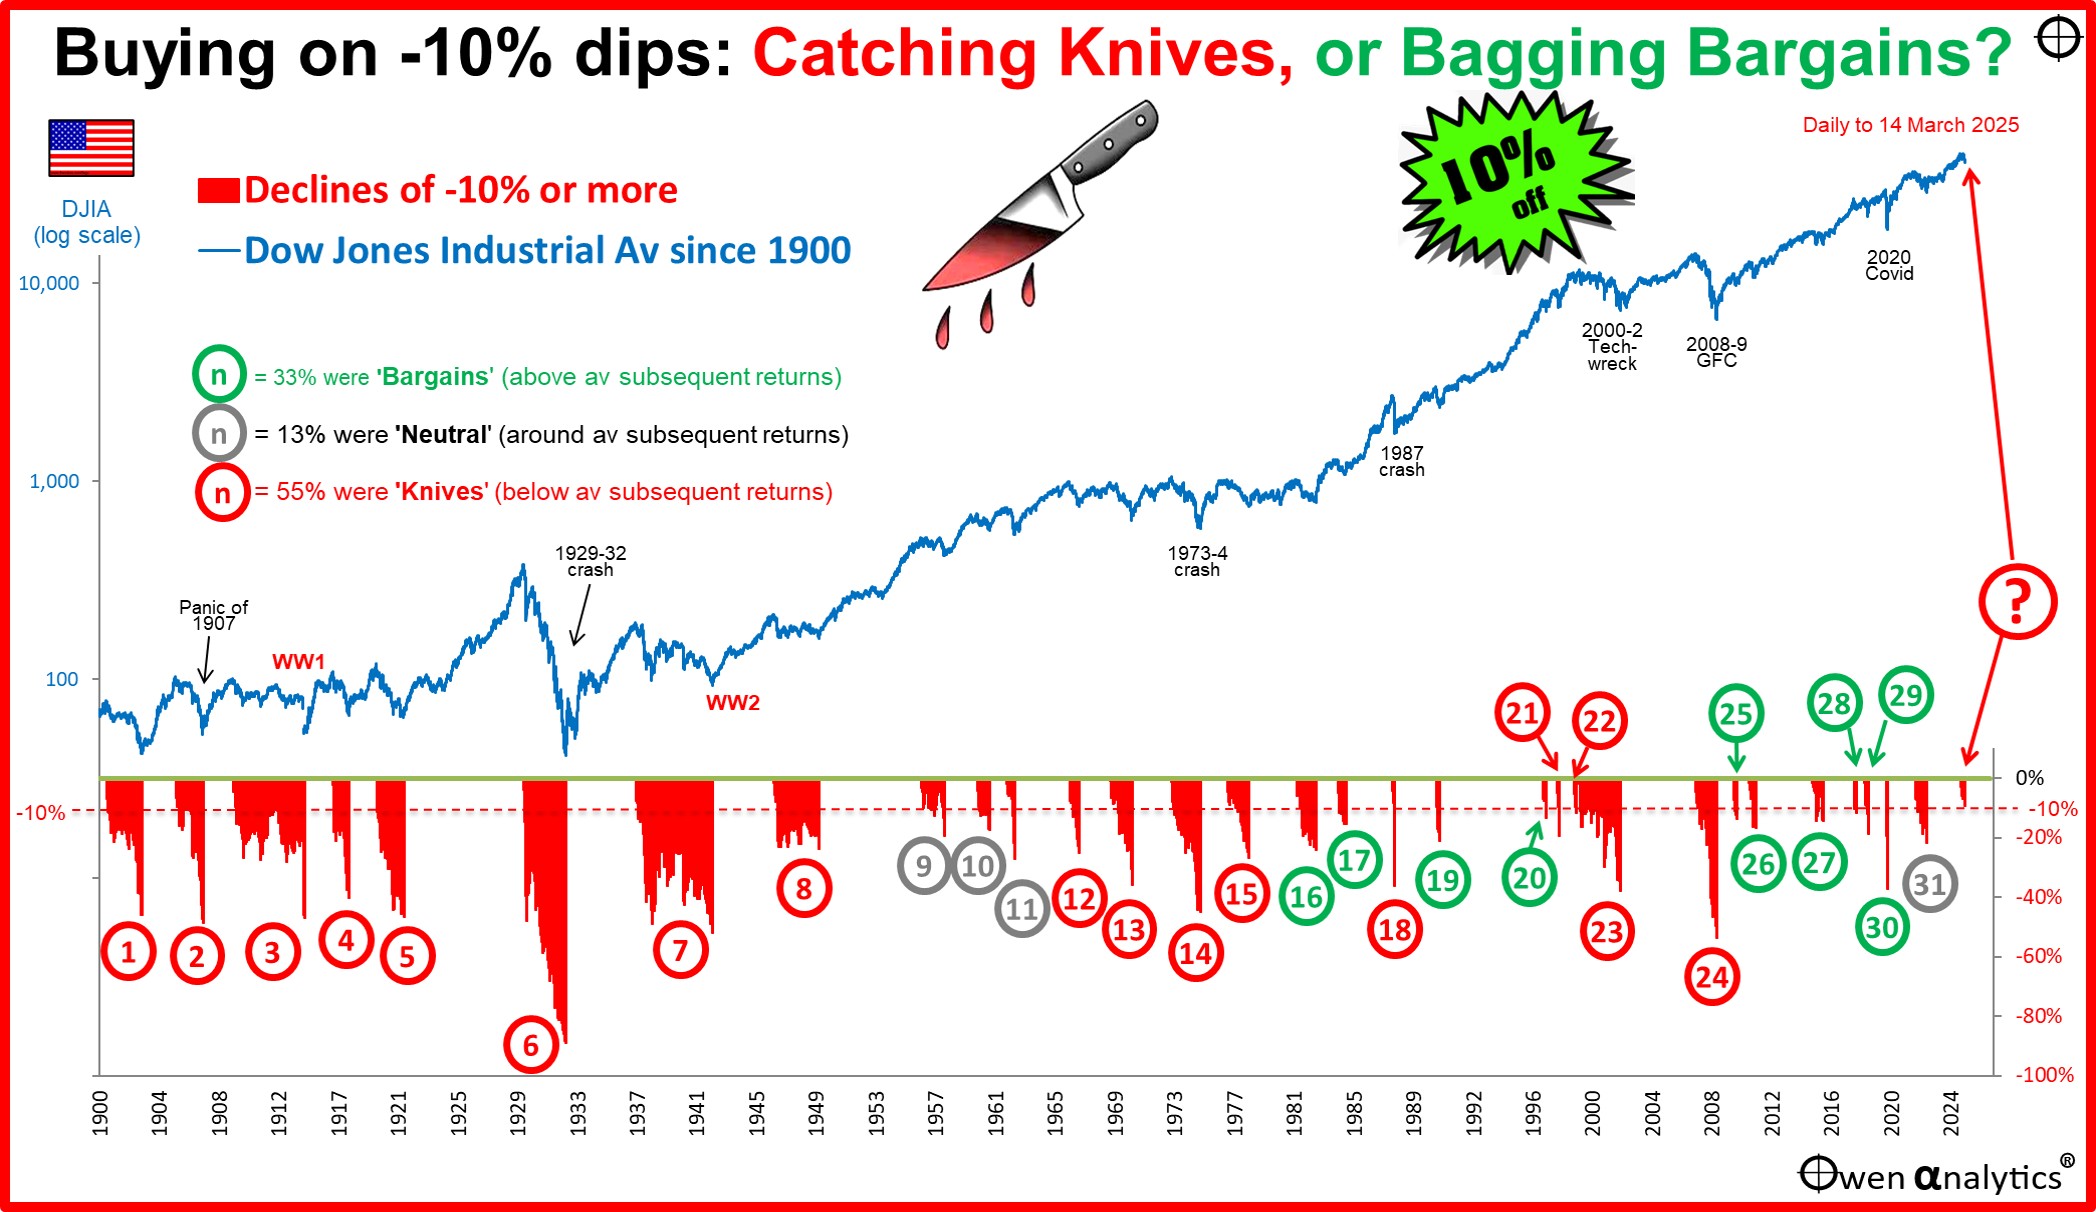
(Here I use the Dow Jones because the broader S&P daily index only started in 1950. The Dow is still a pretty good indicator of broad market sentiment and returns. It is still the most important number that hits the headlines and causes panic or euphoria around the world.)
The 31 dips of -10% or more were spread pretty evenly throughout the 125 year period. The worst by far was the 1929-32 fall of -89% (number 6), but there were also several falls of more than -40% (dips 1, 2, 3, 4, 5, 7, 14, 24).
This month’s mini-dip – you can hardly see it!
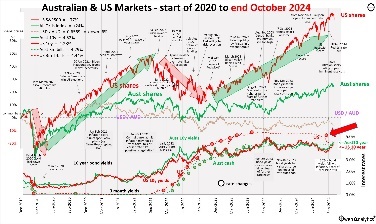
The current mini-dip is highlighted at the far right of the chart. On Thursday 13 March, the Dow was down -9.3% fall from its all-time high (4 December 2024). Not quite our 10% threshold yet, but the S&P500 hit a low of -10.1% on 13 March, and the All Ords in Australia hit a low of -9.3% on the same day.
Despite media headlines screaming all sorts of emotive terms like: ‘Crash!’, ‘Rout!’, ‘Collapse!’, ‘Carnage!’, and so on – the current mini-dip is actually so small in historical terms that you need a magnifying glass to see it! (It’s there in the top-right corner of the chart – trust me!)
(In long-term charts like this, the vertical Y-axis uses a ‘log’ or ‘ratio’ scale, so all changes of a similar magnitude in percentage terms (say -10%) appear as the same height on the chart, regardless of the price level at the time. Eg all -10% dips appear as 5mm or whatever). This puts the current ‘dip’ on the same footing as the others in percentage terms.
What happened next?
The table below shows what happened next after each of these dips of -10% or more:
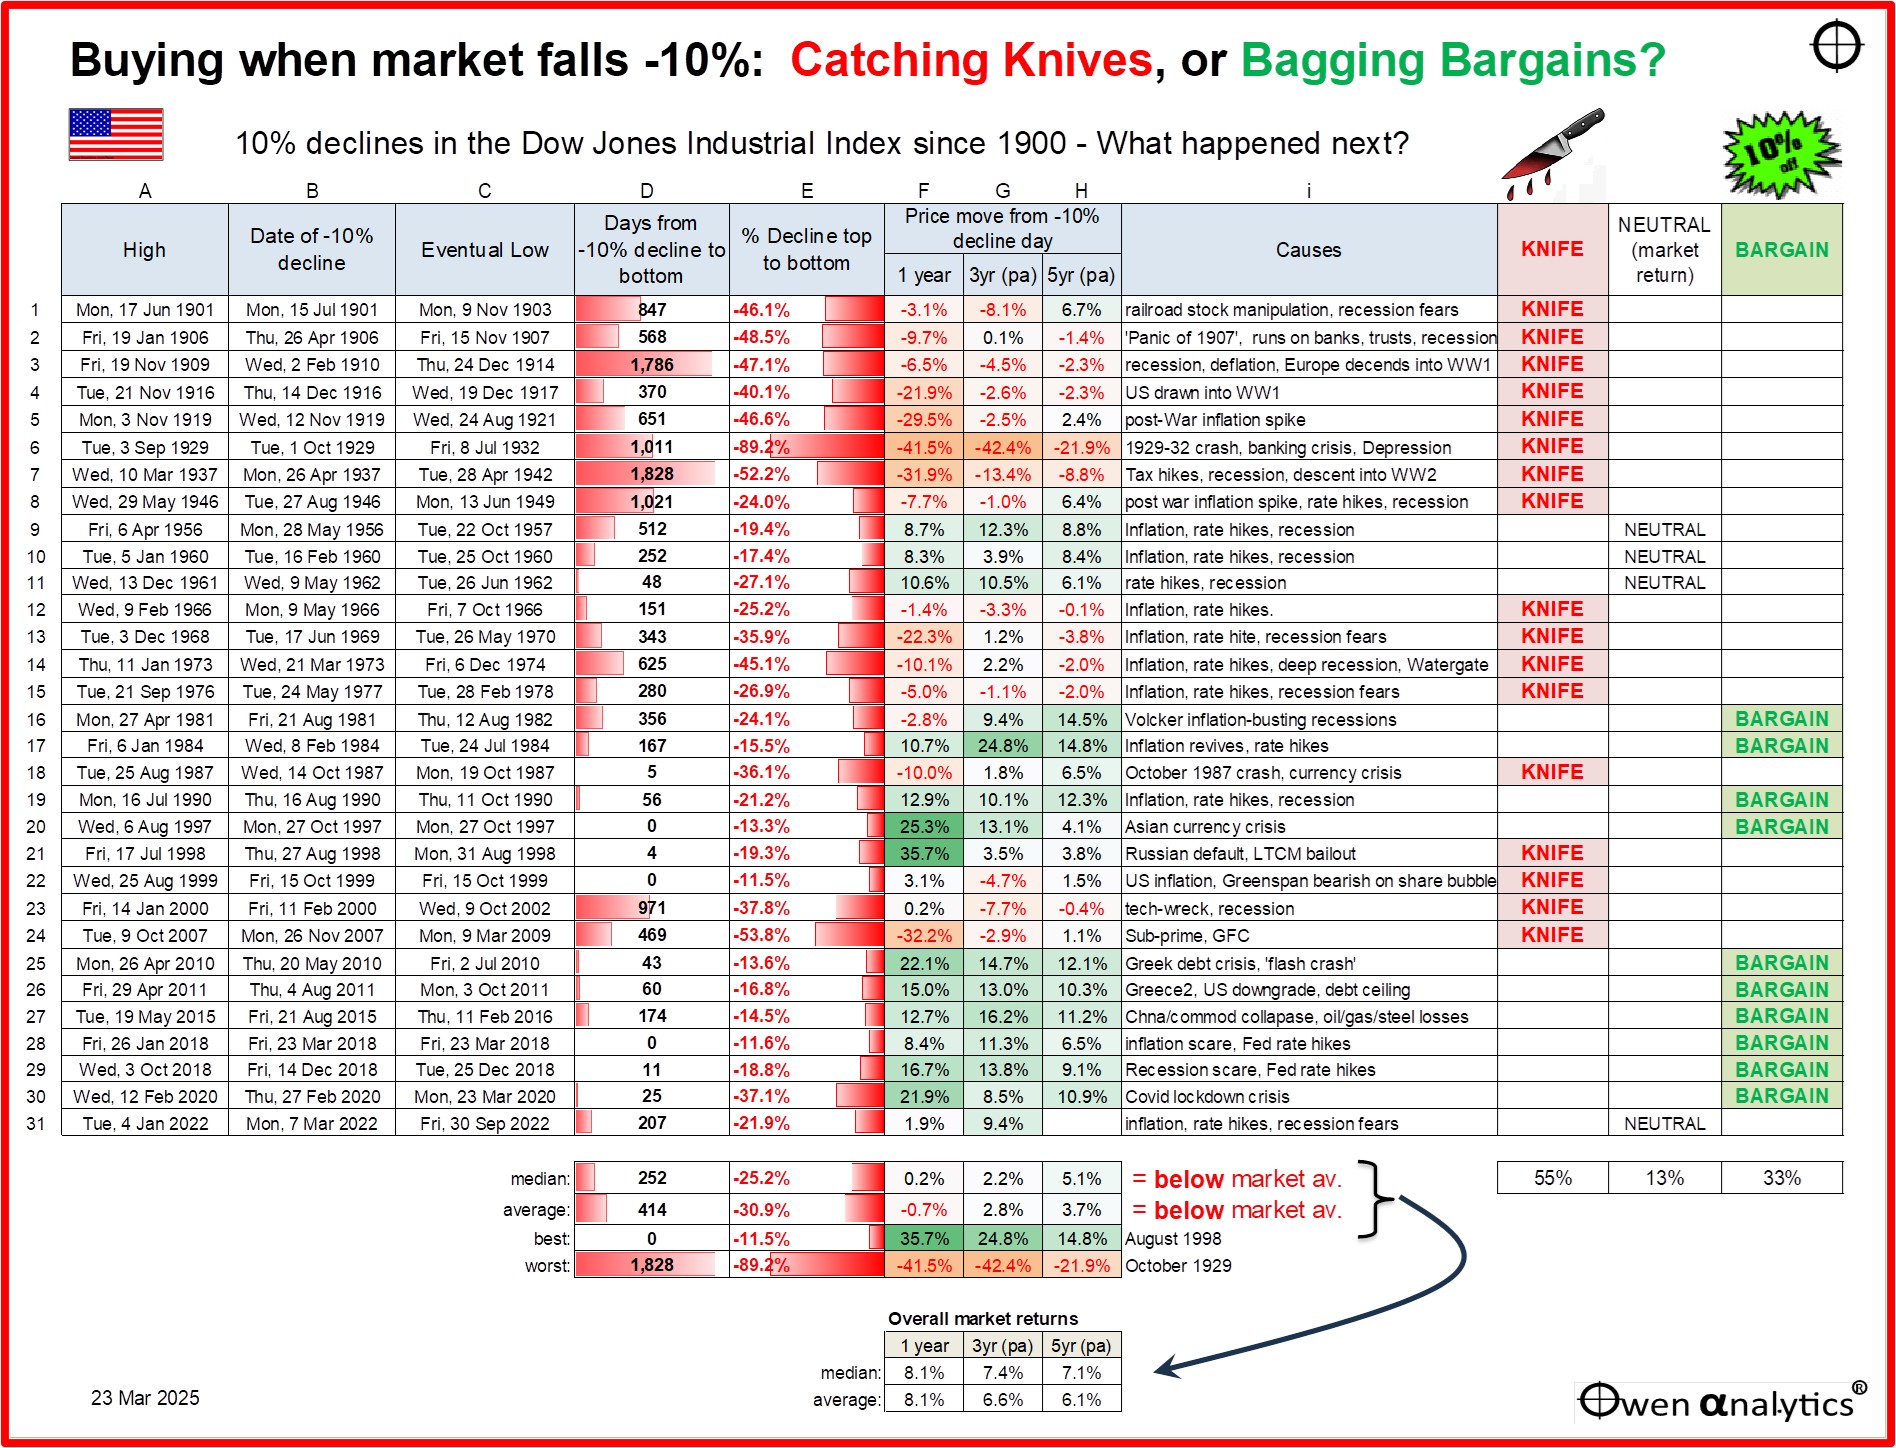
Starting from the left of the table, we have the date of the market high (column A), the day a dip of -10% was reached (B), and the day the market eventually bottomed (C).
Timing the bottom, or falling knives?
Colum D shows the number of days of further falls after the -10% day to the eventual bottom. There were two occasions when the -10% day turned out to be the bottom:
- the 1997 dip (number 20, Asian currency crisis),
- the 1999 dip (number 22, early wobbles at start of ‘tech-wreck’), and
- the January-March 2018 dip (number 28 – US inflation / recession fears with aggressive Fed rate hikes)
In all other cases, the market kept falling beyond the -10% dip. Some were only short periods of further losses, but most were long or very long:
- the median additional period of further falls after the dip was 252 days (bottom of column D),
- the average additional period of further falls after the dip was 414 days (bottom of column D).
These are very long periods of additional falls/pain after thinking you were getting a bargain by buying the 10% dip. If you buy a -10% dip, in most cases you ended up with a year or more of further falls!
10% dips usually turn into much deeper sell-offs
Column E shows the total sell-off from each peak. In almost all cases, the eventual sell-off was a lot worse than the initial -10% dip.
-
-
- 65% of the -10% dips (20 of 31) turned into sell-offs of -20% or more.
- 42% of the -10% dips (13 of 31) turned into sell-offs of -30% or more.
The bottom line is that stock markets are not ‘random’ as finance textbooks and Nobel prize-winning theories proclaim. Markets trend, sometimes trending down for several years at a time.
In most cases, a 10% fall is just the start of a much larger fall (a further -15% fall on average – column E), and for a much longer period (more than a year of further falls on average – column D).
Subsequent returns from buying the dip
As a long-term investor, not a trader, I am not interested in short term volatility, apart from delivering lower buy-in prices from time to time. What is important is the returns from my buy-in price.
The table shows the subsequent price moves starting from the day the -10% dip was reached – over the subsequent 1 year (column F), two years (G), and three years (H). The two-year and three-year numbers are annualised. (The Dow Jones is a price index, so it does not include dividends.)
I am more interested in the 3-year and 5-year returns, but I also include the 1-year return here to show how much short term pain you would need to endure to get to the 3-year and 5-year returns.
At the very bottom of columns F, G, & H we can see that the price index moves over 1, 2 and 3 year periods for the whole period since 1900 have averaged around 6% to 8% per year, with median gains of around 7% to 8% per year (excluding dividends). So we are interested in seeing if ‘buying the dip’ resulted in better or worse outcomes than these overall market gains.
Overall – buying the dip results in poor subsequent returns
Although you may be buying at a 10% ‘discount’ after a 10% fall, buying the 31 dips resulted in significantly lower average and median returns over subsequent 1, 3, and 5-year periods.
In most cases, that was because buying in at a 10% discount did not suddenly make it ‘good value’. The market was still over-valued – even at a 10% discount (and/or vulnerable to further negative shocks), and so subsequent returns were still below average, even when bought at 10% below the peaks.
Some bargains and some shockers
The overall experience of buying the dip has been poor, but there was a wide variation of outcomes. The three columns on the far right of the table indicate whether the dips ended up being ‘Knives’, ‘Bargains’, or ‘Neutral’ (average market-like returns).
55% of the dips turned out to be ‘Knives’, 33% were ‘Bargains’, and the remaining 13% were ‘Neutral’.
Bargains
There were some cases when buying the -10% dip generated some well above market returns. These are the green cells in columns F, G, H. Best were dips 16, 17, 19, 25, 26, 30.
It is notable that all of the ‘Bargains’ occurred in the post-Volcker era (Fed Chair Paul Volcker’s inflation-busting double-dip recessions at the start of the 1980s).
The most recent great bargain was the Covid lockdown crisis sell-off in February-March 2020 (dip 30). Although the initial -10% dip kept going down for a further 25 days and turned into a total decline of -37%, it led to well above-average returns over the subsequent 1, 3, and 5-year periods from the buy-in price.
Shockers
On the other hand, there were some dips that were real shockers, where buying the dip produced big losses over very long periods – dip 6 (1929-32 crash), dip 7 (1937-1942), and all of the dips from the mid-1960s to the late 1970s (high inflation plus rate hikes and recessions).
Notice how most of the ‘Knives’ were in the pre-Volcker era. Before Volcker, the US Fed was either non-existent (pre-1914), or was undisciplined/counter-productive (1920s, 1930s), or ineffective (1940s to late 1970s).
The only really bad ‘buy the dip’ outcomes in the post-Volcker era were:
-
- Dip 18 – in the October 1987 crash,
- Dips 21, 22, 23 – preceding and during the 2000-2 ‘tech-wreck’ crash that ended the late 1990s speculative ‘dot-com’ boom,
- Dip 24 – the 2008-9 ‘GFC’ crash that ended the 2000s speculative housing/credit boom.
Pricing matters
More than half of the -10% dips followed a very familiar pattern: inflation, rate hikes, and recession fears (I summarise the main causes of each dip in column i).
Some sell-offs were triggered by external factors (eg wars), but most of the deeper and longer sell-offs were the bursting of highly over-priced booms. In these cases, buying a -10% dip turned out to be far too early.
The prime examples of this were the 1929-32 crash (dip 6), and the 2000-2 tech-wreck (22, 23). This brings us to how they compare to current conditions.
Where are we now?
Today (mid-March 2025), even after a 10% fall, the overall US market is still significantly over-priced on a host of measures, with many similarities to the 1920s boom before the 1929-32 crash and Depression, and the 1990s boom before the 2000-2 ‘tech-wreck’ crash. In both cases, the initial -10% dip was followed by further long and deep declines and very poor subsequent returns.
In the current over-priced tech boom, buying now would be trying to ‘catch knives’ and will most likely lead to pain – below average subsequent returns from current (albeit 10% discounted) price levels, and probably further falls to come.
The current dip may not be the start of the ‘big correction’ - just as the 1998 dip (Russian default) was not the start of the 2000-2 tech-wreck crash - but the current over-priced tech boom will most likely deflate within the next 3-5 years.
Bottom line – I am not buying the dip on this occasion, or at least not yet. A dip of 10% still leaves the overall market over-priced and vulnerable to a range of risks that could trigger a full collapse.
Conclusions
Stock markets are not ‘random’ as finance textbooks and Nobel prize-winning theories proclaim. Markets trend, with downward trends often lasting several years at a time.
In most cases, a 10% fall has turned out to be just the start of a much larger fall (a further -15% fall on average – column E), and for a much longer period (more than a year of further falls on average – column D).
Each market dip/crash was different of course, but almost all were affected by one of two common elements – and often both at once. One is the very common pattern of inflation / rate hikes / recession fears. The other is over-pricing.
If the market is over-priced by say 50% or more (as it is today on many measures), a -10% dip does not suddenly make it good value. Poor returns are likely from current levels, even if the current dip does not turn out to be the start of the ‘big one’.
Bottom line:
It is going to take a much bigger dip for the current market to become 'good value' - at least big enough so I can actually see it on my chart!
'Till next time. . . . safe investing!
For more on the US share market (which drives all global markets, including Australia) -
For my most recent monthly update for Aussie investors:
Plus check out my web site for 100+ recent, topical fact-based articles on a host of issues for inquisitive, independent-minded investors.