Following up my recent story on US share market dips, here is the same analysis of the Australian market -
- The Aussie market has had 36 ‘dips’ of -10% or more since 1920. What happened in each case if you ‘bought the dip’?
- ‘Buying the dip’ still resulted in more ‘Knives’ than ‘Bargains’, and below average returns overall, but the outcomes were significantly better than buying the dips in the US market.
- Our market almost always follows the US. 83% of dips on the ASX were led/accompanied by falls on the US market. Only 17% of the local dips were due to local factors alone. All but one were ‘Bargains’.
- Where are we now? Will I be ‘buying the dip’ on our local market as the US market deflates?
A few days ago I published my review of the dips of -10% or more on the US stock market since 1900. See -
My findings on the US market ‘dips’ were:
- In most cases, a -10% dip in the US market turned out to be just the start of a much larger fall (a further -15% fall on average), and for a much longer period (more than a year of further falls on average).
- Overall, buying the dips resulted in significantly below-average returns over subsequent 1, 3, and 5-year periods from the buy-in price, but there were several occasions when buying the dip resulted in above-average returns.
- Pricing was a critical factor – if the market was over-priced, a -10% dip mostly turned out to be the start of the bust that deflated the over-priced booms. Prime examples were the 1929 crash that ended the speculative 1920s boom, and the 2000-2 ‘tech-wreck’ that ended the 1990s speculative ‘dot-com’ boom.
In the US story I outlined –
- the case for ‘buying dips’ – logically, buying at a 10% ‘discount’ should increase subsequent returns from the lower buy-in price.
- The case against buying dips - in reality, markets are not random – they trend, and -10% dips mostly turned into much deeper set-backs, resulting in significantly lower returns from the buy-in price. Bottom line – reality trumps logic.
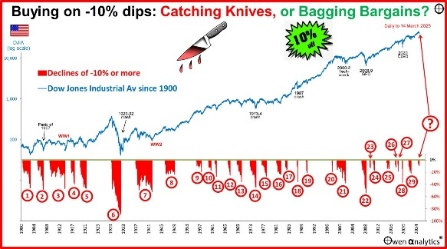
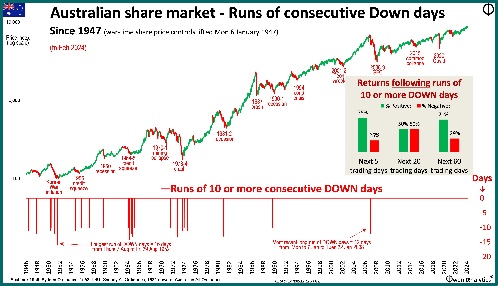
Today’s chart shows all of the dips of -10% or more on the ASX market since 1920 (which is as far back as my daily series goes. See end of this article for notes on data sources) –
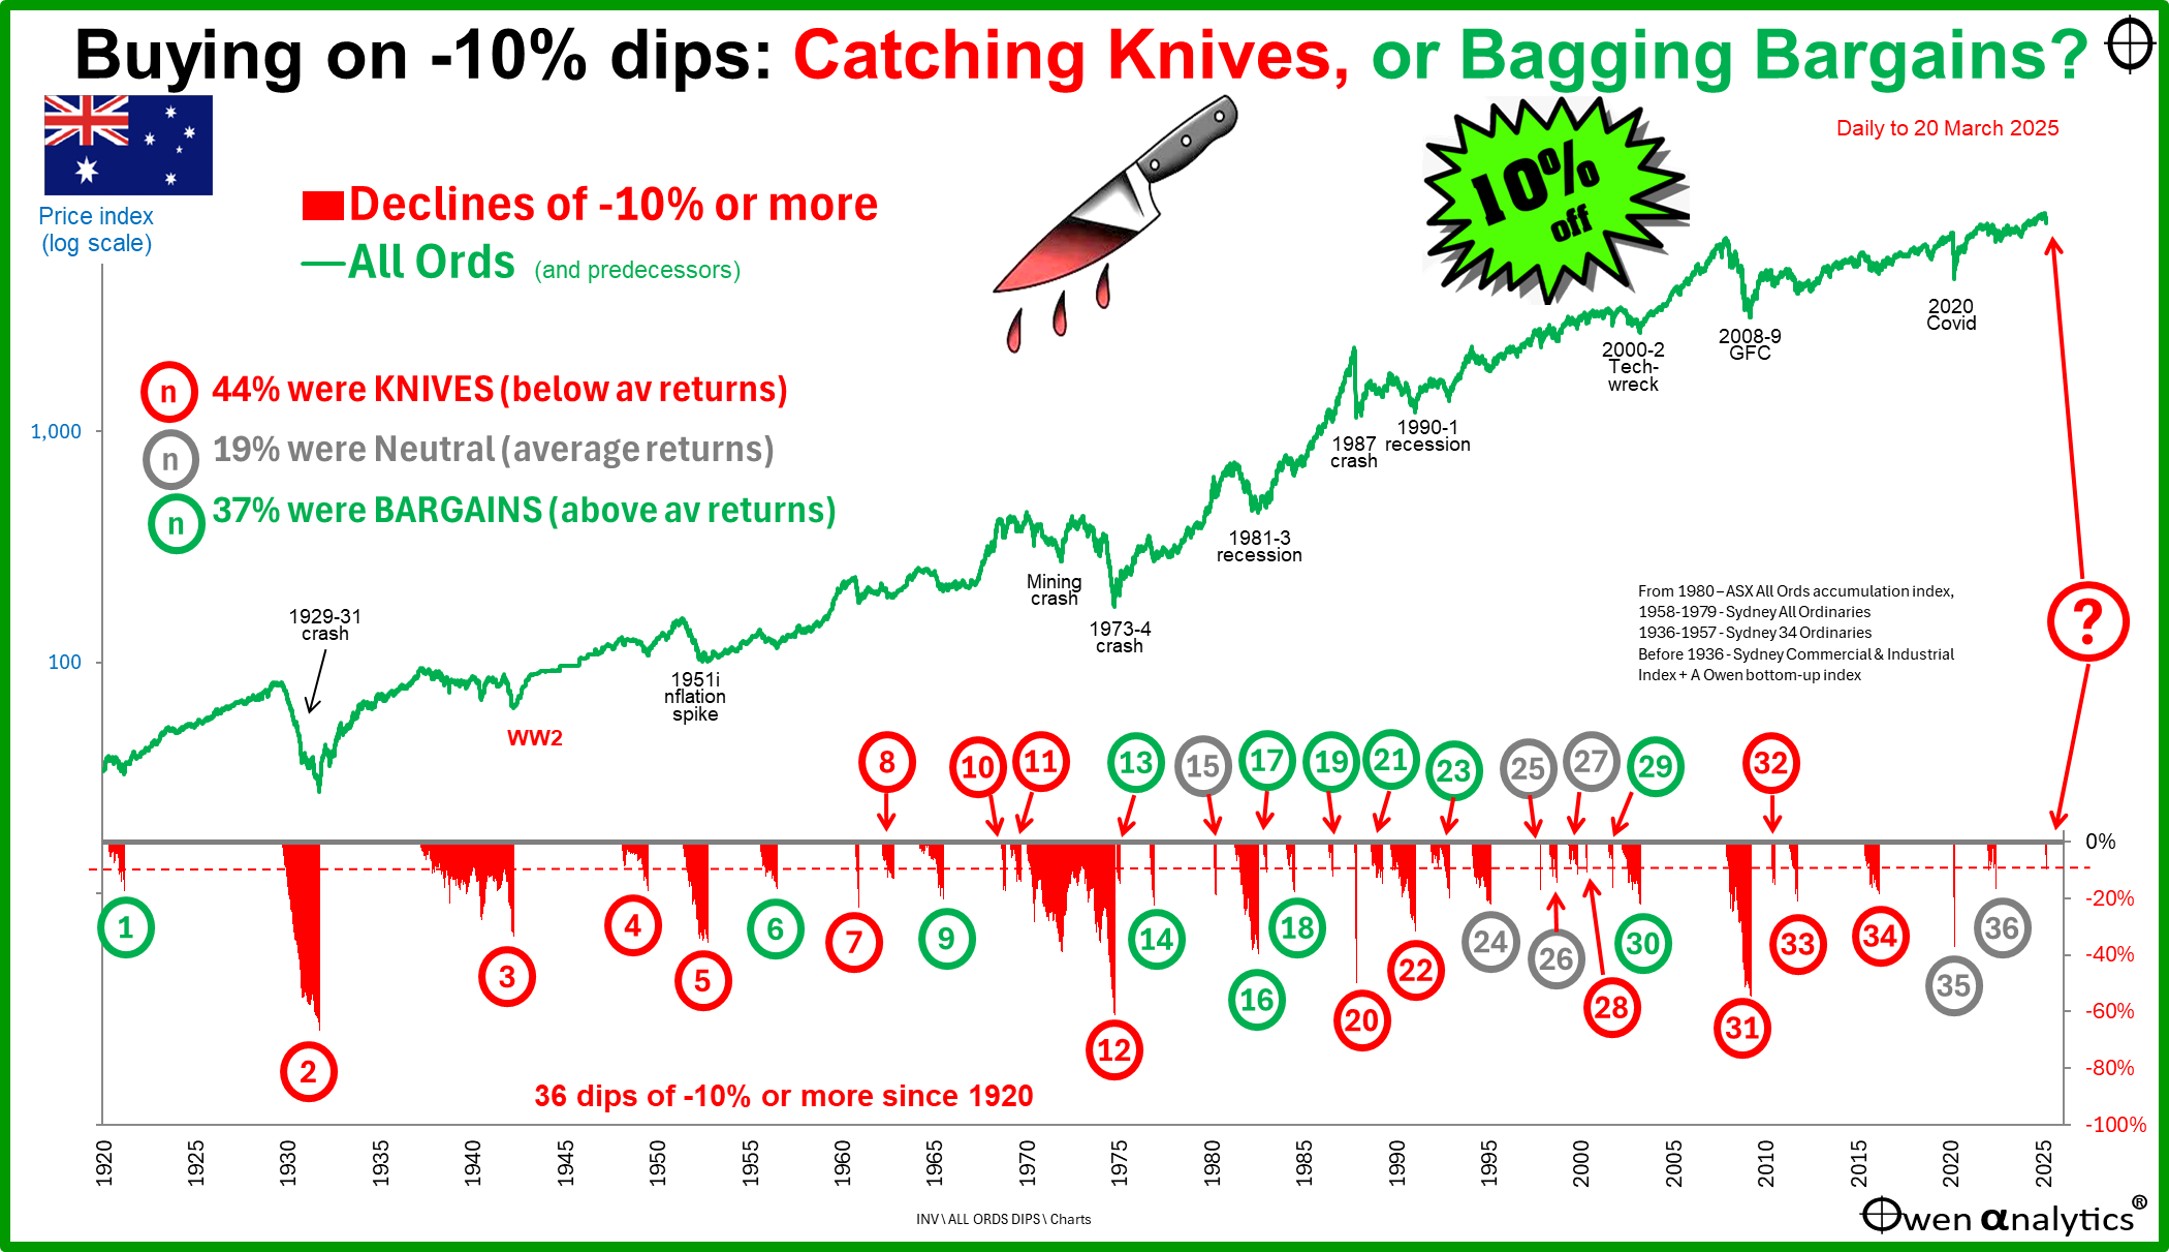
The worst sell-off was the 1929-31 crash, which was also the worst for the US market (but ours was not as deep, and a year shorter than the US).
Also like the US market, the recent -9.7% dip in the All Ords is so small in historical terms you need a magnifying glass to see it.
‘Knives, ‘Bargains’, and ‘Neutral’ returns from buying -10% dips
The colour of the Dip number on the chart indicates the outcome for investors if they bought into the broad market at the point the dip reached -10%. As with the US story, I measure returns (price index return, excluding dividends) over subsequent 1-year, 3-year, and 5-year holding periods from the entry price on the day the dip reached or exceeded -10% from the recent high.
- 44% of dips turned out to be ‘Knives’ (below average subsequent returns)
- 37% of dips turned out to be ‘Bargains’ (above average subsequent returns)
- The remaining 19% of dips turned out to be ‘Neutral’ (around average subsequent returns)
This is better than the US market, where
- 55% of -10% dips turned out to be ‘Knives’
- 33% turned out to be ‘Bargains’
- 13% turned out to be ‘Neutral’
What happened next?
The table below shows what happened next after each dip of -10% or more on the Australian market:
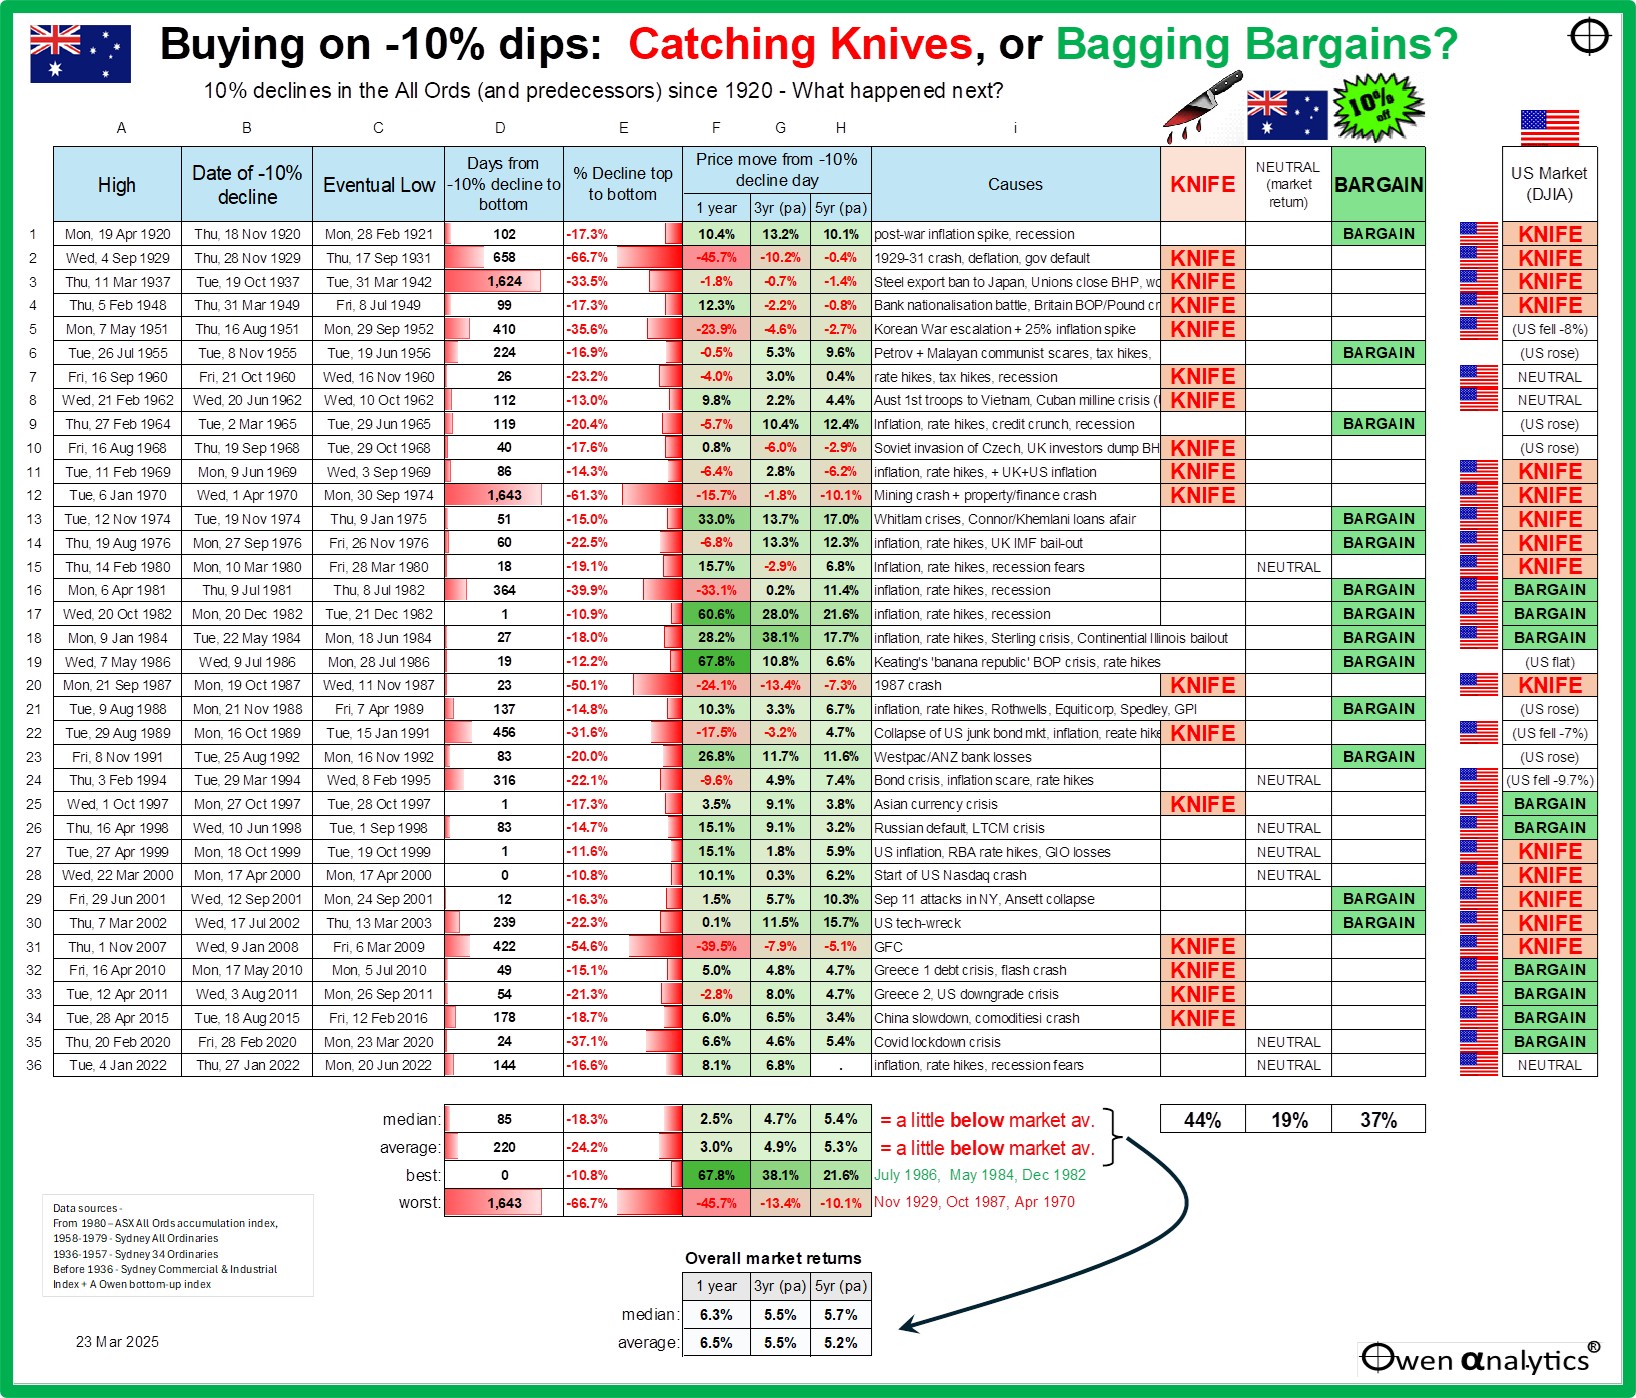
This table has the same columns as the US table in the US story – except this time at the far right of the table I added two columns M and N to indicate whether each ASX dip mirrored (ie followed) the US market.
A US flag in column M indicates that the US market was also falling at the same time as the dip on our local market. The far-right column N indicates whether the US dip at the same time as our local dip turned out to be a Knife, Bargain or Neutral for US shares (from my recent US story). I have done this because. . .
Majority of dips on our market were US-led
The Australian stock market almost always follows the US market. Both markets boom and bust together (with rare exceptions), but the extent of the relative booms and busts in each market vary with each cycle. The Australian and US share markets essentially take turns in having the bigger boom and then the bigger bust.
See –
From the US flags in column M at the right of the above table, we can see that only 6 of the 36 dips on the Australian market does not have a US flag – ie only six of our dips were NOT accompanied/triggered by falls on the US market at the same time.
Here are the six dips on the Australian market that were due to local factors alone, while US prices rose –
- Dip 6 - 1955-6 – Petrov and Malayan communist scares (the Cold War comes to our backyard), plus tax hikes. (Bargain)
- Dip 9 – 1964-5 – inflation, rate hikes, credit crunch, recession (Bargain)
- Dip 10 – August-October 1968 – UK investors dump BHP and mining shares (Knife, because it preceded the 1970 mining collapse)
- Dip 19 – May-July 1986 – Balance of Payments crisis, Keating’s ‘banana republic’ comment (Bargain)
- Dip 21 – 1988-9 – Inflation, rate hikes, collapses of Rothwells, Equiticorp, Spedley, GPI (Bargain)
- Dip 23 – 1991-2 – Westpac & ANZ losses due to bad debts from the 1980s lending binge (Bargain)
Note that five out of these six ‘local factor’ dips turned out to be ‘Bargains’ if investors bought in when the dip was at -10%, even though the market continued to fall in the short term well beyond the initial -10% dip.
Timing the bottom perfectly
As in the US table in the US story, starting from the left of the table, we have the date of the market high (column A), the day the -10% dip was reached or exceeded (B), and the day the market eventually bottomed (C).
Colum D shows the number of days of further falls after the -10% day to the eventual bottom.
There were four -10% dips that turned out to pretty much the bottom of the dip, so ‘buying the dip’ led to no further immediate pain on the downside. However, although these four -10% dips produced no more immediate downside, only two turned out to be ‘Bargains’ –
- Dip 17 – ‘Bargain’ - starting after the 20 October 1982 high (the trigger for the dip was high inflation, rate hikes, recession, after the late 1970s-early 1980s property and mining booms). The dip hit -10% on 20 December, and hit bottom only 1 day later on 21 December (down -10.9% from the high) then rebounded. Buying that dip turned into a tremendous ‘Bargain’ – returning 61% over 1 year, 28% pa over 3 years and 22% pa over five years from the buy-in price (not including dividends).
- Dip 25– ‘Knife’ - starting after the 1 October 1997 high (the trigger for the dip was the Asian currency crisis). The dip hit -10% on 27 October, and hit bottom just 1 day later on 28 October (down -11.6% from the high) then rebounded. Even ‘though ‘buying the -10% dip’ almost picked the bottom perfectly, it did not turn out to be a bargain because subsequent returns ran into the 1998 Russian default crisis and then the ‘tech-wreck’ – which were entirely unrelated to the original 1997 dip.
- Dip 27– ‘Neutral’ - starting after the 27 April 1999 high (the triggers for the dip were RBA rate hikes and GIO losses, plus the US market was also showing the first signs of wobbles at the top of the ‘dot-com’ boom). The dip hit -10% on 18 October, and hit bottom just 1 day later on 19 October (down -11.6% from the high) then rebounded. Again, even ‘though ‘buying the -10% dip’ almost picked the bottom perfectly, it again did not turn out to be a bargain because subsequent returns ran into the ‘tech-wreck’ – which was unrelated to the original 1999 dip.
- Dip 28– ‘‘Bargain’ - starting after the 22 March 2000 high (this dip was in response to the Nasdaq sell-off, which turned out to be the start of the long and deep US tech-wreck crash.) The dip on the ASX hit -10% on 17 April, which turned out to be the bottom of the dip on the local market (but not in the US). In this case, buying the dip picked the bottom of the local ASX dip exactly, and it turned into a real Bargain because Australia had a very mild ‘tech-wreck compared to the US experience. Australia’s ‘dot-com’ boom was much milder, and so our ‘tech-wreck’ was also much milder.
Aside from these four occasions when buying the local ASX -10% dip picked the bottom almost perfectly, in every other case, the market kept falling beyond the -10% dip. Some were only short periods of further losses, but most were longer:
- the median additional period of further falls after the dip was 85 days (bottom of column D), which is much better the US market, where the median was 252 days of further falls after the -10% dip.
- the average additional period of further falls after the dip was 220 days (bottom of column D). This was also much better the US market, where the average was 414 days of further falls after the initial -10% dip.
Although our experience has been better than in the US, these are still long periods of additional falls/pain after thinking you were getting a bargain by buying the 10% dip. If you buy a -10% dip, in most cases you ended up with several months of more of further falls.
10% dips usually turn into much deeper sell-offs
Column E shows the total sell-off from each peak. In almost all cases, the eventual sell-off was a lot worse than the initial -10% dip.
- 42% of the -10% dips (15 out of 36) turned into sell-offs of -20% or more. (65% in the US)
- 25% of the -10% dips (9 of 36) turned into sell-offs of -30% or more (42% in the US).
The bottom line is that stock markets (here and in the US) are not ‘random’ as finance textbooks and Nobel prize-winning theories proclaim. Markets trend, sometimes trending down for several years at a time.
In most cases, a -10% fall turned out to be the start of a much larger fall (a further -14% fall on average – column E), and for a much longer period (more than a few months of further falls on average – column D).
Where are we now?
On 13 March, the All Ords hit a -9.7% dip below the all-time reached on 14 February. Not quite -10% yet but close. As usual, the dominant factor driving our market is what is happening in the US of A. Our local market is over-priced on a variety of measures, but not as nearly as over-priced as the US market, driven by the ‘Magnificent Seven’. (See links to recent stories about US market pricing below.)
It is very similar in a lot of ways to the late-1990s ‘dot-com’ boom that ended with the 2000-2 ‘tech-wreck’. On that occasion, the US had a much bigger boom than Australia, so it had a much deeper and longer bust. The dips on our market leading into the tech-wreck (dips number 26 to 30) turned out to be either ‘Neutral’ or ‘Bargains’ (but they were ‘Knives’ in the US market because the tech-wreck was much deeper and longer there).
Last time, what pricked the bubble and triggered the crash was a combination of inflation, rate hikes, stories of revenue-less dot-com stocks running out of cash, plus some major bankruptcies like Enron, WorldCom, and PG&E, and the 9/11 attacks. This time we have sticky inflation, plus the never-ending and ever-widening Trump chaos.
When (not if) the current US tech boom collapses, and even if the US suffers a long and deep economic recession and stock market crash (like last time), the local Australian market will also fall along with it, but probably not as heavily the US. The ‘dips’ in our market will probably turn out far less damaging than the US dips, like last time.
I have the hummus ready – bring on the dip!
'Till next time. . . . safe investing!
See also -
For more on the US share market (which drives all global markets, including Australia) -
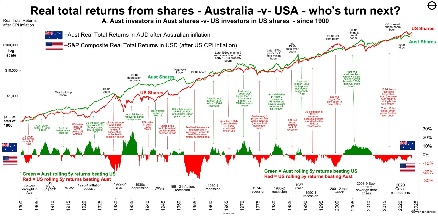
On the similarities between Australian and US shares market return patterns, see –
For my most recent monthly update for Aussie investors:
Plus check out my web site for 100+ recent, topical fact-based articles on a host of issues for inquisitive, independent-minded investors.
A note on data sources:
From 1980 – ASX All Ords accumulation index,
1958-1979 - Sydney All Ordinaries
1936-1957 - Sydney 34 Ordinaries
Before 1936 - Sydney Commercial & Industrial Index + A Owen bottom-up index