Despite continual tiresome warnings of an imminent US-led global recession, plus a host of other threats - widening of wars in Ukraine and the Middle East, stagnation in China, mounting deficits and debts around the world, an on-going confidence-sapping ‘cost of living crisis’, and high political drama in the US - almost all of the main asset classes are doing rather well this year, beating inflation, and most are even doing better than their long-term averages.
Today’s chart shows total returns (ie including income) from two dozen of the main types of investment assets per calendar year since the start of the century. Returns above the red line are positive, below are negative.
This is designed primarily for Australian investors, so returns from international assets come in two flavours – hedged AUD, and un-hedged AUD, as marked.
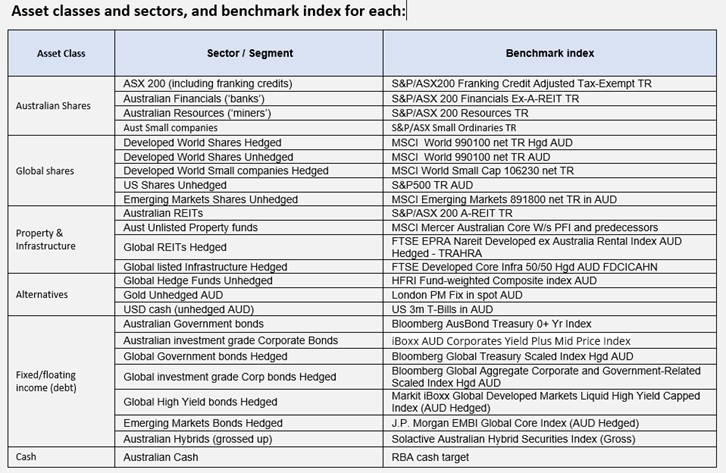
(A table of benchmarks for each asset class/segment is included at the end of this article.)
Portfolios and Inflation
Below the main table are returns from a typical simple ‘70/30’ portfolio (35% Australian shares, 35% developed market shares (50% of which is FX hedged), 10% Australian bonds (50/50 government/corporate), 10% global bonds (also split 50/50 government/corporate), and 10% cash, with all holdings rebalanced yearly. More on this below.
All returns are before fees, so you can deduct a fraction of a percent from returns, as all of these asset classes are available in the form of very low cost ETFs. (Fees on passive ETFs range from around 0.05% for share ETFs, and from around 0.10% for bond ETFs).
At the bottom we show Australian CPI inflation per year.
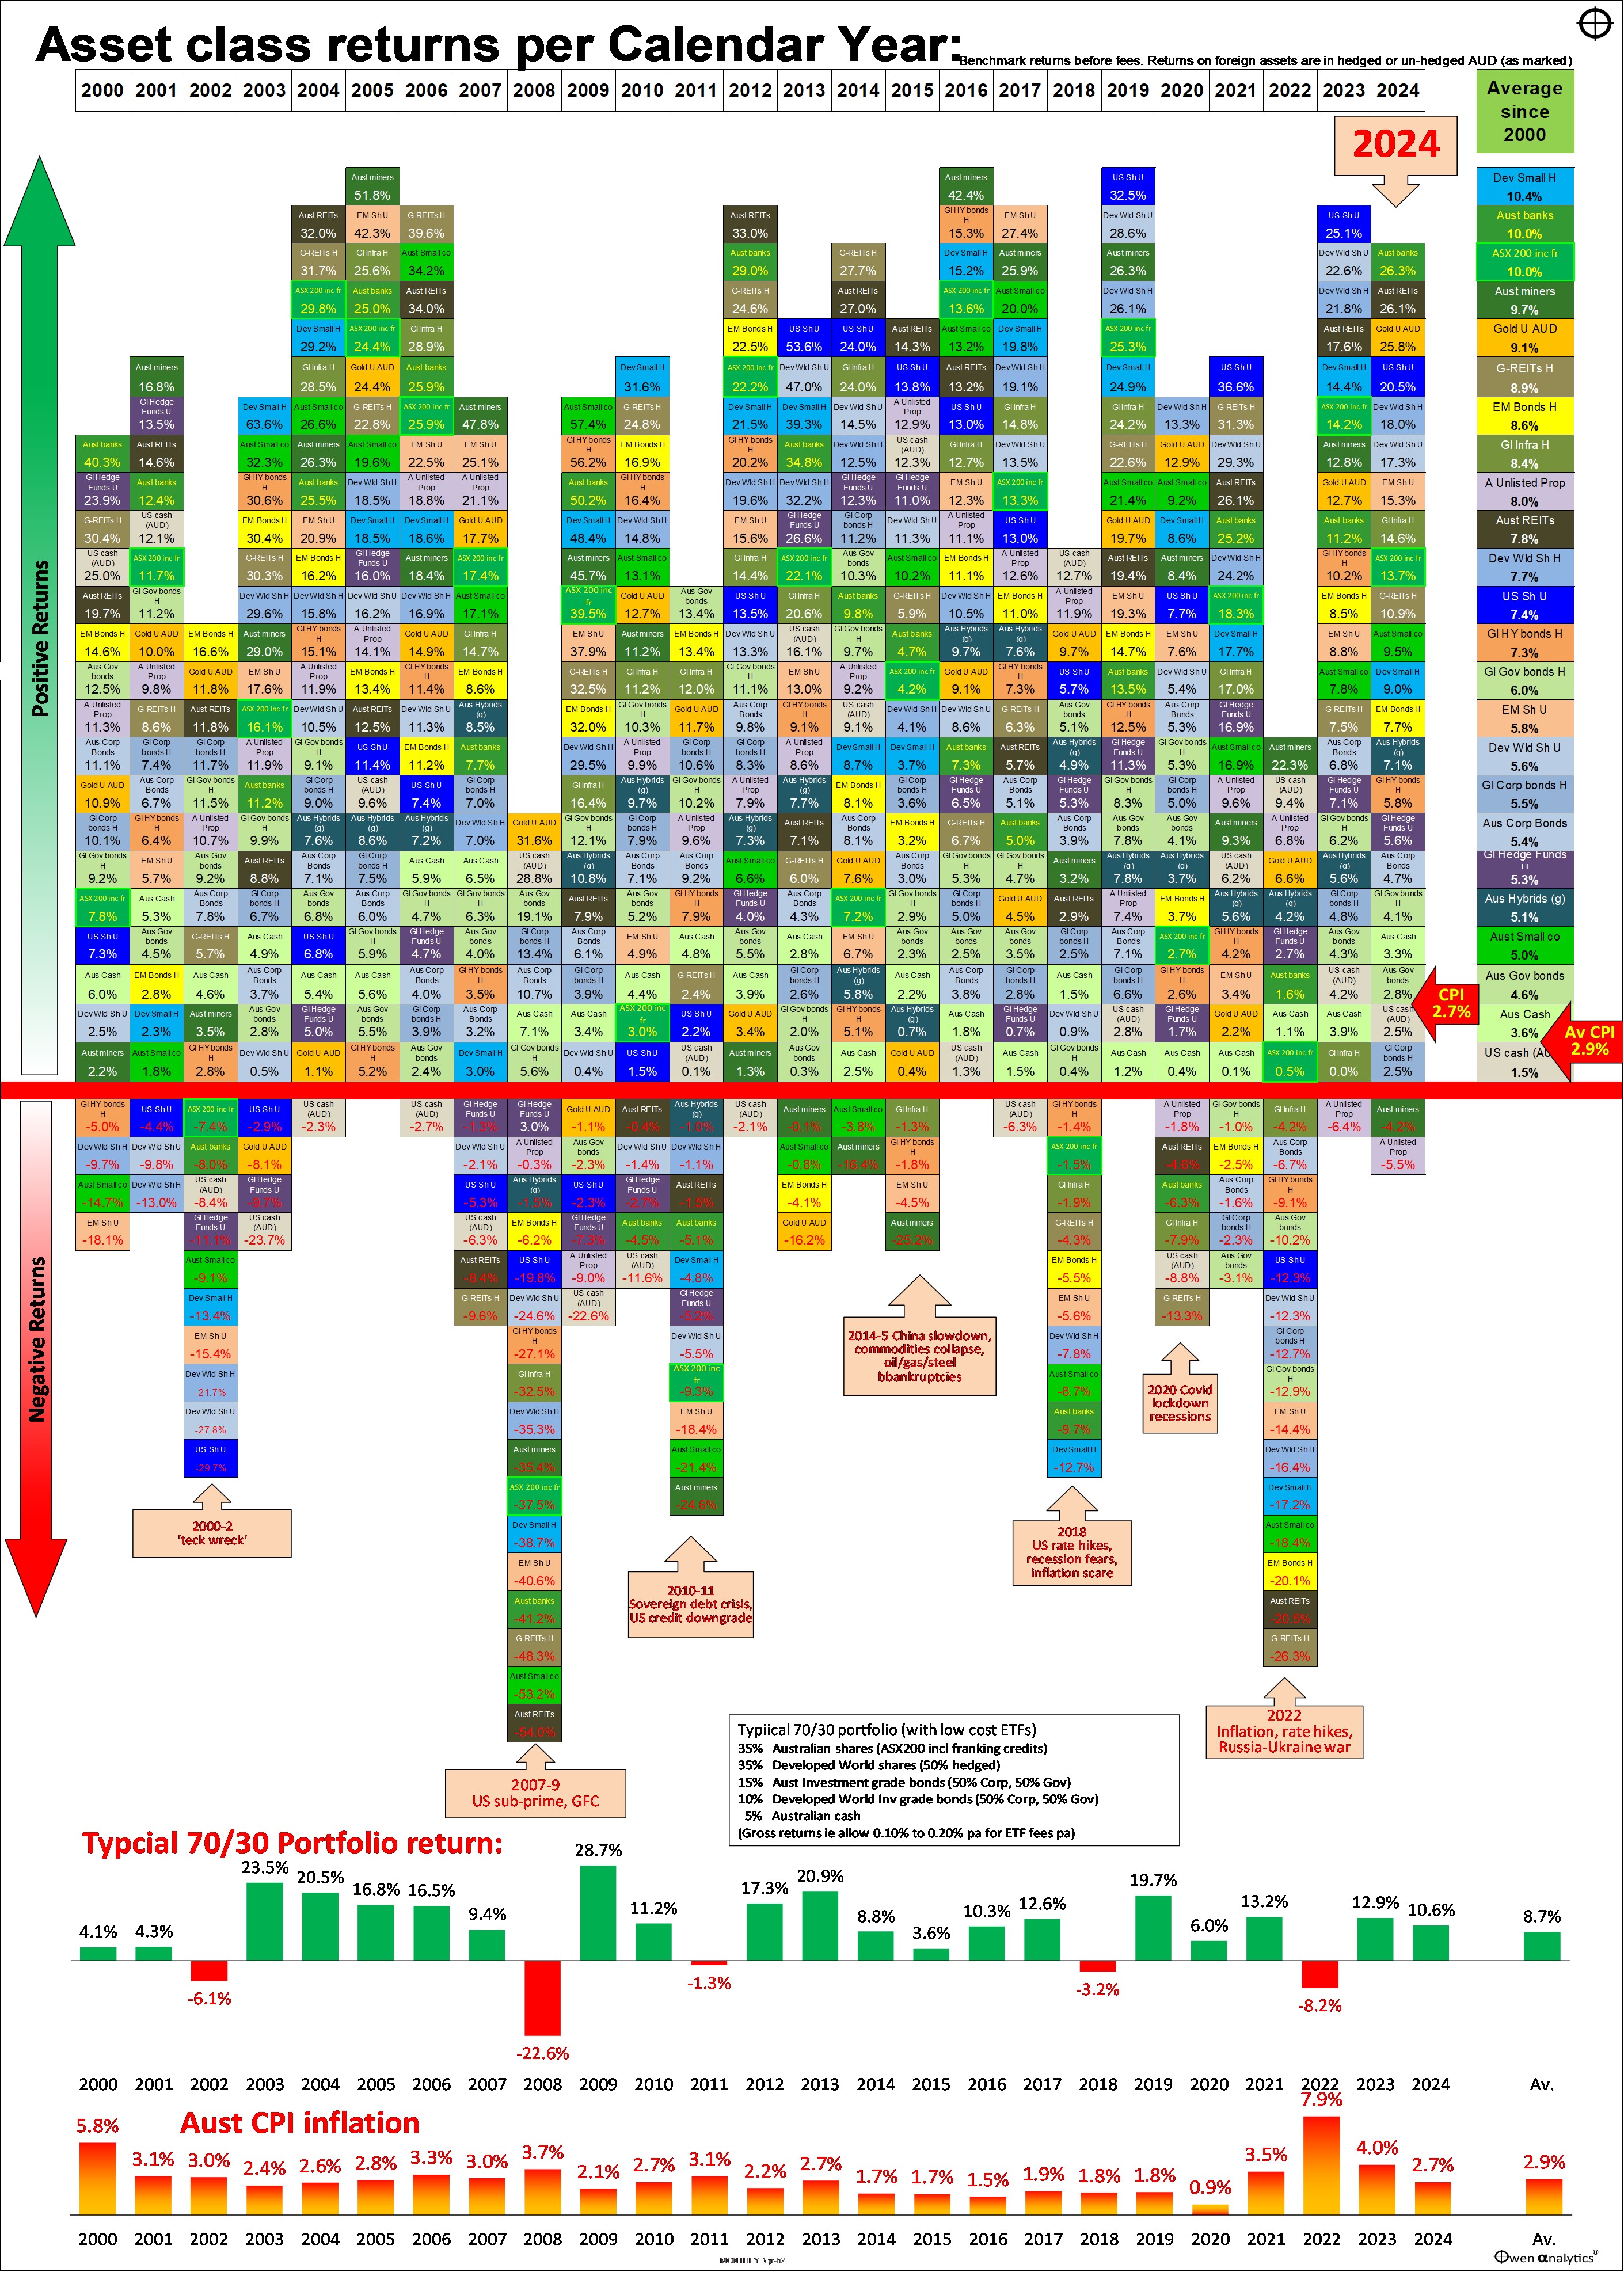
2024 score card – to end of September
Almost all of the main asset classes are positive so far this year, and head of inflation (red arrow).
Although CPI inflation in Australia is still running at 2.7% (or around 3.3% if you back out the government fudge with temporary power bill subsidies). Australian CPI inflation for the full 2024 year is likely to be around 3%.
So far this year, 22 out of the 24 asset classes are positive (above the red line), and 20 are beating inflation. Most are ahead of their long term average returns, with three months left of the year to run.
Negative returns
The only negative returns so far this year are Australian miners and Australian unlisted property. Aussie miners have been hit hard by the collapse in iron ore prices, which were down -33% until a sudden spike upward on the last day of September following the Chinese stimulus announcements, but still down some -23% this year. Probably the miners will end up positive for the full 2024 year.
Not so for Australian unlisted property trusts, which are down again in 2024 and probably will not recover for some time as most are still sitting on artificially high valuations on many of their properties. Office properties are still being affected by high vacancy rates, falling rents and values, and lack of finance for buyers. On the other hand, retail malls appear to be recovering a little, while industrial is still the clear winner in the current online / ‘ai’ boom.
Contrast this with listed property trusts, which were over-sold in 2022 and have rebounded well in 2023 and 2024 with declining bond yields.
Bond markets have posted modest returns this year as bond yields have fallen back (‘recession is nigh!’) – a percent or so above inflation, after their worst-in-a-century losses in 2022.
Asset class returns since 2000
The overall table looks like a random patchwork quilt of returns, with no apparent rhyme or reason. There different winners and losers each year, with returns from every type of asset jumping around from year to year.
Some quick observations:
- In most years, most types of investments post positive returns, and ahead of inflation.
- There are occasional years when everything is positive – like 2005, 2016, and 2019.
- But the rest of the time there are some types of assets that go backwards.
- In the big bust years (like 2008 and 2022), most types of assets post negative returns.
- But even in the worst years, several asset types still manage to post positive returns, although the winners are different each time.
Most frequent highest returning assets
The asset types with the most years with the highest returns are:
- Australian miners = 5 years – mostly thanks to iron ore in the post-2000 China boom
- US shares (Unhedged) = 4 years – mainly in the recent tech/online boom
- Australian REITS = 3 years – mainly recovering from their savage sell-off in the GFC
- Global REITS (hedged) = 2
- Developed world small companies (hedged) = 2
- Developed world shares (hedged) = 1
- Australian banks = 2 (including 2024 so far)
- Australian small companies = 1
- Emerging Markets shares (unhedged) = 1
- Emerging Markets bonds (hedged) = 1
- Australian government bonds = 1
- Gold (unhedged AUD) = 1 (2008, the year of the GFC sell-off)
- USD cash (unhedged) = 1
Most frequent lowest returning assets
Asset types with the most years with the lowest returns are:
- USD cash (unhedged AUD) = 8 years as the lowest returning asset type – so much for the ultimate ‘safe haven!’
- Global REITS (hedged) = 3 years – mostly in Covid lockdowns and the post-Covid inflation spike
- Australian miners = 2
- Australian unlisted property trusts = 2 (2023 and 2024)
- Gold (unhedged) = 2
- Emerging Markets shares (unhedged) = 1
- DM shares (hedged) = 1
- US shares (unhedged) = 1
- Global Hi Yield bonds (hedged) = 1
- Australian REITS = 1
- Developed world small companies (hedged) = 1
- Australian government bonds = 1
- Global infrastructure (hedged) = 1
- Australian cash = 1
Average returns since 2000
The far right column shows average annualised returns over the period since the start of 2000.
So far this century:
- every type of asset has generated positive total returns (above the red line)
- everything except USD cash (in the hands of un-hedged Aussie investors) has beaten inflation
- 1st place with highest average total returns = Developed world small companies (hedged)
- 2nd = Australian banks (but only overtook Australian miners in 2024)
- 3rd = Australian shares (ASX200 including franking credits)
- 4th = Australian miners (were coming 2nd until 2024)
- 5th = Gold in unhedged Australian dollars
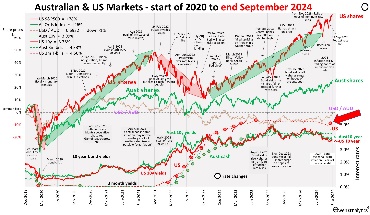
US and global share markets are well down this overall league table as they suffered badly in the 2001-2 ‘tech wreck’. However, we can see that US shares have been at or near the top of the table in recent years, but they will fall again when the current US-led global tech boom collapses (always have, always will – this time is not different!)
Portfolio construction
Good portfolio construction is not about trying to pick the best asset classes each year or trying to avoid the worst.
Nor is it about chasing last year's winners (hoping for a ‘momentum’ effect), or last year's losers (hoping for a ‘contrarian’ or ‘reversion’ effect). These strategies almost always destroy wealth.
Good portfolio construction is about selecting the right mix of assets so that the portfolio as a whole has the greatest probability of achieving each investor’s long-term goals, within their tolerance for risk and volatility (ups and downs along the way), and their liquidity requirements.
Sample portfolio returns
On our simple ‘70/30’ portfolio, the returns are before fees, and they assume no ‘alpha’, and no asset allocation changes, just setting the initial ‘strategic’ asset allocation and then re-balancing back to this each year.
Key outcomes for 70/30 portfolio:
- Overall average returns of 8.7% pa this century (before fees)
- With inflation averaging 2.9% pa, this simple 70/30 portfolio would have returned well above CPI+5% pa (even after allowing for ETF fees), which is a typical target return for long-term ‘growth’ portfolios.
- There have been five years of negative portfolio returns this century (2002, 2008, 2011,2018, and 2022), but four out of five of these were followed by very strong rebound years.
We will report on full year returns for 2024 in January.
Thank you for your time – please send me feedback and/or ideas for future editions!
See also:
For my current views on asset classes and asset allocations - see:
‘Till next time, happy investing!