Greetings fellow investors! - Here’s my monthly snapshot on global markets for Aussie investors.
Key points:
- Another month of strong gains on global share markets, across almost all industry sectors.
- Gold and oil prices spiked briefly after the US bombing of Iran, but receded by month end. Industrial commodities are mostly down on global slowdown fears plus over-production.
- Bond yields are down on global slowdown fears, and the US dollar continues to slide as per plan.
- For the 2024/5 financial year, diversified growth/balanced portfolios posted another year of above-average double-digit returns, despite all of the dramas and scares during the year.
But first - my essential 1-page snapshot chart - covering Australian and US share markets, short and long-term interest rates, inflation, and the AUD/USD exchange rate. As usual, there are two versions – first is the traditional version on a single chart:
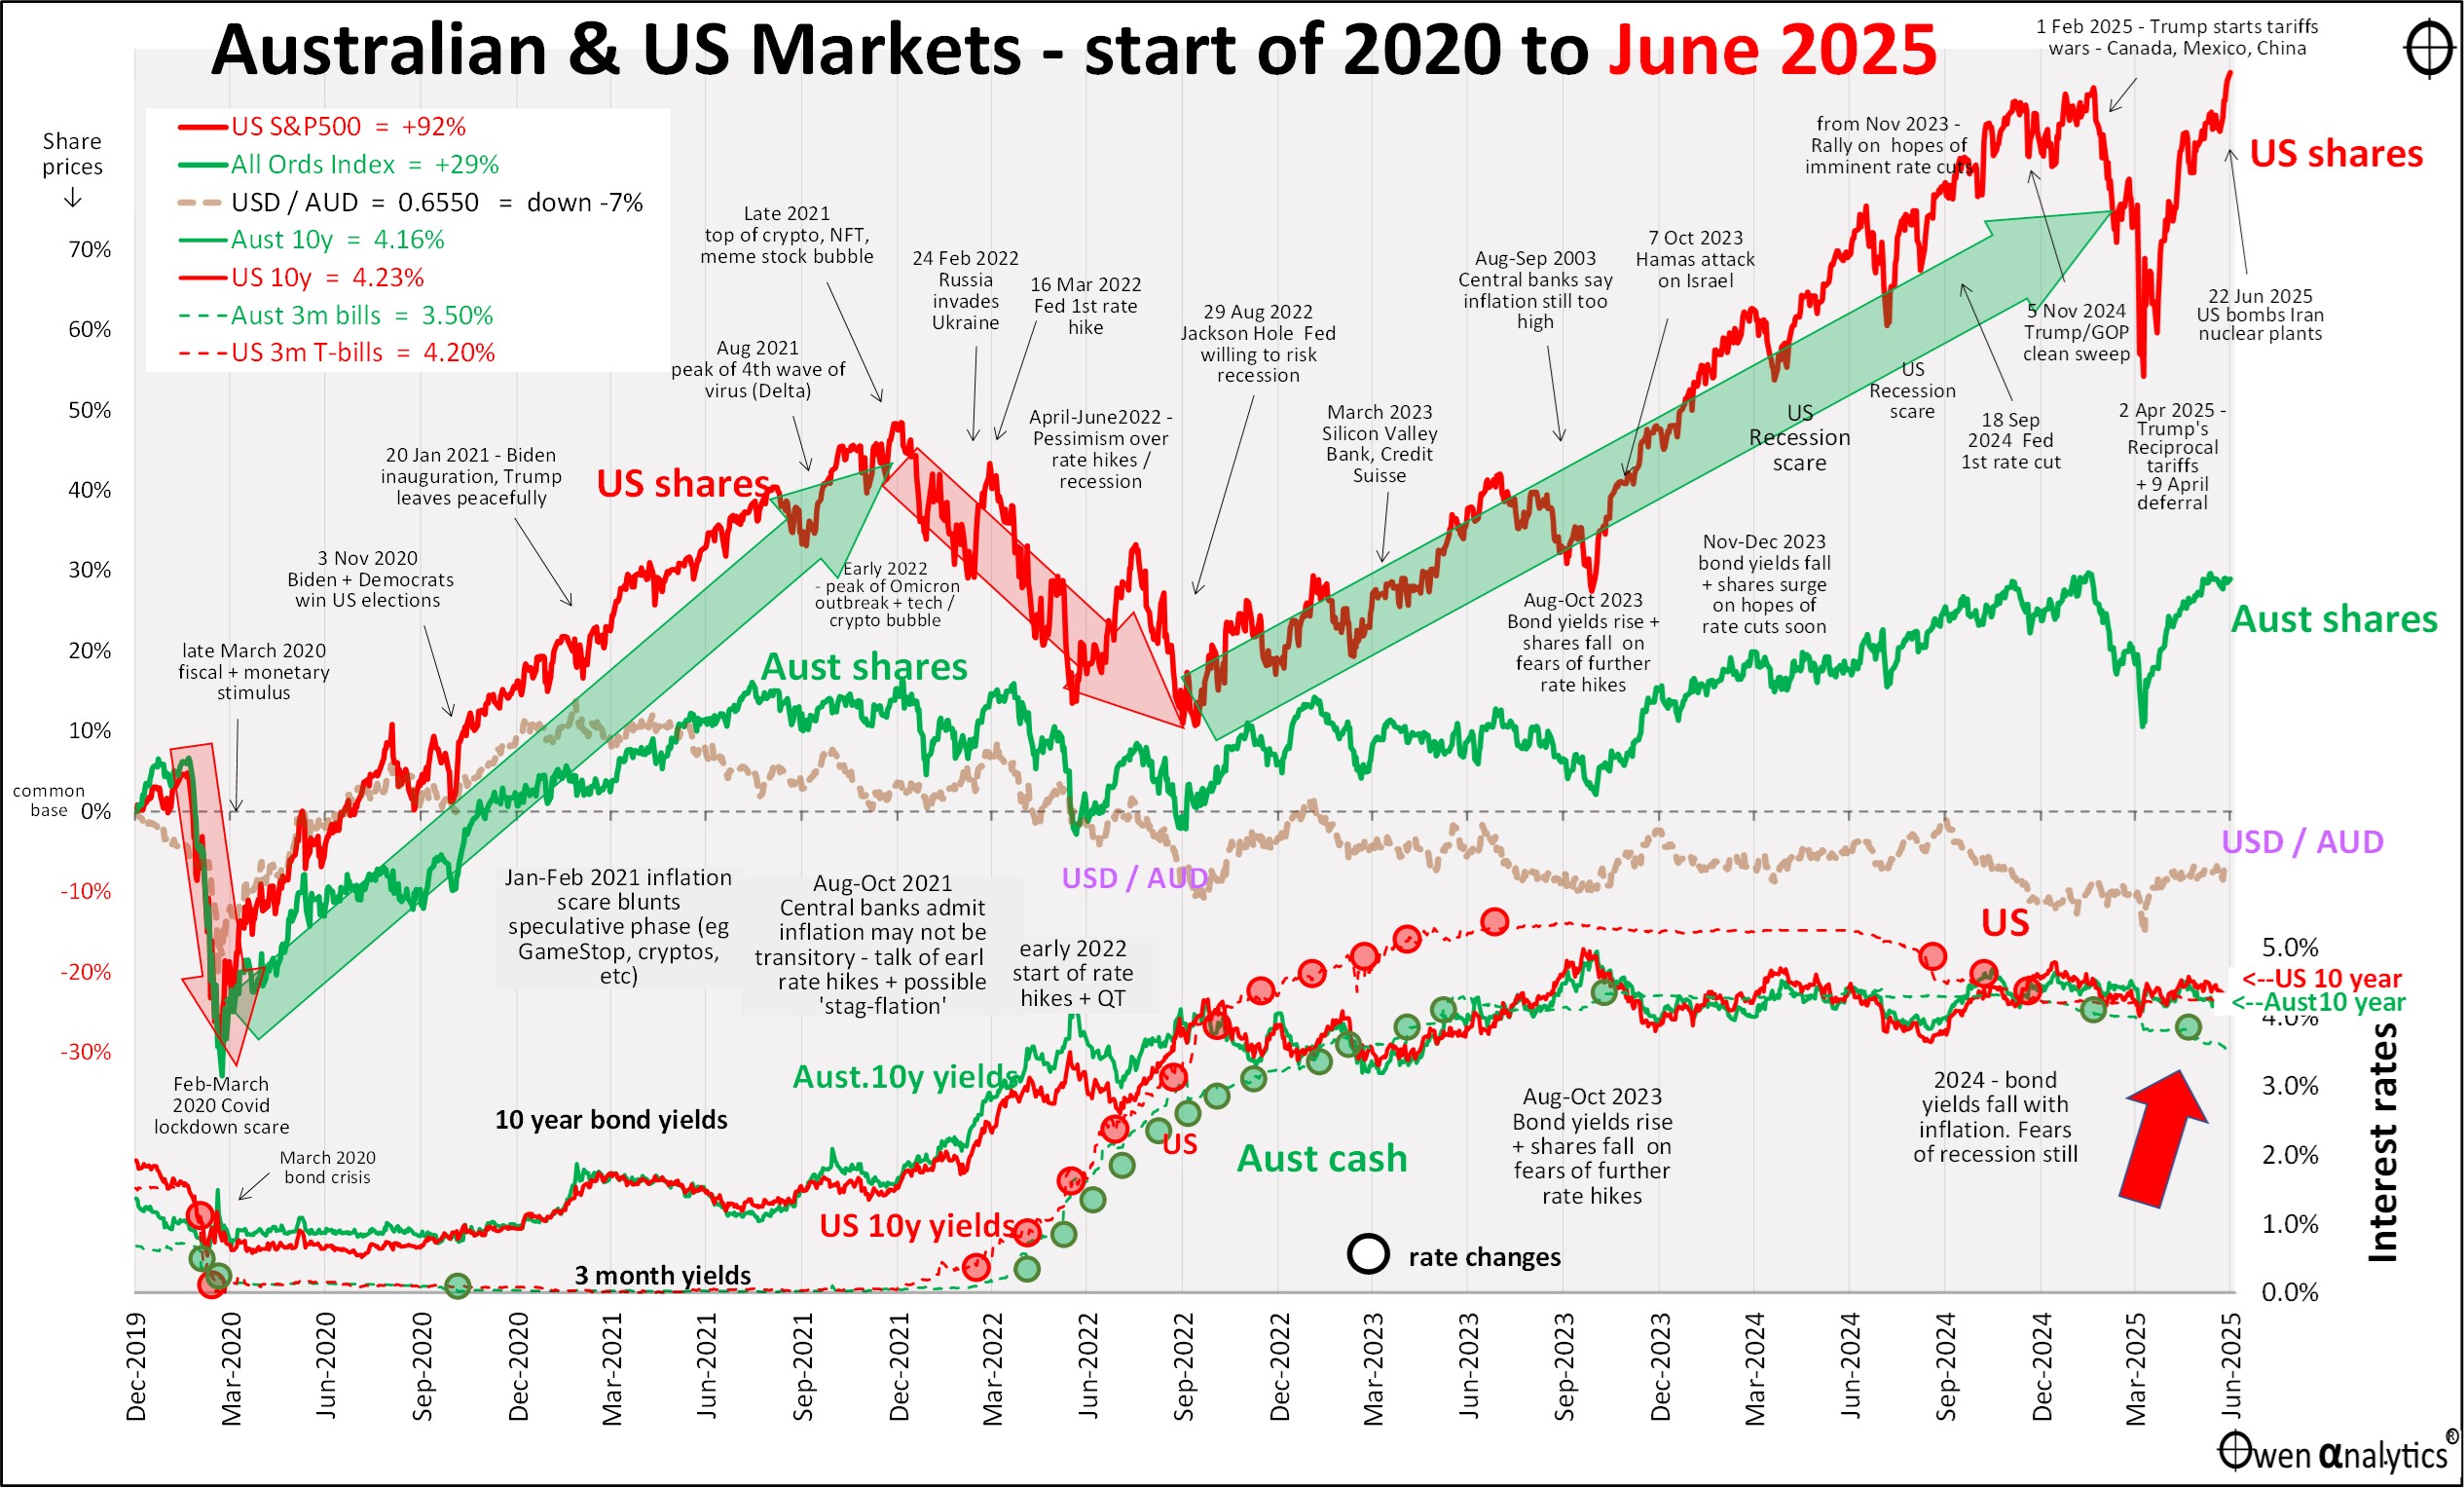
Plus the alternate version below, requested by several advisers - showing Australian and US inflation separately in the lower sections (I deal with inflation in greater detail below):

Share markets
Share markets had another strong month in June, putting most global markets into positive territory for the 2025 calendar year to date.
Industry Sectors
Most global industry sectors were up in June:
- Discretionaries (led by Amazon, Nike, Starbucks),
- Tech (Oracle, Nvidia, Intel, Broadcom),
- Comms (Facebook, Disney, Netflix),
- fossil fuels (Energy) driven by fossil fuel price rises with Middle East tensions rising,
- also stronger were cyclical sectors: financials, healthcare, industrials, materials (gold miners up but most others down)
On the other hand, Staples were down (led by Nestle, Proctor & Gamble, Diageo, Unilever) – mostly on tariff/trade fears, and REITs were flat.
Major stocks
Here is the picture for the major global stocks (all of which are US based):

After the strong gains in June (middle chart), most are ahead for the calendar year to date (right chart). The main exceptions are: Apple (growth/tariff concerns), Tesla (Trump’s removal of subsidies for EVs), and Alphabet (Google search being eaten alive by ai).
For context, here are the share prices of the so-called ‘Magnificent Seven’ stocks over the past decade (plus China’s Alibaba and Tencent) -

There is no Y-axis scale trickery going on here – the vertical y-axes all start at zero and have regular, nominal scales, highlighting their explosive growth of the US giants from very low levels in the past decade.
Only Microsoft, Nvidia, and Facebook hit new highs in June. China’s Alibaba and Tencent are up strongly in the Chinese rally this year, but are still well below their 2021 peaks. By comparison, all of the US majors are well above their previous peaks in the 2021 Covid stimulus boom.
The US tech giants are still very expensive on a range of metrics. See my recent report on how they stack up individually on revenues, profits, dividends, and pricing -
How the ‘Magnificent-7’ stack up – 8 key charts. Will I remain bullish? (28 Jan 2025)
Profits and Pricing
In the most recent profit reporting quarter (March 2025), S&P500 companies in aggregate posted good earnings growth of +13% for the past 12 months, following decent +9% growth in the previous 12 months.
Consensus forecasts for the next two years have been cut over the past month (tariff impact fears), but they are still forecasting +12% earnings growth in calendar 2025, plus another +16% growth in 2026. That’s still incredibly ambitious.
The problem is that S&P500 pricing is a very bullish 28 times trailing (past 12 months) earnings, and 26 times next year’s ambitious earnings forecasts. These are very optimistic multiples on very optimistic, accelerating earnings outlooks – a double layer of over-confidence, and highly vulnerable to negative shocks.
But so far, investors have shrugged off Trump’s tariffs, a negative quarter of US real GDP, Moody’s US credit downgrade, and the US/Iran war. Are US company earnings and investor optimism invincible?
For my full story on US profits and pricing – see:
US Shares: ambitious multiples on ambitious, accelerating profit forecasts – a double layer of over-confidence. But powering on regardless! (20 May 2025)
Major country share markets
The June quarter rally lifted all of the major markets into positive territory for calendar 2025 (right chart below):
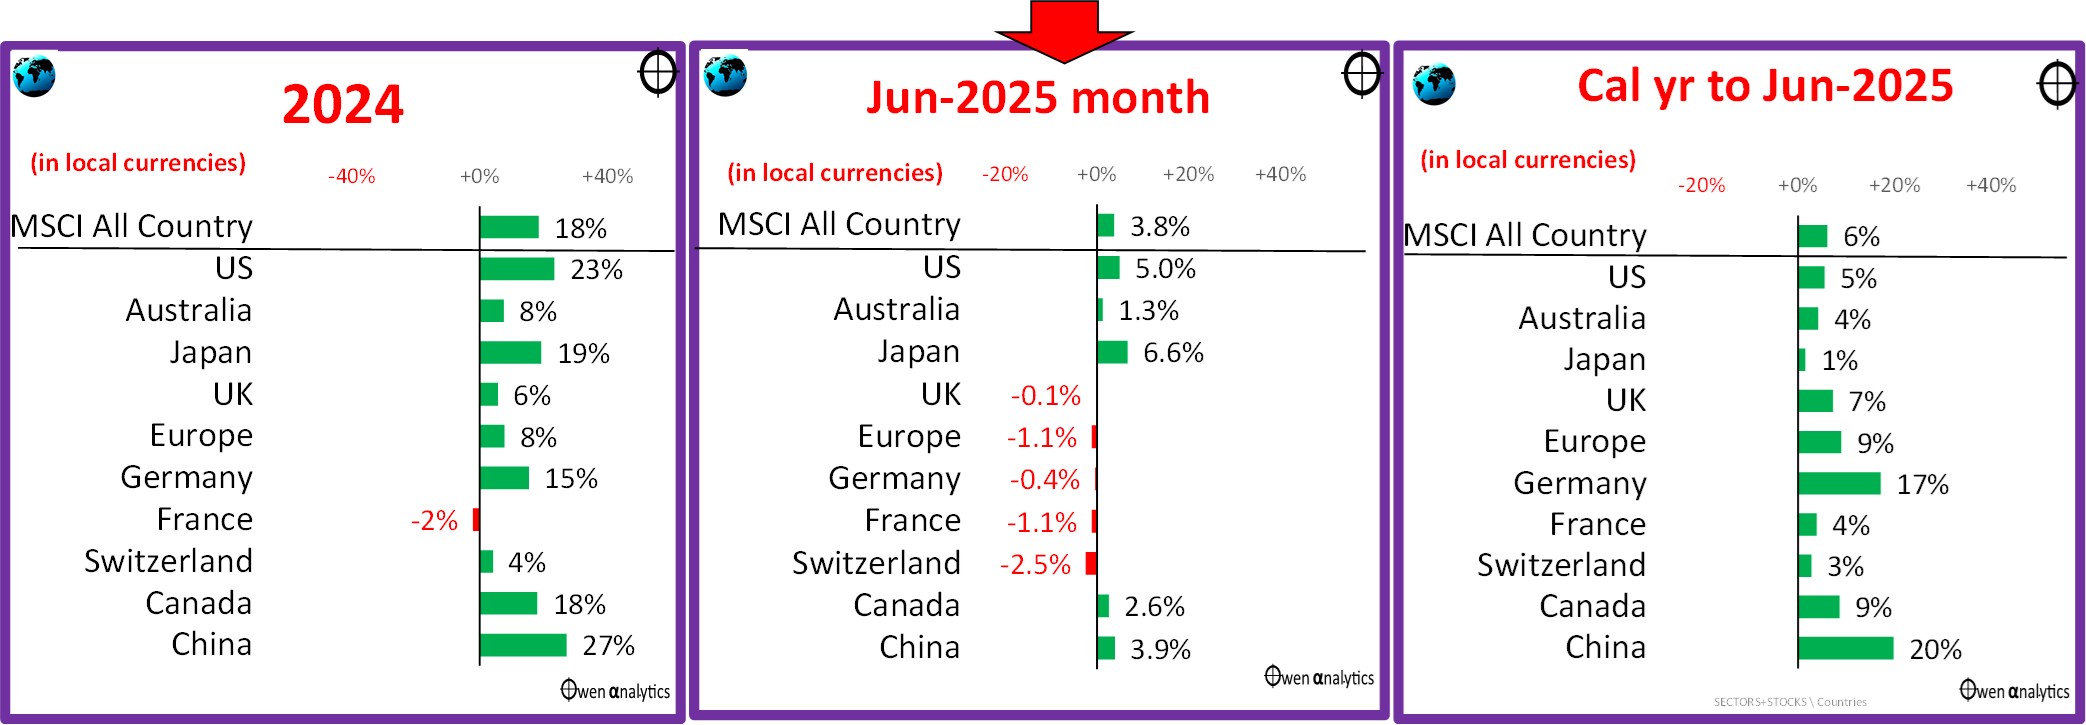
Japan is now in positive for the year after rallies in Softbank (tech holdings) and Nintendo. The Japanese market is still the global laggard this year (albeit after very strong years in 2023 and 2024), due mainly to the strong yen.
Germany is the star among developed markets so far this year – with gains in industrial giants like Bayer, Siemens, plus Allianz (insurance), and SAP (software). China is also up this year - led by Alibaba and Tencent.
I know a lot of people who switched from US to European share markets in the last couple of months, thinking US falls and Europe’s rise would continue. It may have been a premature shift.
Australian shares
The local share market was up with the rest of the world in June (middle chart below). Here are the main stocks:

The stars this year (in share price terms anyway) have been CBA and Telstra – for mysterious reasons. They are hardly growth stocks – they are the opposite of growth. CBA’s earnings per share and dividends per share have been going backwards in real (inflation-adjusted) terms for a decade. Telstra’s earnings per share and dividends per share have been going backwards for the past 25 years, not just in real terms but in nominal dollar terms as well! Shareholders seem happy to keep bidding up the share prices of these decaying dinosaurs!
(Personally, I am horribly overweight Aussie bank shares, for legacy reasons. I have not bought any more since the emergency deep-discounted GFC capital raisings in 2009.)
For my take on CBA see –
CBA in 7 charts – the ‘Steven Bradbury’ of Australian banking – now suddenly a ‘growth stock’? (29 July 2024)
The other share price star this year (Wesfarmers) at least has some growing businesses (Bunnings, Officeworks).
The big miners are in the doldrums due to weak iron ore prices, although Chinese demand appears to be holding up reasonably well a despite weak domestic construction and slowing global growth outlooks. Woodside and Santos had regulatory wins (new fossil fuel projects approved, finally), and a revival in oil/gas prices with trouble in the middle east (plus takeover bid for Santos).
Wisetech is still plagued with a debilitating founder/board battles, and CSL is still having problems with Vifor and US tariff impact concerns.
Portfolio returns for 2024/5 financial year
For the 2024/5 financial/tax/Super year, we are looking at another year of decent double-digit total returns for ‘balanced’ and ‘growth’ portfolios. Not bad, given the unusually high level of drama over the past 12 months!
My live ‘10-4 all-weather ETF portfolio’ returned 14.0% for the year (plus about 0.6% in franking credits), beating its notional benchmark (Vanguard’s Diversified Growth ETF VDGR) which returned 12.9%. (interim numbers at this stage. I will do full report this month.)
If your long term portfolio / industry fund did not post good double-digit returns like these, you need to investigate the reasons for under-performance, and make adjustments if necessary (appropriate for your particular needs, goals, risk tolerance, circumstances, cash flow requirements, tax situation, etc).
Inflation & interest rates
First, to the US market because the US drives all global markets including the ASX. After three rate cuts in September, November and December of 2024, the Fed hit the pause button and said they are in no hurry to cut rates further.
The 12-month inflation rate to May is 2.3%, but the annualised 3-month annualised rate is down to 1% pa, which is encouraging. The Fed’s preferred measure, Personal Consumption Expenditure (PCE) has now come back to 2.3%, which is encouraging.
On top of that, the US jobs market remains surprisingly strong. The unemployment rate is still at a relatively low 4.2%. Here is the US picture:
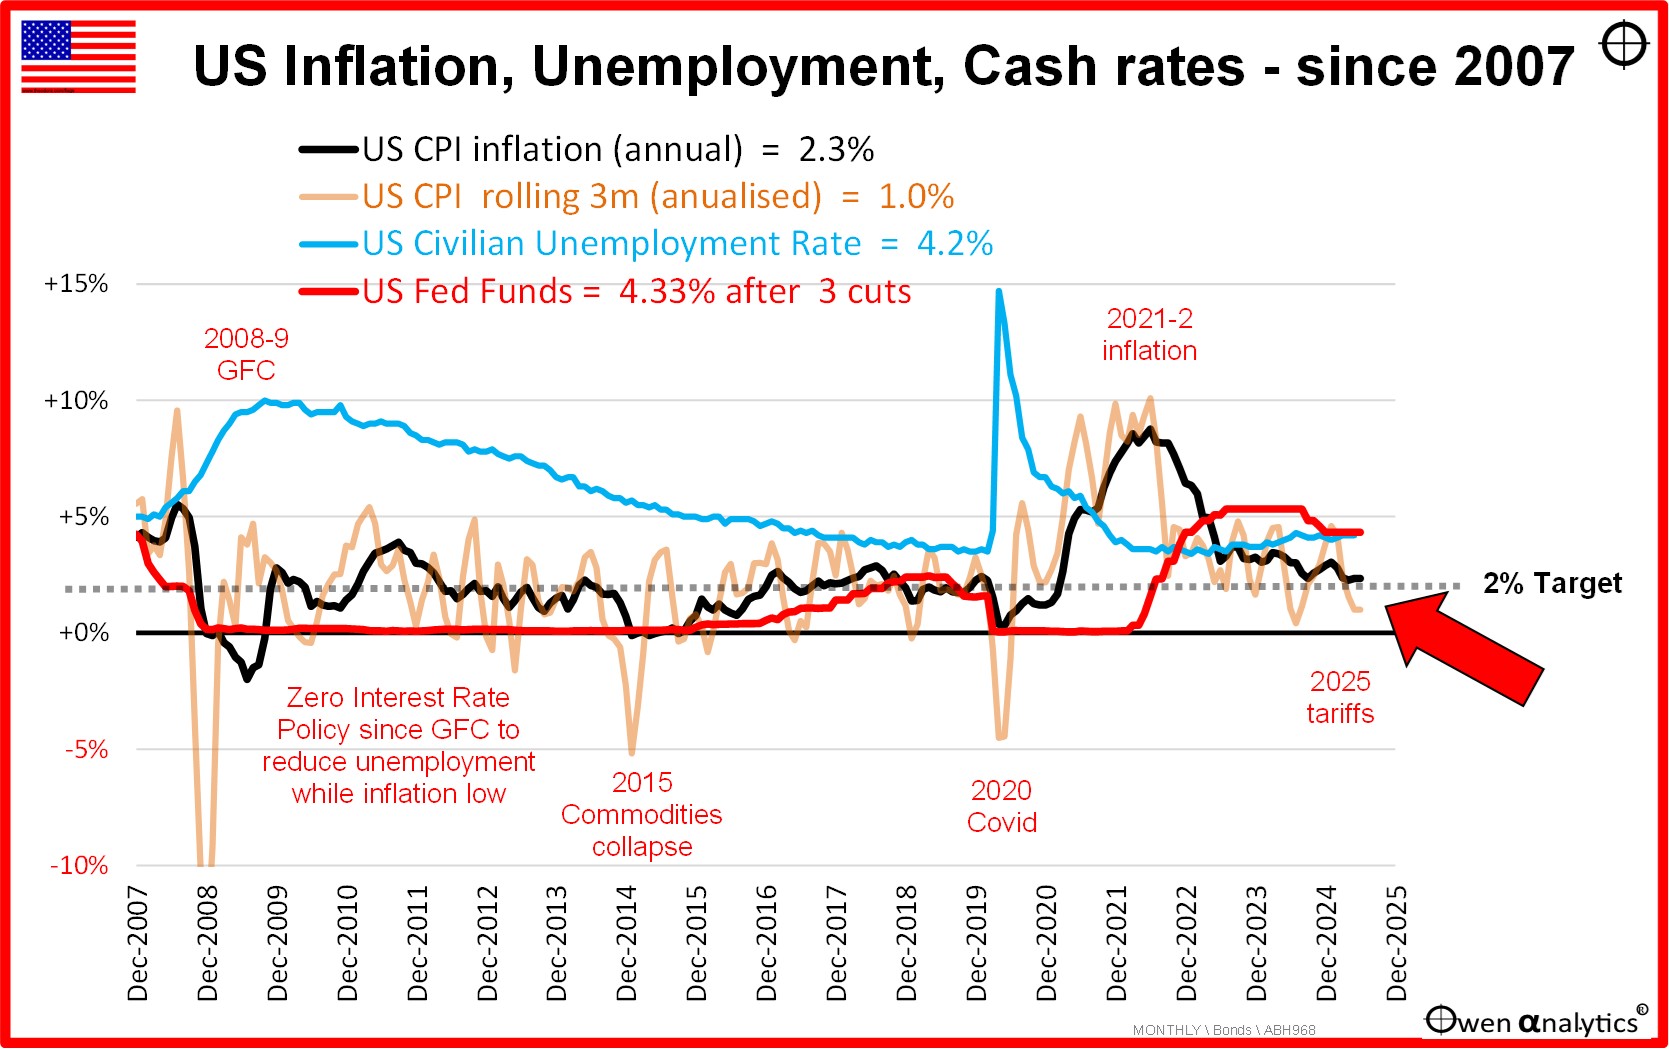
Fed chair Jerome Powell initially suggested that tariff-induced inflation in the US may be ‘transitory’, but he has since expressed concerns it may not be that simple after all. Thus far, Trump’s tariffs have not had much impact on domestic prices or inflation.
Our base case ‘TACO’ scenario (Trump Always Chickens Out) is that tariffs rates will mainly settle at somewhere around 10%, with lots of exemptions and side deals, so the impacts will be much less than initially feared.
The worst case scenario would be that tariffs slow spending, output, and employment, but the Fed is unwilling to cut rates much further (which is the usual stimulatory tool in recessions and slowdowns) because inflation remains high - the nightmare ‘1970s stagflation’ scenario.
Tariffs -v- inflation
It is important to understand that a one-off increase in prices due to tariffs (or other taxes) is NOT inflationary. For example - the one-off rise in Australian consumer prices across the board due to the introduction of the 10% GST in 2001 was NOT ‘inflation’. It was just a one-off rise in prices. A rise in CPI does NOT equal ‘inflation’.
It is highly likely that Trump had his sights set on a 10% tariff across the board (like Alexander Hamilton in 1792), and if this is where it ends up, a one-off tariff hike of 10% is not ‘inflationary’.
Why? Price rises due to taxes like tariffs only become ‘inflationary’ if they lead to a sustained ratcheting up of prices via retaliatory tariff hikes or wages. Central banks are not worried by one-off price rises. They are worried if the price rises turn into an upward spiralling of prices. The problem is that price rise spirals can quickly get out of control and change consumers’ expectations and spending patterns.
Australian inflation, interest rates, unemployment
Australian inflation also remains problematic, but for different reasons. The RBA has only made two cuts in this cycle (Feb and May 2025), while most other countries have made several more cuts as inflation has edged down.
Here is the Australian picture:
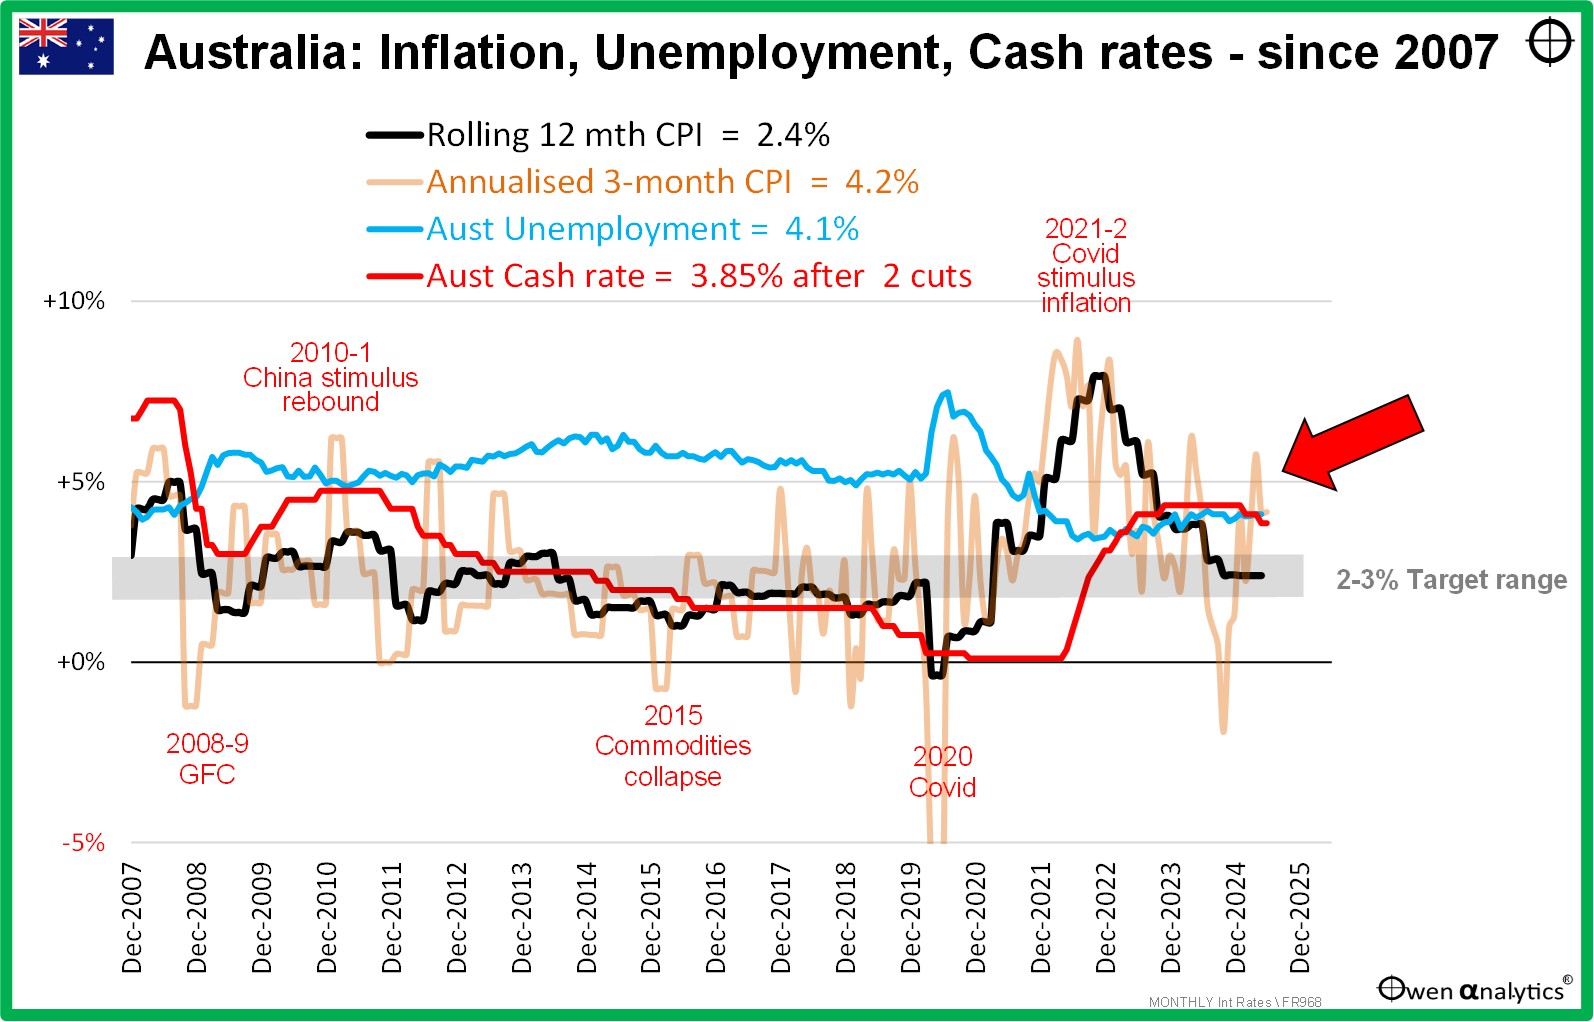
The 12-month CPI inflation rate is still running at 2.4%, but the annualised 3-month rate is 4.2%, and the RBA’s preferred ‘trimmed mean’ measure has come down to 2.4%. However, these numbers are still being artificially depressed by temporary government power and rent subsidies, and the RBA has made it clear it is not being fooled by Smiling Jim Charmer’s trickery.
As in the case of the US, the most obvious motivation for rate cuts would be a local recession, which would lift unemployment and probably soften inflation pressures, allowing (or necessitating) rate cuts.
Unemployment in Australia remains a very tight 4.1%. The RBA regards this as inflationary it is below the RBA’s non-inflationary rate of unemployment, ‘NAIRU’. ‘Participation rates’ (the number of people in the workforce as a percentage of working age population) are at record highs, but this is almost entirely due to expansionary government hiring. The government sector has been expanding, but the real economy is doing it tough.
In the real world, business insolvencies have shot up to levels not seen since the deep 1990-1 recession. Job numbers are booming in the government sector, but business is doing it tough. See my recent report on insolvency numbers in Australia –
Company insolvencies highest in 35 years - and we’re not even in ‘recession’ yet! (9-Apr-2024)
In summary - the government is artificially suppressing both the inflation numbers (with deficit-funded subsidies and hand-outs), and it is also artificially supressing the unemployment numbers (with deficit-funded jobs in the ever-expanding dead-weight, low-productivity, wealth-sapping, government sector.
Check out my recent story on the history of Federal government deficits and debts in Australia –
Labor -v- Libs: which side has a better record on Deficits & Debts? Here are the facts (26-Mar-2025)
Commodities
The US bombing of Iran was shrugged off by investors. The main impacts were on oil and gold. Oil Oil spiked above $75 briefly and ended the month 7% higher at $65/barrel (down 10% for 2025 to date).
Gold also spiked above $3,400 but receded to end the month flat at US$3,287/oz (up 26% for 2025 to date).
Iron ore fell further to below $95 per tonne, and battery metals are still in chronic over-supply, with more Chinese production hitting the market, and weak demand.
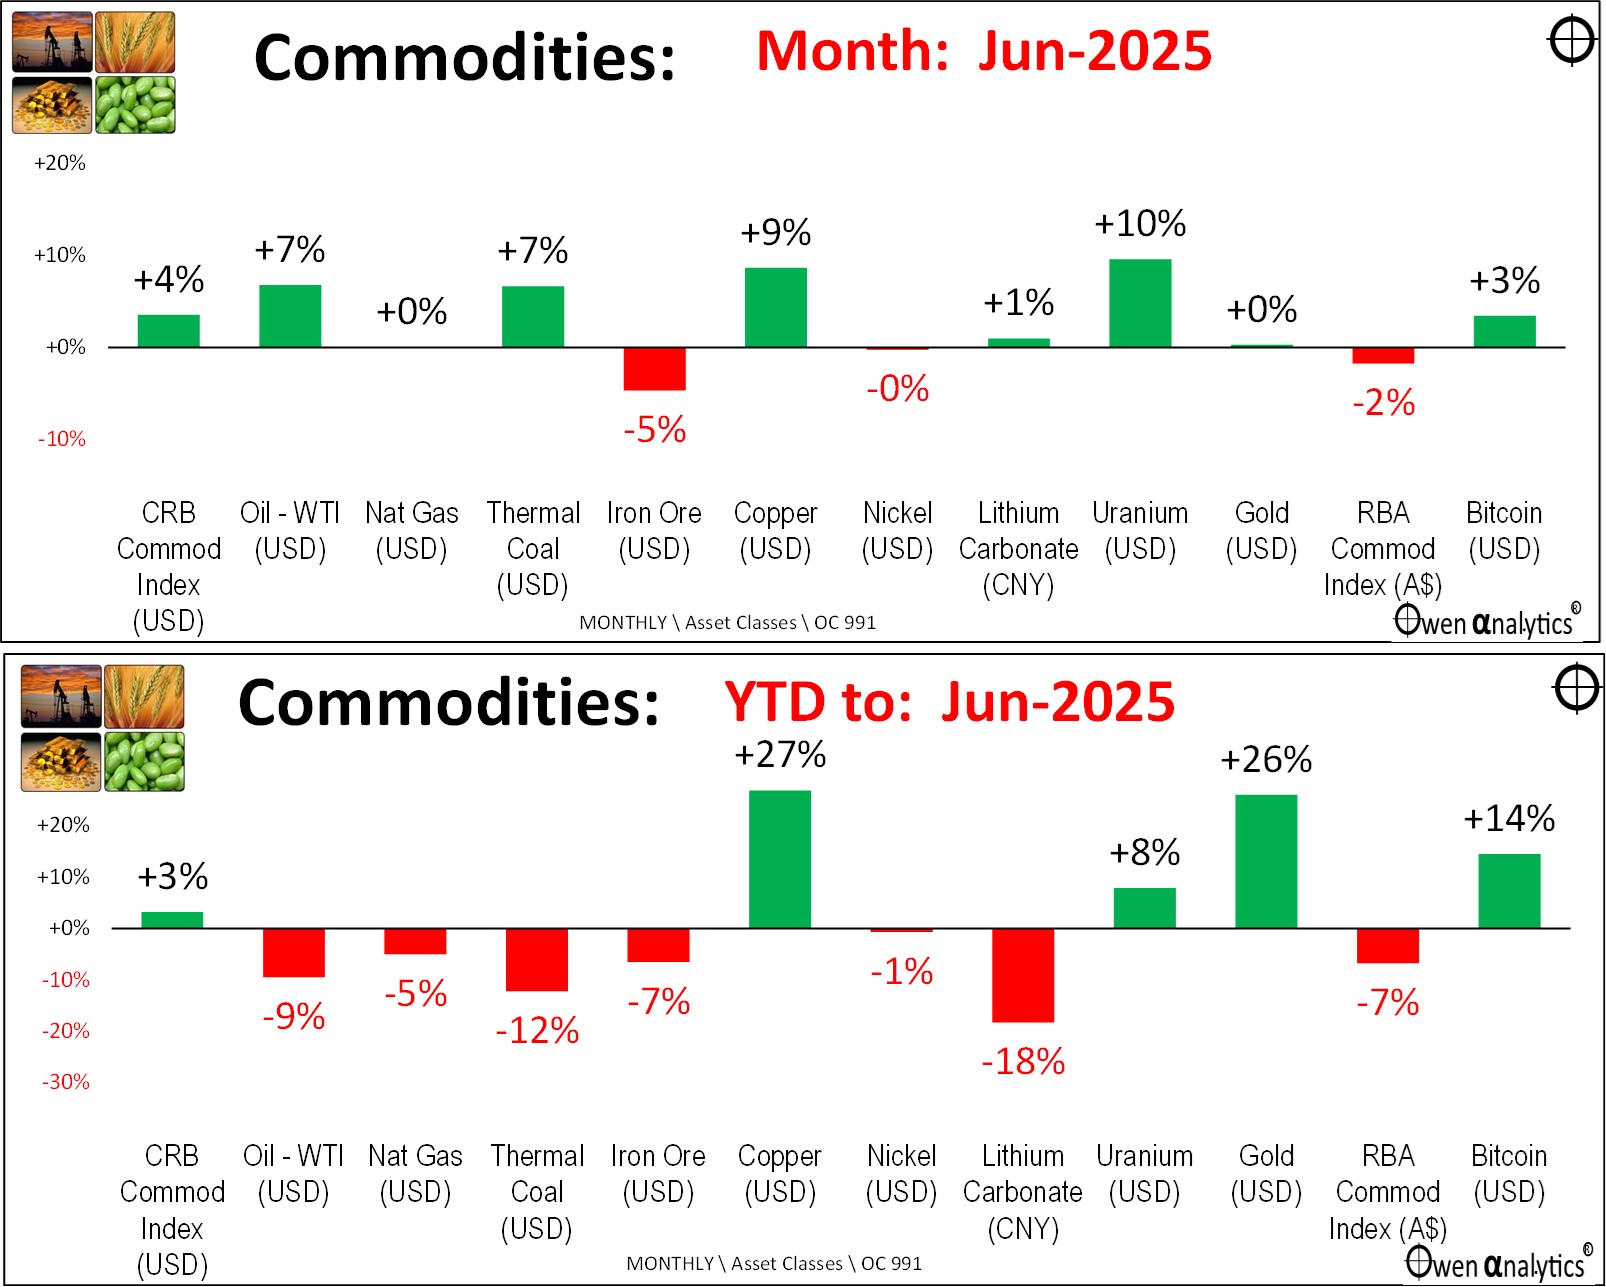
Year to date (lower chart) – all are down except Copper, which has spiked this year, mainly due to a frenzy of buying in advance of Trump’s tariffs, plus gold. . .
Gold
Gold is still the standout in the current environment. The gold price has been boosted by strong buying from central banks (terrified by the thought of US seizure of US dollar assets, as US did to Russia after its invasion of Ukraine). Also, Chinese nationals have been strong buyers of gold (after the collapse of the Chinese property market).
I put gold into diversified portfolios last year (including my own long-term ETF portfolio I publish), preferring the un-hedged AUD ETF version, so we get benefit of the falling AUD as well as the rising gold price.
But that does not mean readers should rush out and buy it now, of course! Every year we face a whole new set of challenges.
Bitcoin (right end of the charts) also got a boost from the general rise in global geo-political turmoil and US debt/dollar concerns. It is now above its peak on 11 January, Trump’s inauguration day.
Exchange rates
The Aussie dollar was stronger against the US dollar for the month, quarter, and year to date (this is the usual pattern in global share rallies).
More importantly, the US dollar continued to slide as per Trump’s plan for a lower dollar to assist US exporters. So far in 2025, the US dollar is down -8% against the Yen, -11% against the Euro, -9% against the Pound, and -2% against the RMB.
Talking the dollar down is a much more sensible and effective way to assist US manufacturers than imposing tariffs. For more on why Trump needs to talk down the strong US dollar, see –
Is the US dollar in decline? or on its ‘last legs’? – Hardly! The problem is the dollar is too strong. Implications for Aussie investors (21-4-2025)
Immediate risks
There are some short-term risks that could rattle share markets.
First - the 90-day deferral on Trump’s April tariffs expires in the next couple of weeks. The most likely outcome is a flurry of deals, and/or Trump will announce more deferrals.
Second is Iran’s response to US bombing attack.
On the up-side, Trump’s ‘Big Beautiful Bill’ is likely to pass the Senate without the dreaded section 899 ‘revenge tax’ provision. (The BBB is mainly about tax cuts primarily for the rich, cuts to social spending for the poor, increases in spending on defence and border control, and a $5 trillion increase to the debt ceiling. That’s just what the US needs - $5 trillion more debt!)
I will shortly publish a report on asset class and portfolio returns for the 2024/5 financial year. It will show another strong year of above-average, double-digit returns for sensible diversified investors.
‘Till next time – safe investing!