Here is my essential 1-page snapshot chart for Aussie investors – covering Australian and US share markets, short and long-term interest rates, inflation, and the AUD/USD exchange rate.
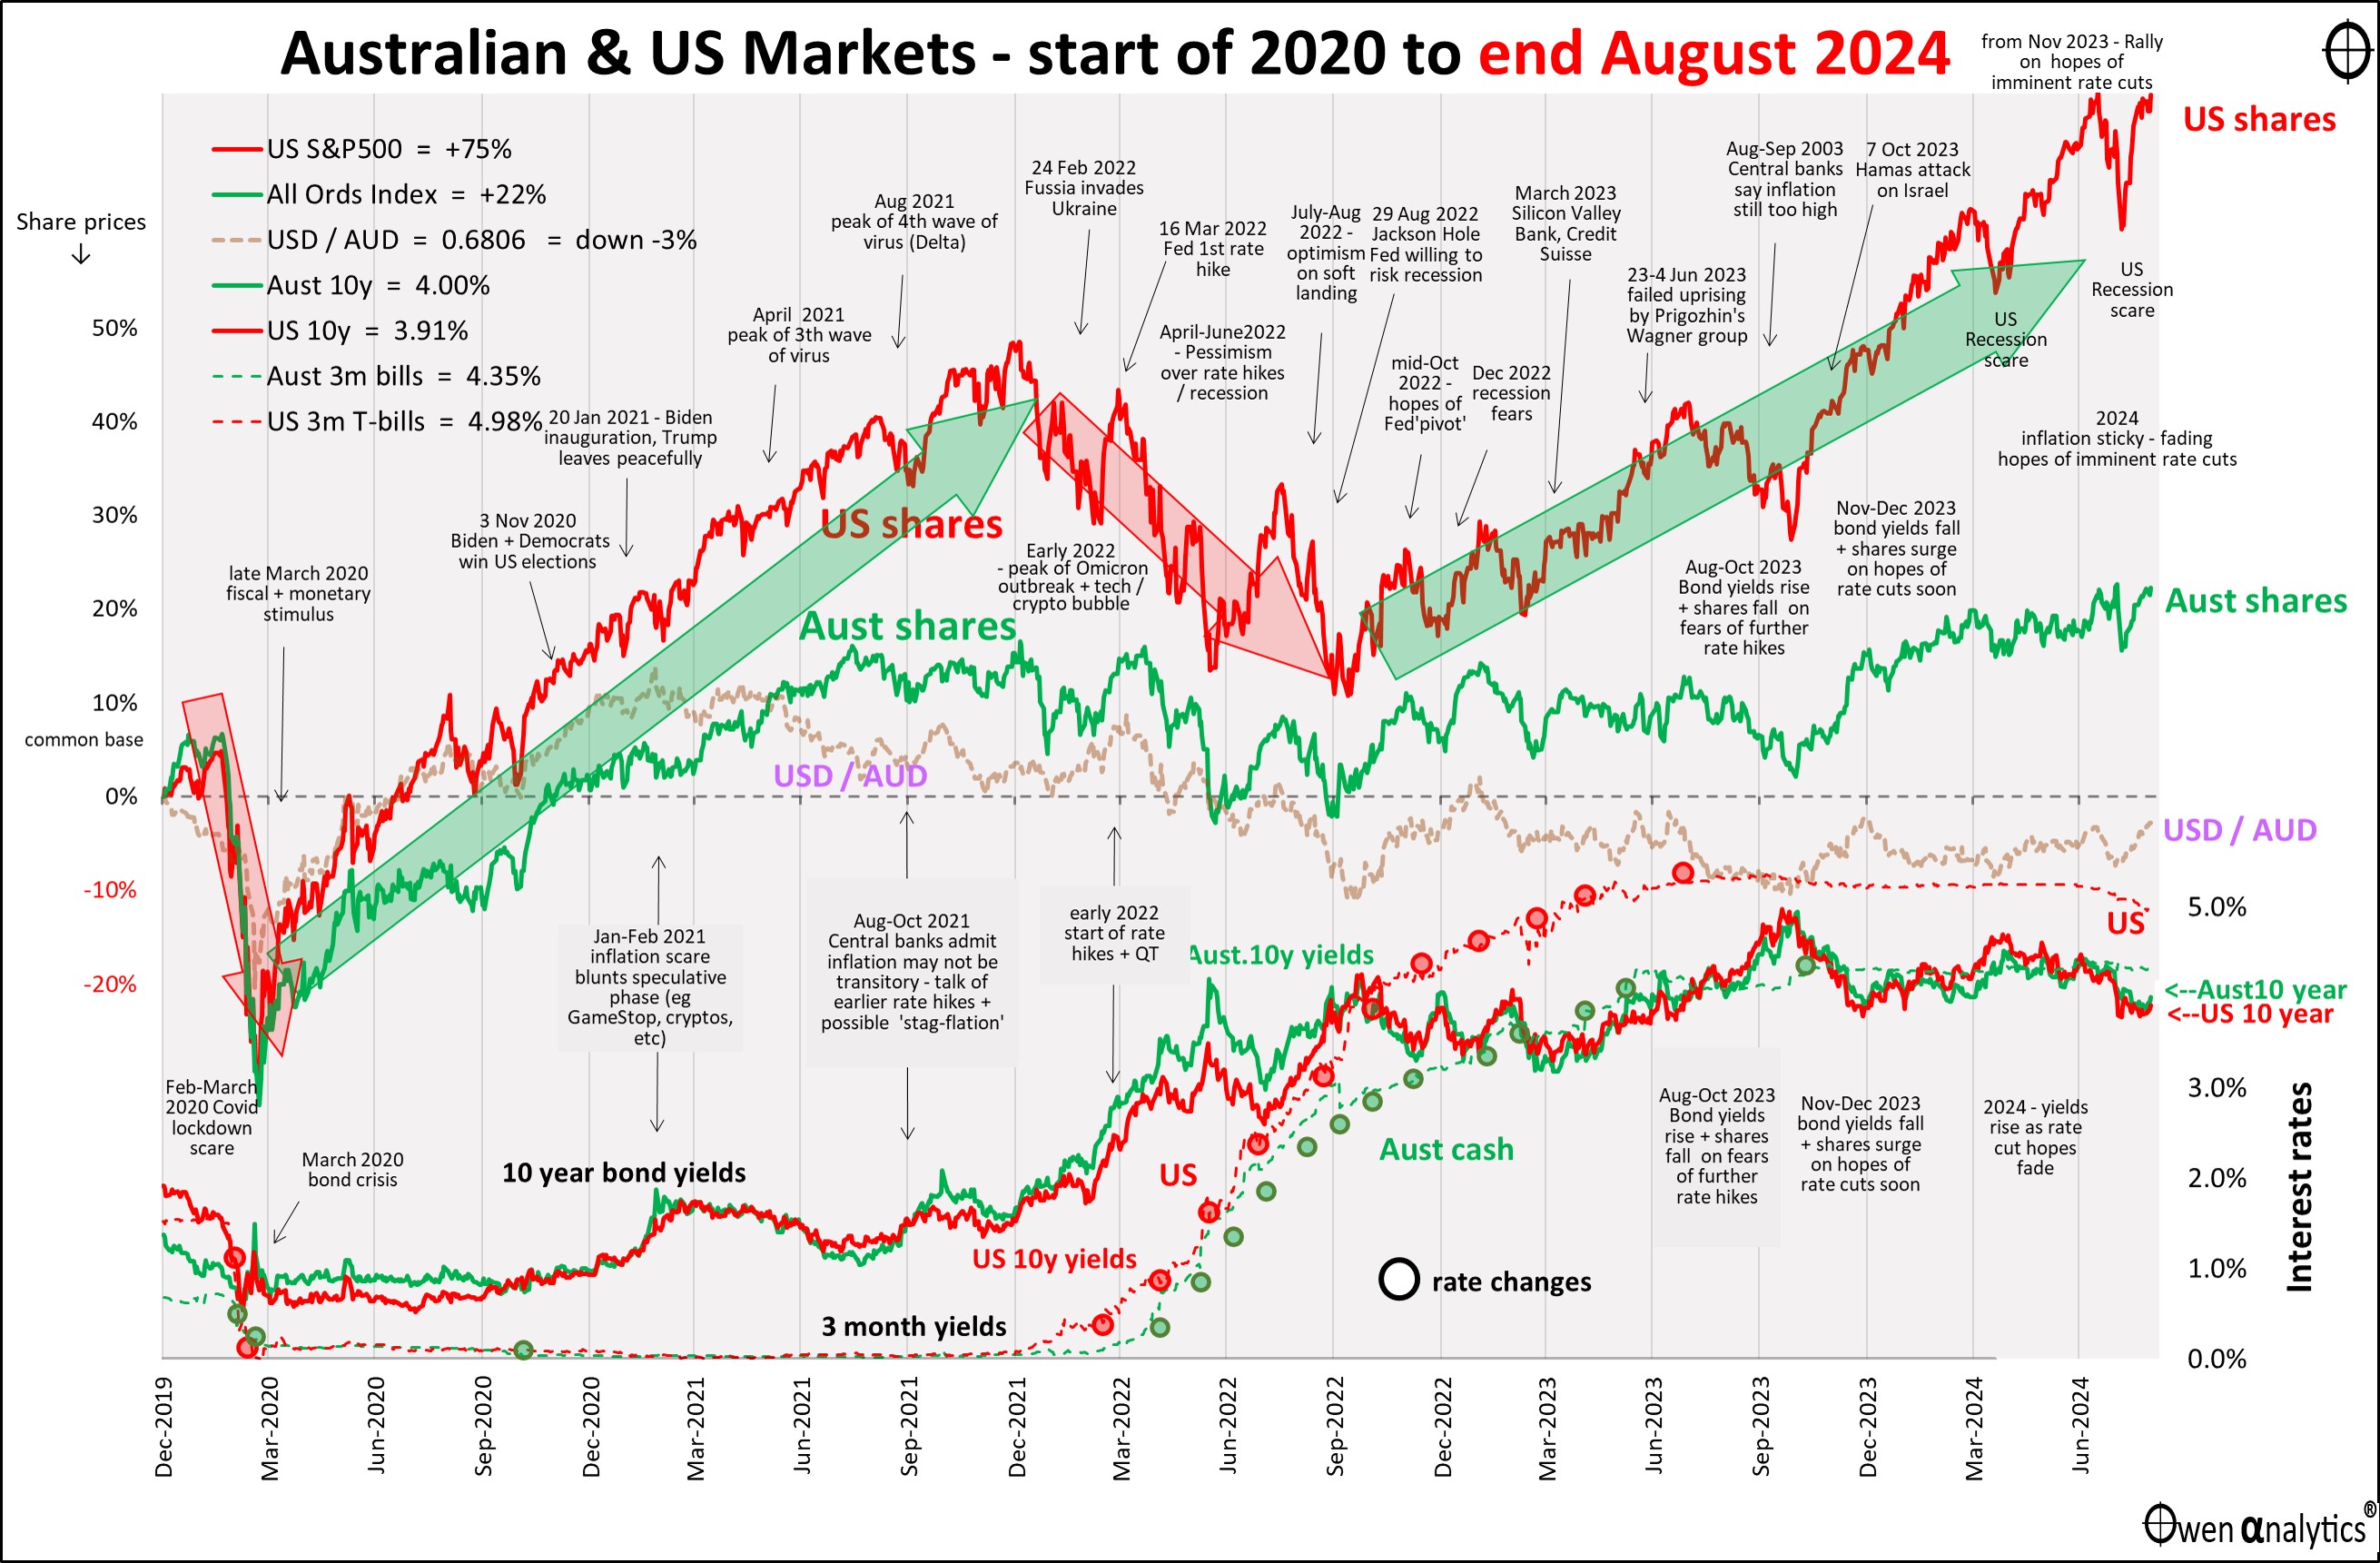
There are two versions – first is the traditional version on a single chart:
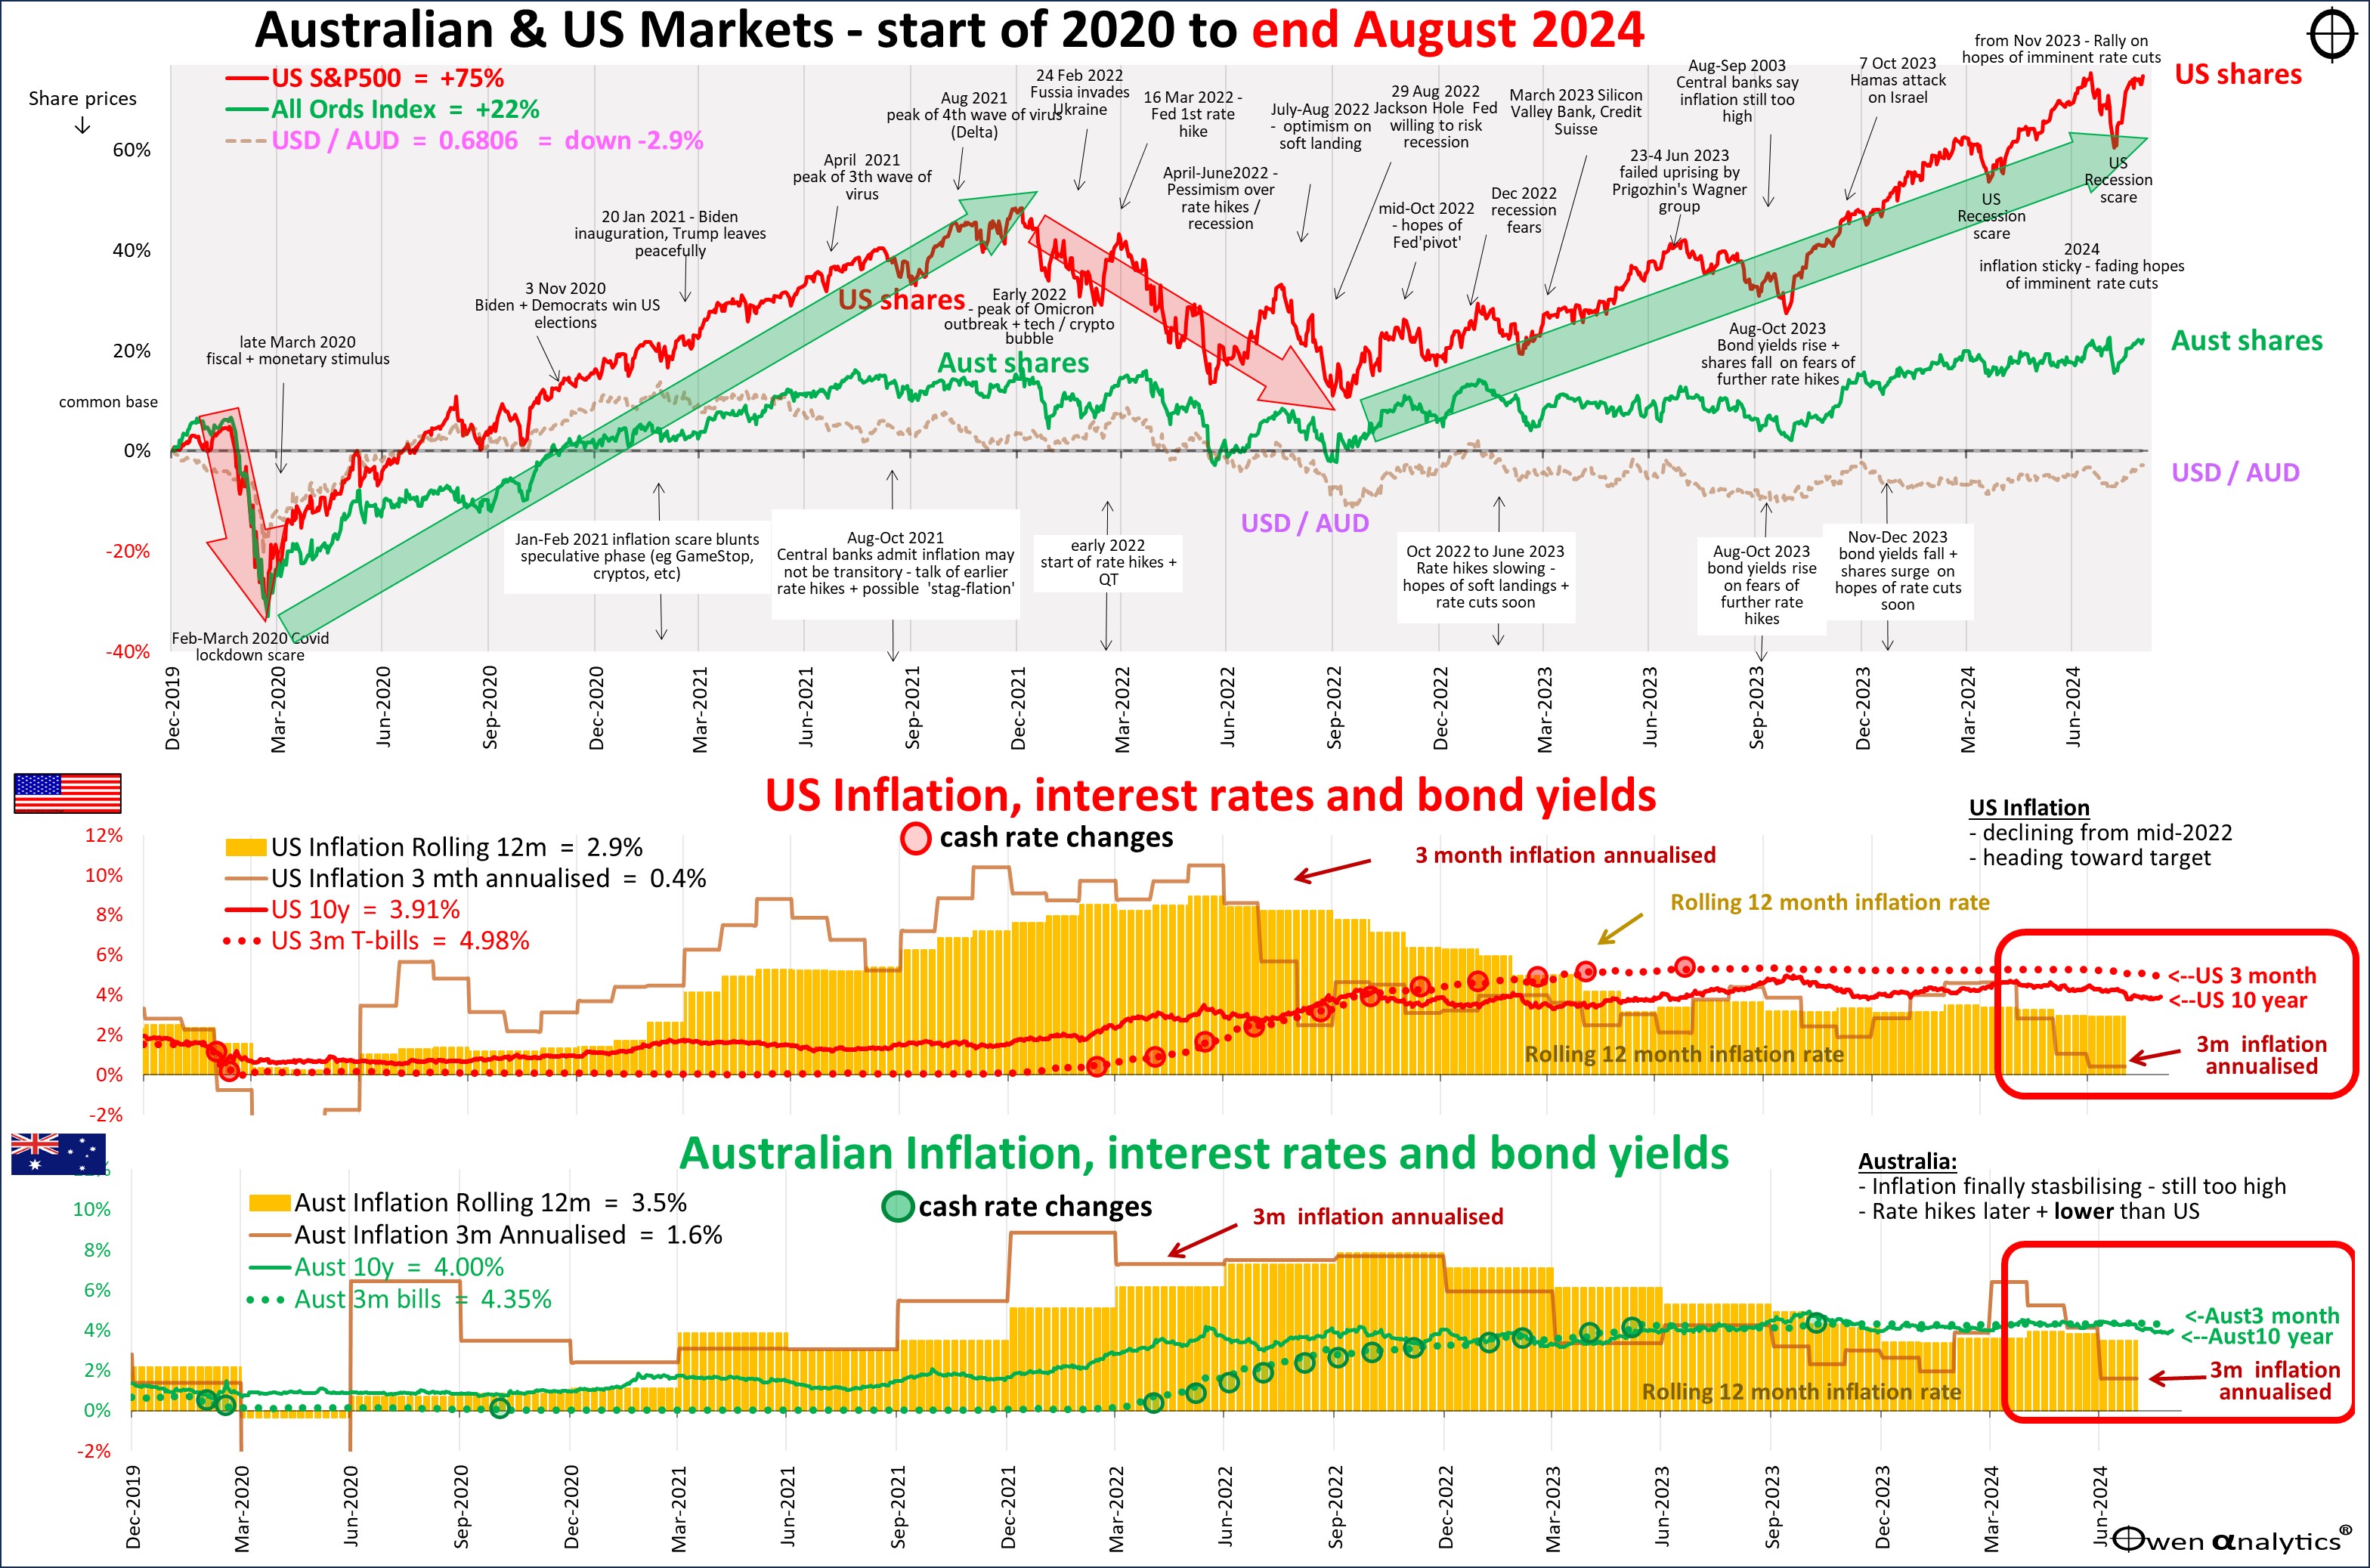
Also the alternate version below, requested and used by several advisers - showing inflation in the lower sections.
Inflation – heading in the right direction – but Australia lags
This second chart above is a little more complex (but hopefully more informative!) as it highlights the elephant in the room – inflation – the yellow lumps in the lower two sections. The orange bars are the rolling 12-month inflation rates in the US and Australia, and the orange lines are the annualised 3-month rates in each country.
In the US, inflation peaked in mid-2022, then declined for the next 12 months to mid-2023, and is now near target zone at last. The rolling 12-month rate is still near 3% but the annualised rolling 3-month rate is now down to just 0.4%, highlighted in the red box to the right of the US chart. Fed chair Jay Powell has more or less locked in rate cuts, or at least the first cut, starting in September.
The Australian picture is not as good, and different in several important aspects. Australian inflation peaked later (end of 2022), has been declining more slowly since then, but rose again in early 2024 (orange bars above the annual rate, dragging it higher). Adding to the fire we have strong jobs and wages growth, driven by government spending sprees.
In Australia, the rolling 12-month rate is still 3.5% and the annualised rolling 3-month rate is now down to 1.6%. These sound good but they are being artificially depressed by temporary government electricity rebates. The RBA has indicated that it sees through the government’s tricky attempt to temporarily depress the headline inflation numbers to get a pre-election rate cut.
RBA policy flip-flops
The RBA has done yet another policy flip-flop. For years it provided no forward guidance on future rate moves, then it tried to use guidance to lock in zero rates for three years, then when that failed spectacularly after less than a year, it vowed to not to provide forward guidance but rely on the facts as they emerged. But now it is back to providing forward guidance again! Both Bullock and deputy Hauser are saying they will retain current rates for at least the rest of this year.
Central bank credibility is sorely lacking here. In the US, the Fed provides too much forward guidance, with its ridiculous ‘dot plot’ charts that are notoriously rubbery and wrong every time!
RBA was later, slower, lower
RBA rate hikes in Australia (green dots) were later, slower, and lower than the Fed rate hikes in the US (red dots). Cash rates in the US and other peer countries have been above 5% for more than a year. In contrast, cash rates in Australia are a full per-cent lower, but our inflation is still higher.
Australian governments threw much more money at propping up businesses and incomes during the Covid lockdowns than US governments, and Australian wages systems are much more centralised. As a result, high ‘services inflation’ is keeping inflation figures elevated despite declines in ‘goods inflation’.
Rate cuts have started elsewhere in the world, including Canada, UK, Europe, New Zealand, and China (several times, to try to stimulate a stalled economy, but that’s a whole different story).
While (most of) the rest of the world is cutting or preparing to cut rates, Australia is at least not likely to raise rates further. Either way, the sentiment has been reasonably bullish for shares.
Share markets
Another striking feature of the main charts above is the fact that US shares (red line in both charts above), have beaten Australian shares (green line) buy a huge margin.
US shares (S&P500) are up a total of +75% since the start of 2020 (pre-covid), compared to just +22% for Australia (All Ordinaries Index) – highlighted in the top left corner of both charts. US shares have led the world (tech/online/a.i. giants), while Australia has lagged the world (declining commodities prices).
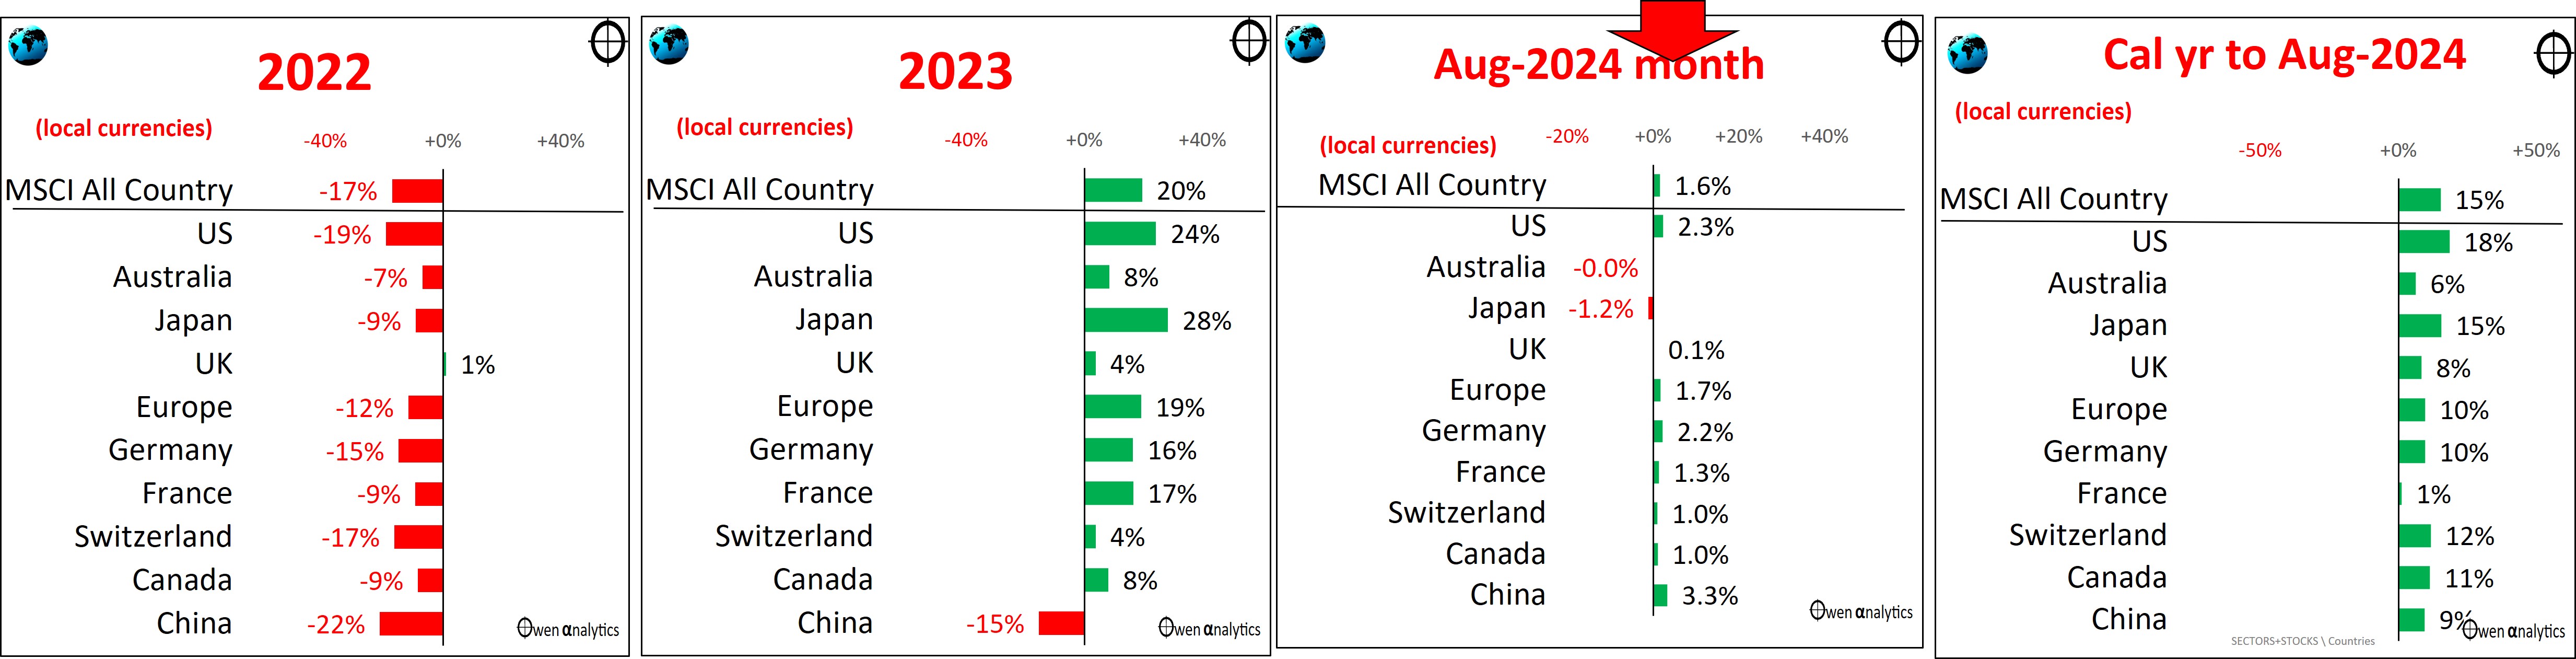
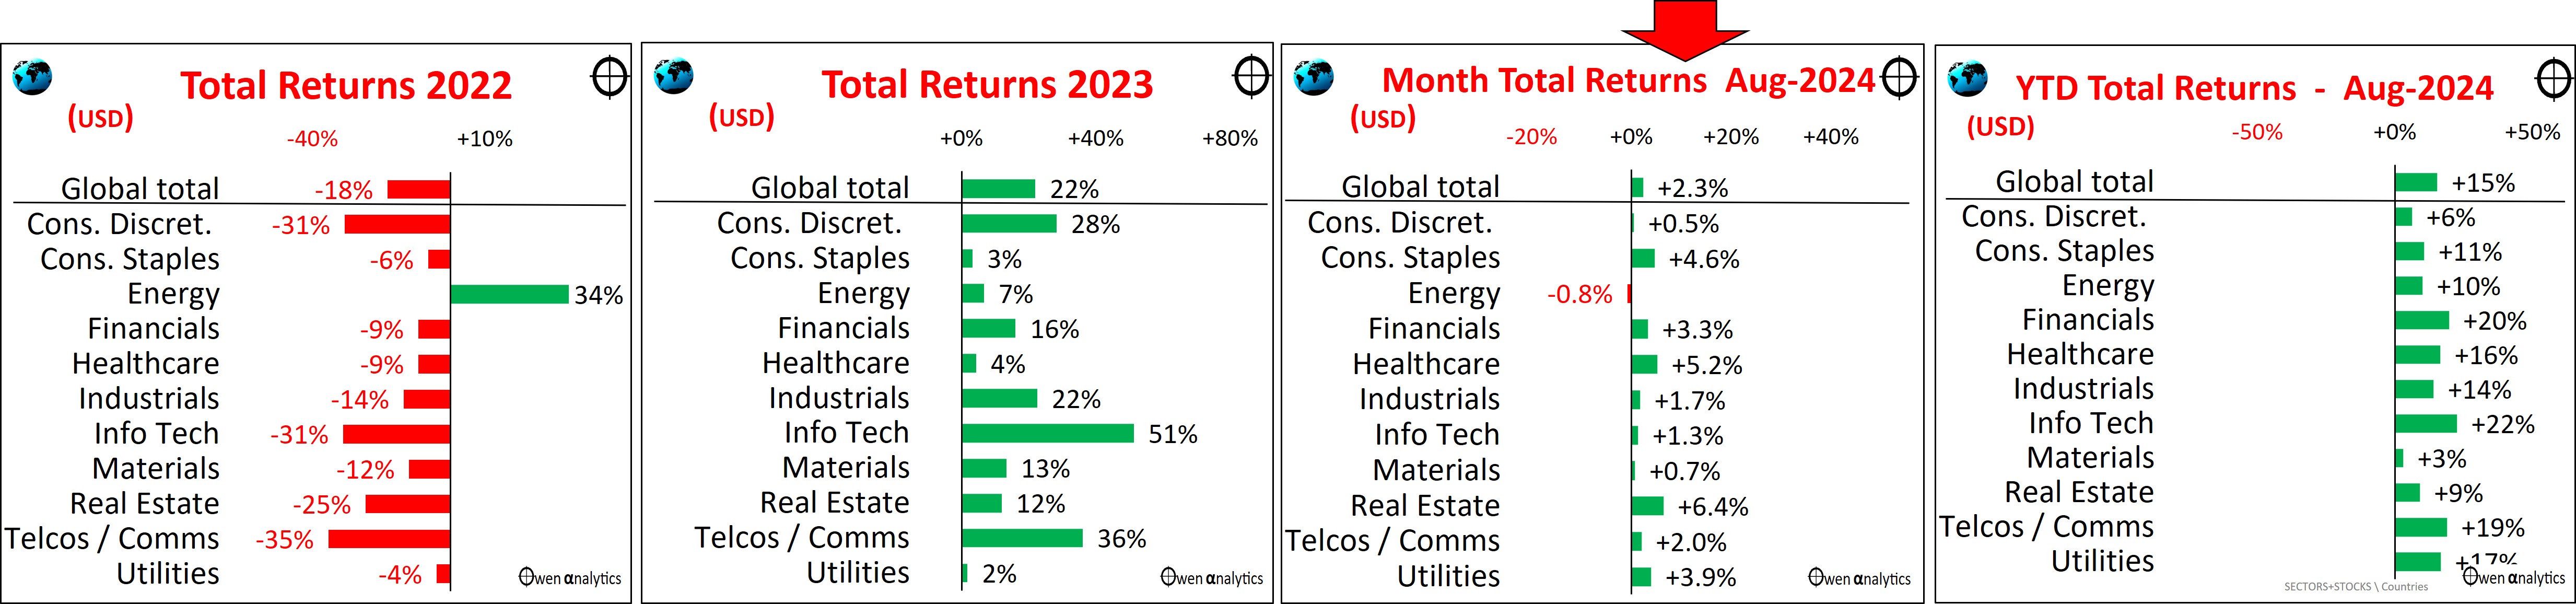
Global share markets were up a fraction in August, with most major markets edging ahead. The main exceptions were:
- Australia - flat, with iron ore prices continuing to slide on China worries, and
- Japan - down again with a surging Yen with the unwinding of the Yen ‘carry trade’.
In early August there was a very brief but sharp mini-sell-off in US and global share markets after yet another premature US recession scare. As I wrote at the time, it was nothing more than a nervous, knee-jerk reaction to a one-off piece of news that was quickly forgotten. See: BIG days on the Australian share market – but how bad was it? (5 Aug 2024)
By the end of the month, share markets had recovered and were a fraction ahead. For 2024 year-to-date (right chart above), most of the major markets are on the way to another year of above average annual returns.
By sector – all global sectors were up in August except for energy (fossil fuels), with oil prices sliding another -5% in August:
Major global stocks – were mixed in August:
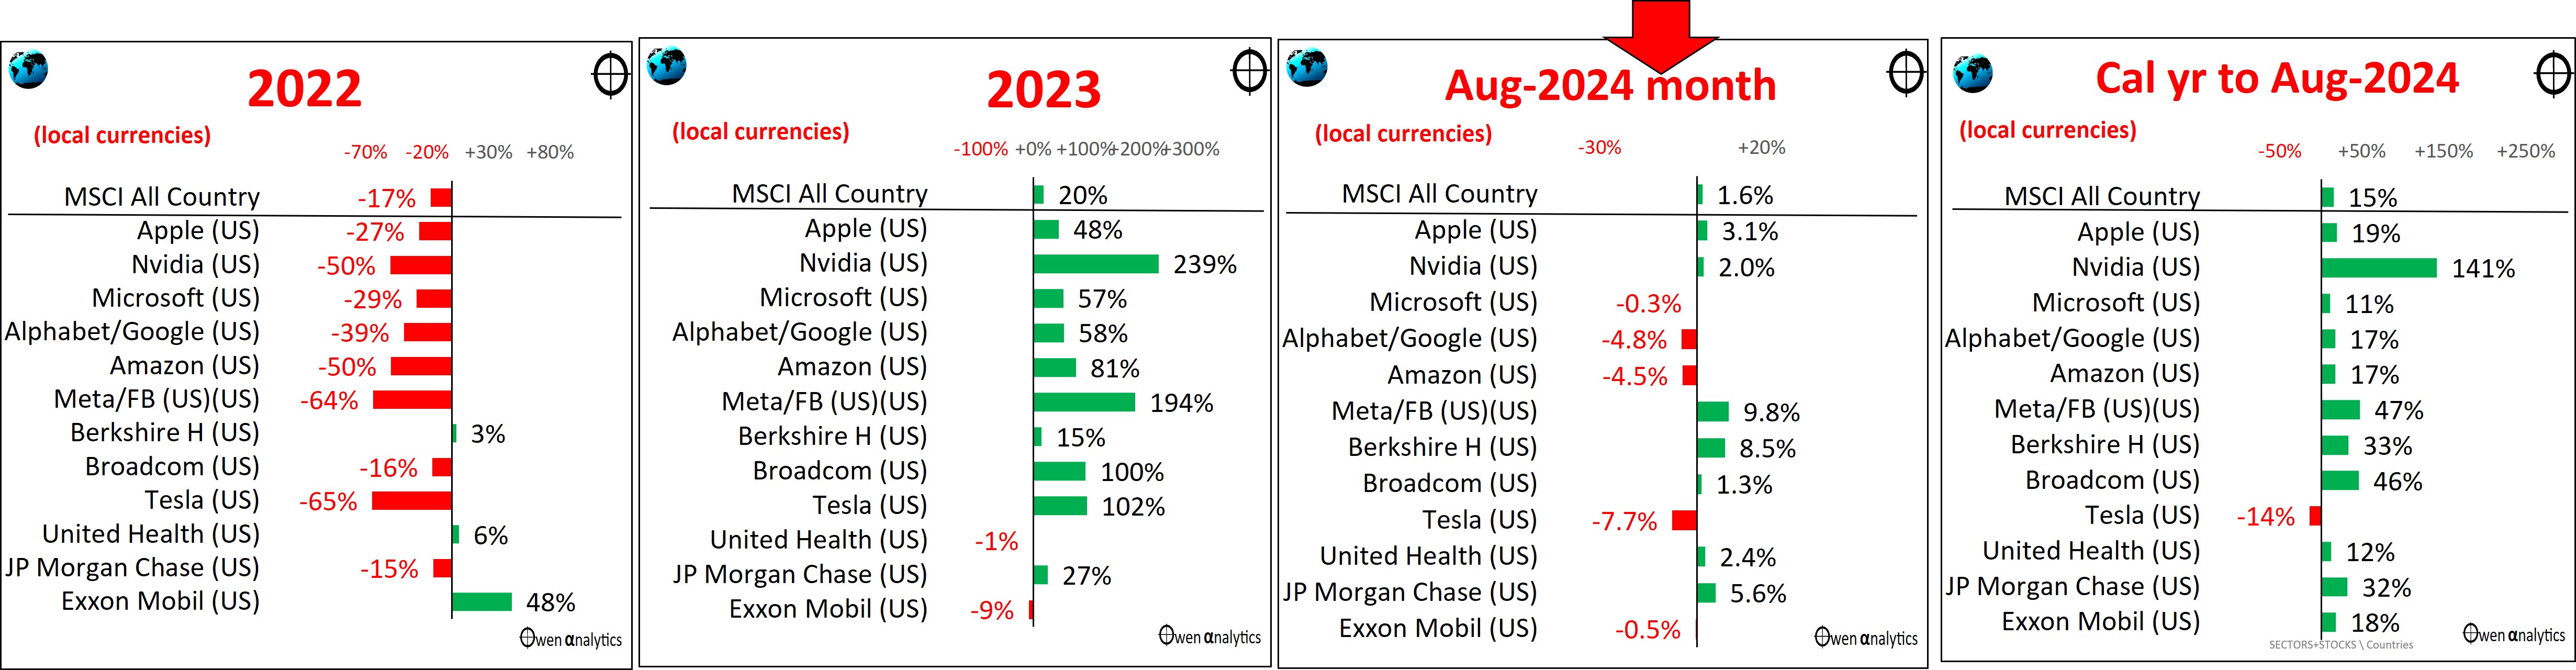
For the 2024 year to date (right chart above), most of the major stocks are heading for another great year. The main exception is Tesla, which used to be priced as a ‘tech play’ but is now just another car maker (it has lost some of its tech bubble pricing, but is still over-priced).
Australian shares – the overall Assie share market was dead flat in August, lagging world markets. The charts on the largest stocks tell a very patchy story:
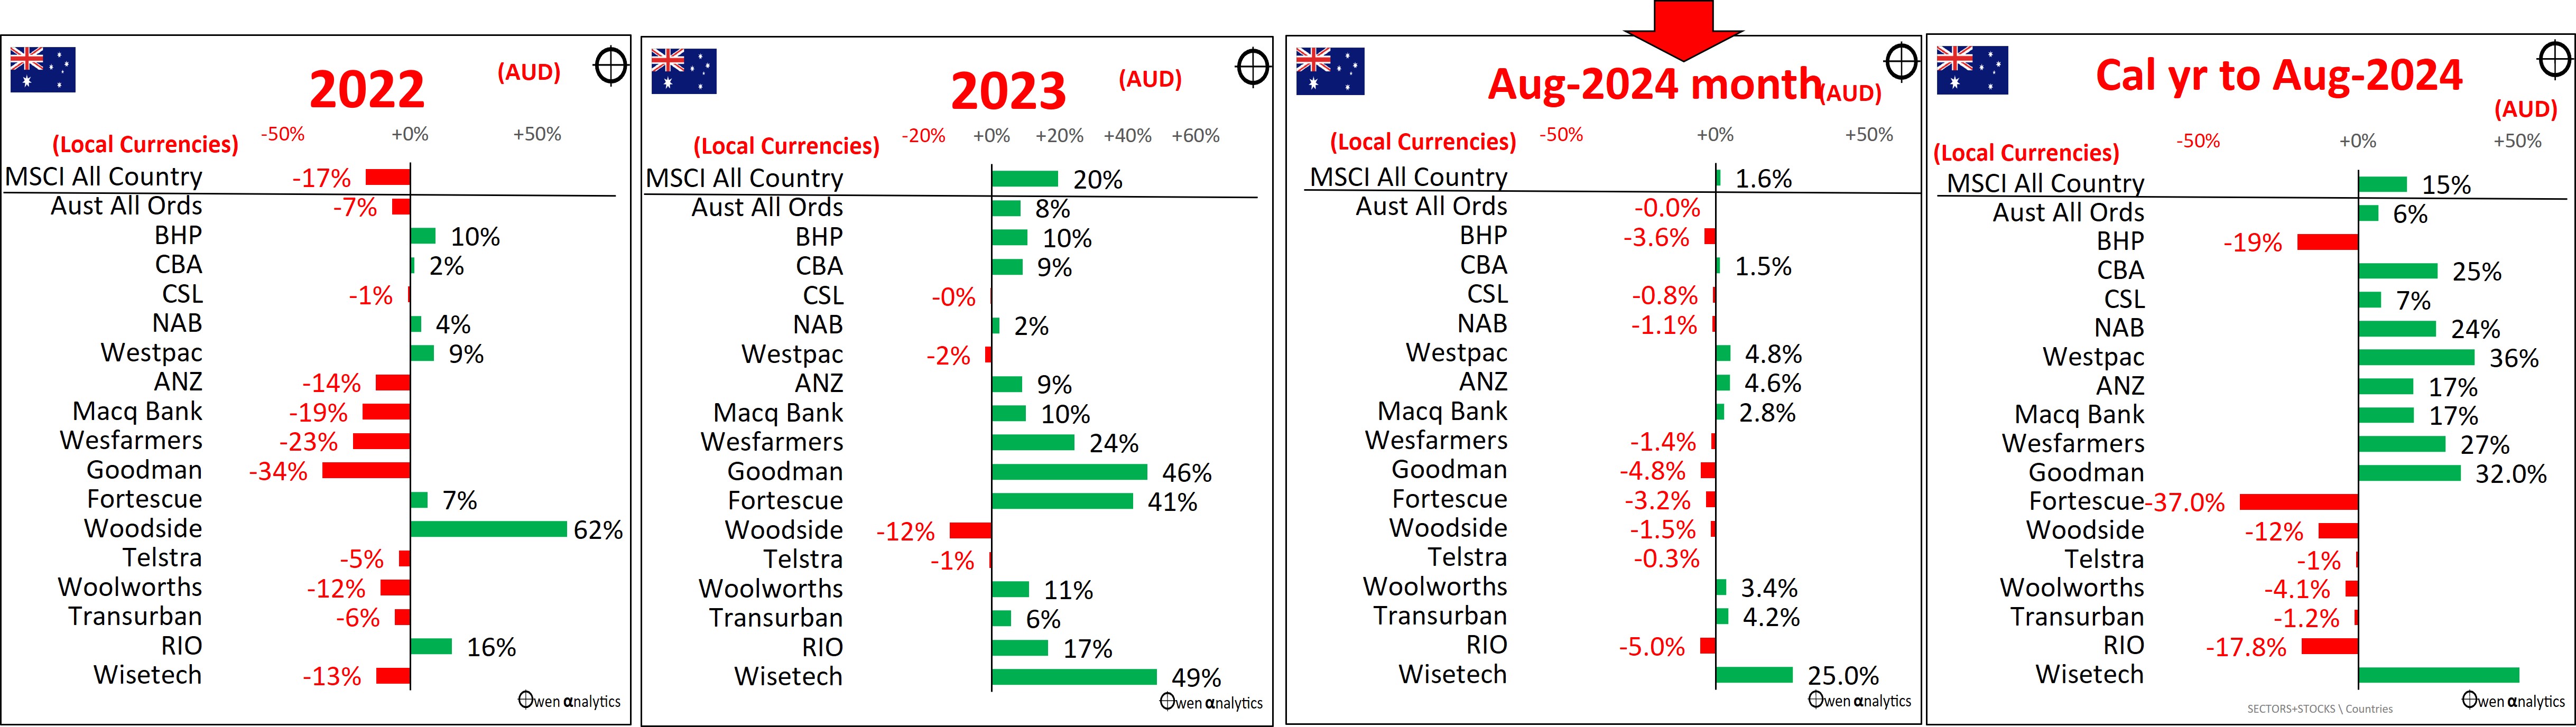
The big iron ore miners (BHP, RIO, FMG) have been the main drag on the local share market this year as iron ore prices continue to slide on China growth woes.
Profit reporting season in Australia – subdued results
August is full year reporting season in Australia (most listed companies have June financial years, and report their full year results in August). It was a fairly sobering affair – hardly the sort of stuff that would justify the overall market’s rather expensive valuation levels.
Of the 15 largest companies shows in the above charts, ten have June years and reported in August. Here is how they fared -
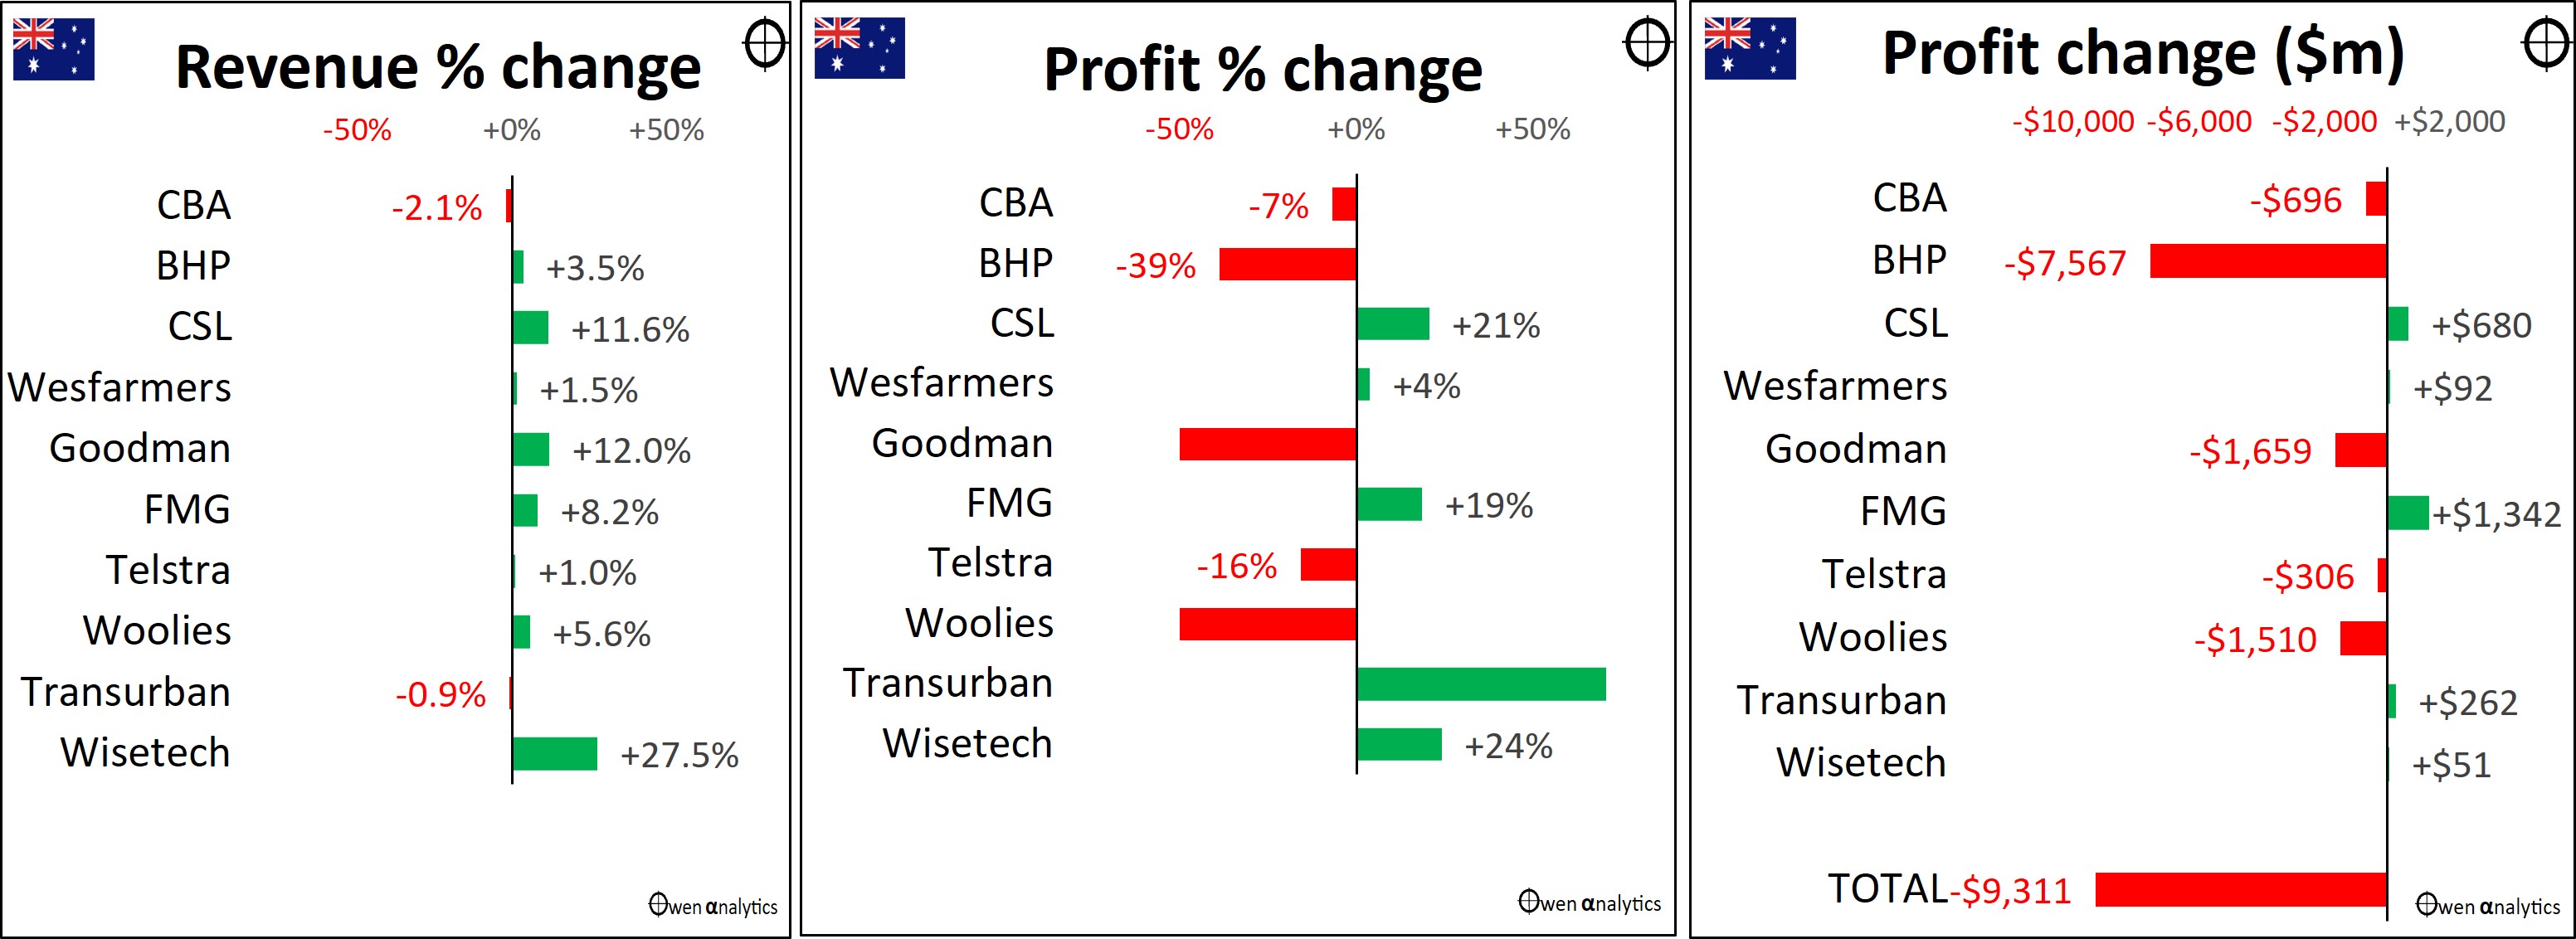
Revenue growth was ordinary overall (left chart). Changes in profits were very poor in aggregate – with these top ten companies posting a combined total of more than $9b lower profits than a year ago.
The big profit hits in BHP, Woollies, and Goodman were the result of write-offs of over-priced acquisitions or assets, which is a far-too-regular occurrence for Aussie companies.
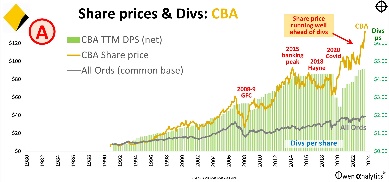
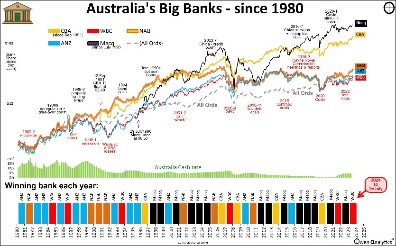
Taking Commbank (CBA) as an example – our largest bank posted lower revenues (and that’s before inflation), and lower profits, but investors bid up its share price anyway, to even more over-priced levels! Go figure.
On the puzzling boom in Aussie bank shares, see also:
Wisetech -v- Nvidia
One of the highlights of the month was watching the reactions to profit reports from Australia’s tech star Wisetech (ASX:WTC), and global a.i. chip star Nvidia (NVDA) in the US. Wisetech’s results fell short of forecasts and expectations, but its share price jumped an extraordinary 20% on the result! Why?
In contrast, Nvidia posted a very positive profit report, beating forecasts and expectations for revenues, profits, dividends, and buybacks, but its share price dropped -7% on the news! Why the difference?
Nvidia is trading on a very high 55 times earnings, but Wisetech is trading on an astronomical 150 times earnings – ie it is three times more expensive than Nvidia per dollar of profit. Both are vastly over-priced at current levels and rely on outlandish future growth assumptions to justify their current pricing.
Nvidia is valued at US$3 trillion, and is the second largest company on the planet (just behind Apple). To justify its current level of pricing, NVIDIA would have to somehow quadruple its profits (currently around US$60 billion annualised), which is a pretty tall order given it is already the second largest company in the world and already dominates the global market for super-fast a.i. chips.
On the other hand, Aussie company Wisetech would need to multiply its profits 10-fold to justify its high current valuation. Wisetech is only one one-hundredth the value of Nvidia, and it certainly does have some world-beating transport logistics software, so it has more room to grow, I guess. But will it grow its profits 10-fold to justify the current share price?
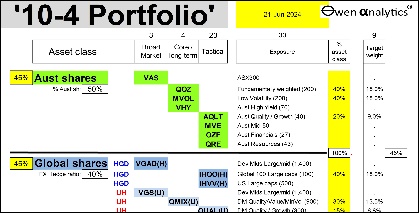
(I have nothing against either company, but I prefer to buy companies when they are good value for realistic and achievable growth prospects. My ‘10-4 all-weather ETF portfolio’ is currently over-weight Nvidia and under-weight Wisetech due to the combination of ETF holdings. See holdings here - My ‘10-4 all-weather ETF portfolio’ – Part 2: What’s in it? (7 July 2024)
Other events
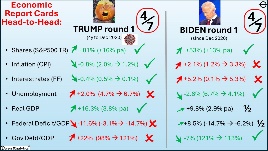
On the macro front, probably the most interesting development was Joe Biden handing over to Karmala Harris in the US presidential race. This appears to have shifted the momentum to the Democrats, but it is very early days yet. It is fascinating that Americans seem to be fixated on much more on personalities than policies. Personalities may be entertaining, but actual policies are what drive company revenues, costs, profits, interest rates, bond yields, exchange rates, etc, which in turn drive investment returns.
Trump at least is a partially known quantity from his first term. A second Trump term will probably see more tax cuts, more tariff hikes, more subsidies for local manufacturing, and less international engagement and funding/participation in foreign wars. Harris is less of a known quantity. She has given little away on policies, but appears to have some long held ambitions to increase social spending, control grocery prices to reduce ‘gouging’, and raise taxes. Trump cut the main corporate tax rate from 35% to 21% in his last term and has promised to cut it further to 15%, while Harris has promised to increase it to 28%)
Both sides appear to have completely abandoned any thought of fiscal responsibility, so we can expect more huge budget deficits and government debt issuance in the coming years, regardless of whom is in the White House. The other big factor in the mix will be which side controls the House and Senate.
November 5 is still a long time away. I am not buying nor selling anything, nor changing investment strategy based on what might happen in November.
‘Till next time – happy investing!
Thank you for your time – please send me feedback and/or ideas for future editions!
See also:
For my current views on asset classes and asset allocations - see: