Today (Monday 5 August 2024) the Australian share market fell by -3.8% (All Ordinaries Index, the broadest market measure). It was its worst day since May 2020, in the depths of the Covid lockdown panic.
Despite the usual shock-horror media headlines screaming ‘$70 billion wiped off our savings!’, it was actually not that bad of a day in the grand scheme of things. It only seems dramatic because the share market has been unusually calm for the past few years.
How bad?
Today’s fall just takes the market index back to where it was in May of this year, so it has lost only three months of gains. Given the local market was over-priced to start with (on a host of different measures), the last couple of months of gains were probably always just temporary anyway. (More on this later.)
(As a long term investor I focus more on underlying fundamental value rather than daily price volatility, but price volatility is certainly very useful in providing buying opportunities.)
Today’s -3.8% fall was the 26th worst day this century (ie there have been 25 worse days), and the 49th worst day in the past 100 years. So it was not all that bad. Certainly not enough to warrant the shrill media headlines.
Even if we add Monday’s fall to last Friday’s fall of -2.1%, and pretended it was a single day’s fall of -5.88%, this still would not make it into the top 10 big falls this century. A combined Friday-Monday fall would be the 11th worst day this century, and the 20th worst day in the past 100 years.
‘Big days’
Let’s take a look at what real volatility looks like. In addition to theoretical measures of volatility (like the academic ‘standard deviation’), there are also several more practical and meaningful measures.
(Ok, since you asked: the ‘annualised standard deviation’ of a return series is the square root of the sum of the squares of the arithmetic differences between the natural log of the return each period and the natural log of the mean period return, multiplied by the square root of the number of measurement periods per year. See!).
A much simpler, more practical, and intuitive measure of volatility is the number of ‘big days’, and we can set any threshold we like for determining what is a ‘big day’.
In today’s chart I define a ‘big day’ as a daily price move of 5% or more above or below the previous day’s closing level. Today’s chart covers the 27,539 trading days since the start of 1920. (For readers now diving for their calculators, remember that before 1 January 1947, the Sydney Stock Exchange traded six days per week!)
With this 5% threshold, there have been 16 big ‘up’ days and 23 big ‘down’ days over the past 100 years for the broad Australian share market.
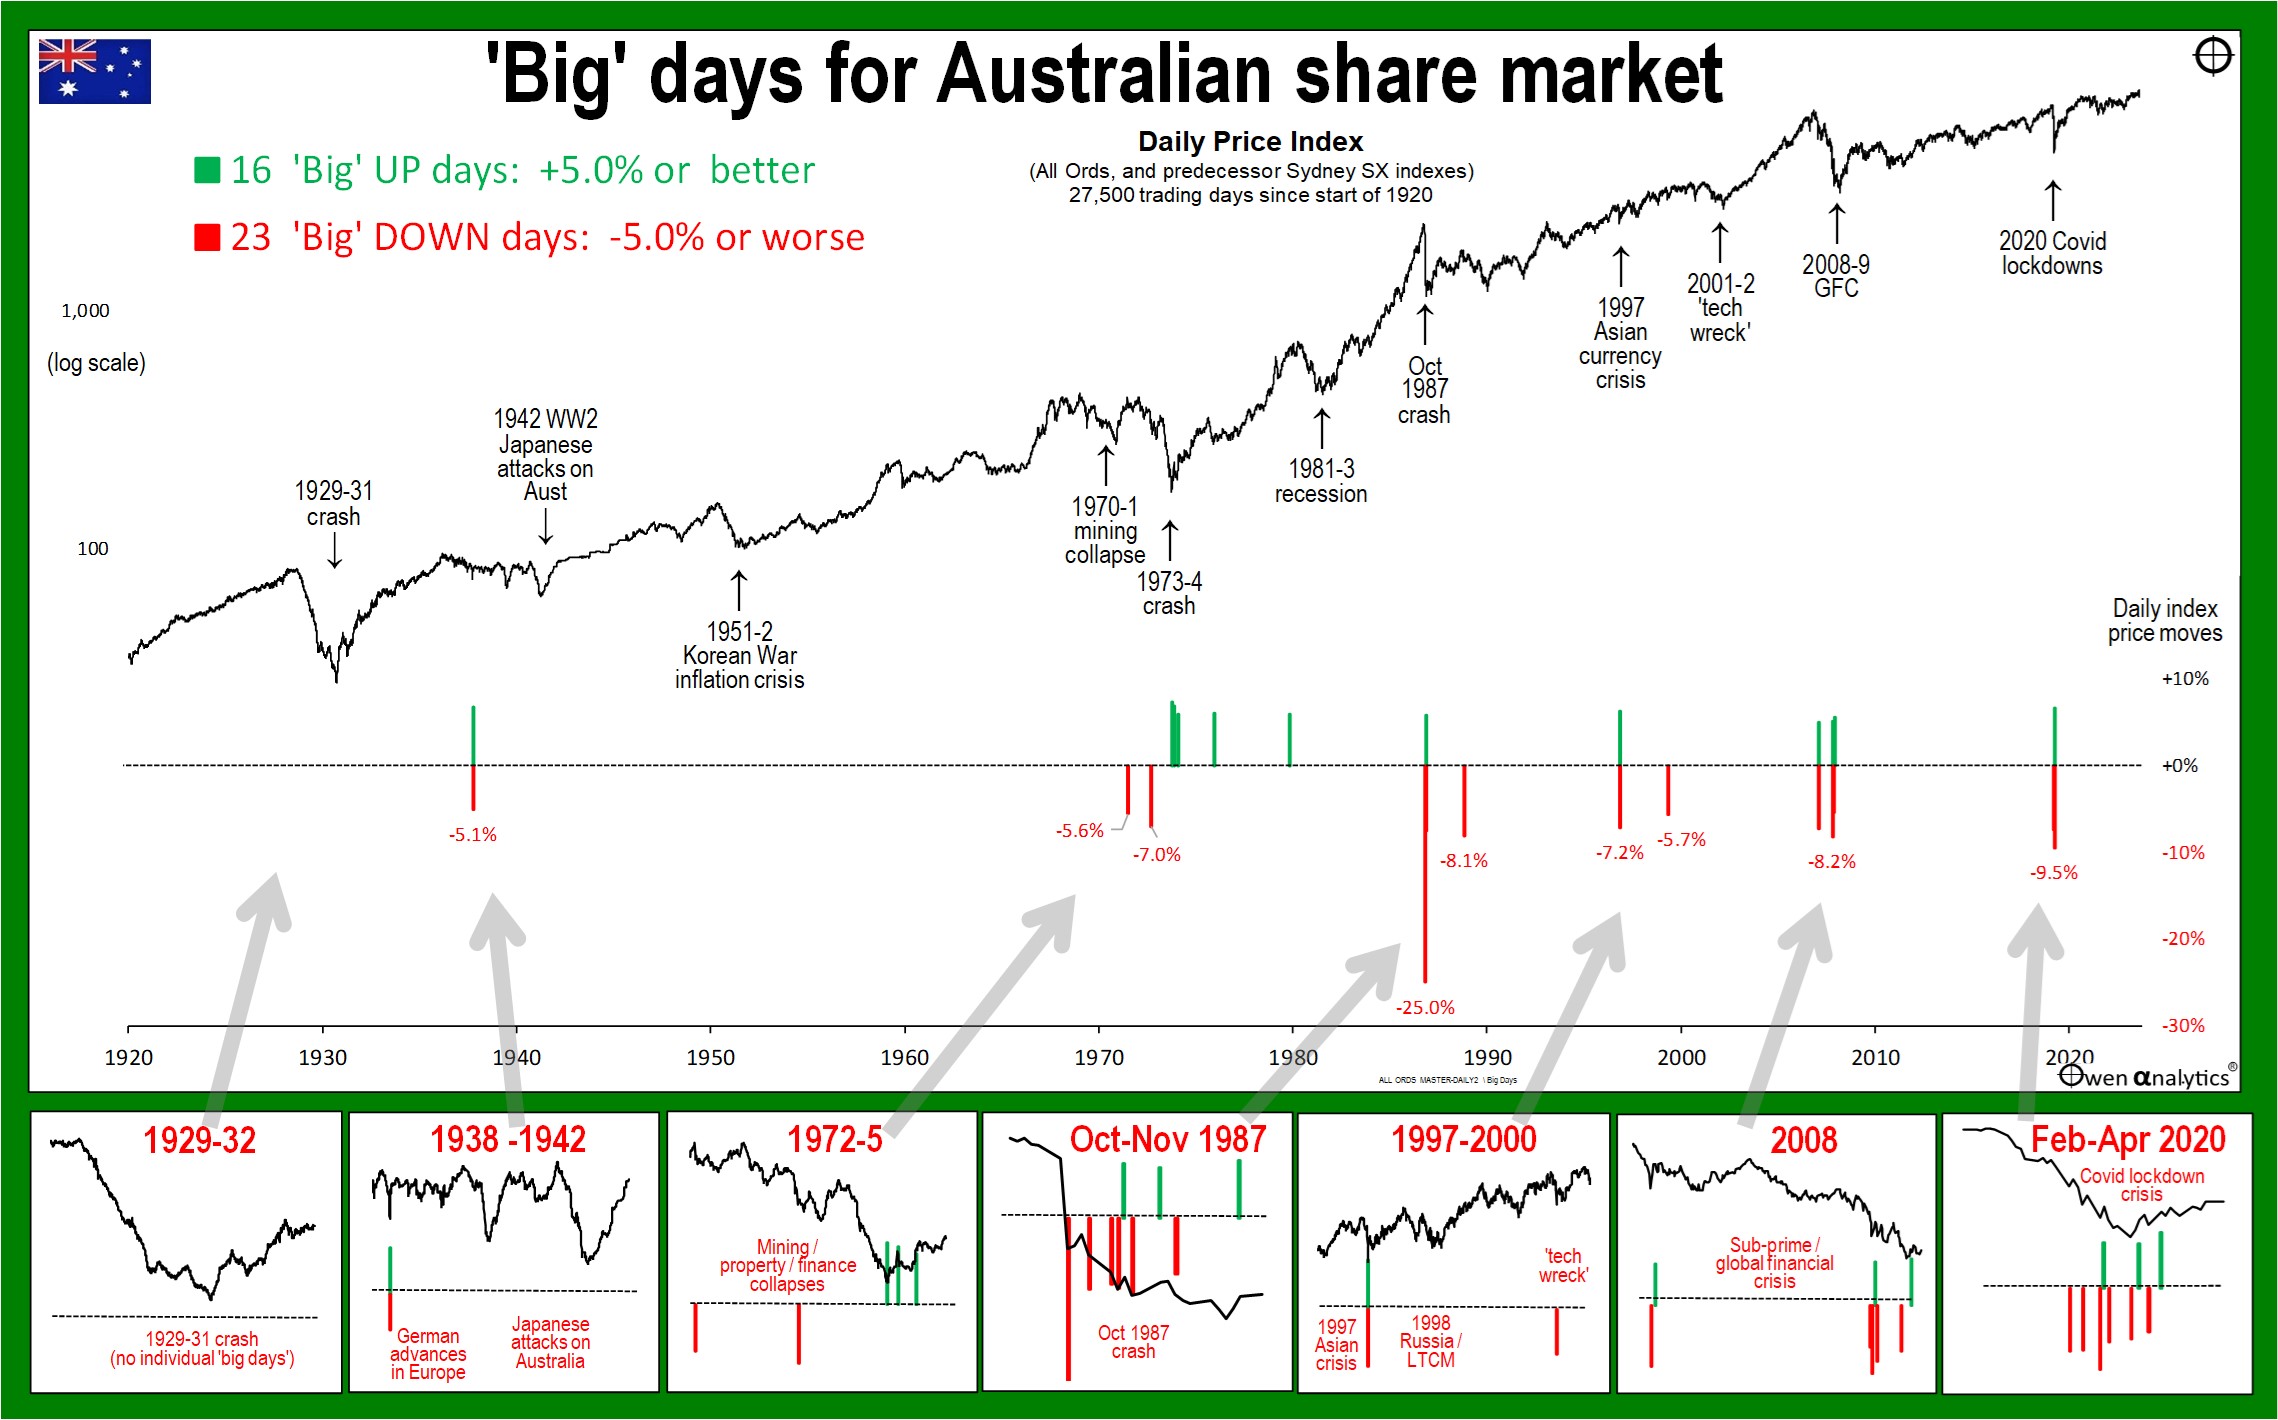
Finance textbooks claim that market price moves are ‘randomly distributed’, but in the real world, markets are far from random.
The chart clearly shows that the big moves have tended to cluster together in periods of high turbulence and volatility, highlighted in the charts below the main chart.
Clusters, not random
Most of these 39 ‘big days’ of rises or falls greater than 5% occurred during four major periods of severe turmoil during the past 100 years –
-
- The 1970-1 mining crash, which rapidly turned into the much deeper 1973-4 property / finance crash
-
- The September-November 1987 crash – which included the worst single day for the Australian market: Tuesday 20 October 1987, when the All Ordinaries index closed down 25.0% for the day, and then kept on falling for another two weeks, while the US market rebounded.
-
- The 2008-9 ‘global financial crisis’, lasting a gut-wrenching 16 months, which seemed like a lifetime.
-
- The coronavirus lockdown scare in February-March 2020.
Most investors will have first-hand, recent memories of the extreme volatility in local and global markets during the Covid lockdown panic in February and March 2020. There were five big down days worse than -5%, including -9.5% on Monday 16th March (plus three big up days as well). Those certainly were gut-wrenching and stomach churning days for many investors.
I was also an active market participant through 2008-9 GFC, the 2001-2 ‘tech-wreck’, the 1990s Asian/Russian crises, and the 1987 crash, although, fortunately, mostly I was looking for bargains and waiting for the right time to invest.
1929-31 crash was less volatile here than on Wall Street
The chart highlights the fact that the 1929-31 crash leading into the 1930s ‘Great Depression’ – was less volatile for Australian shares than it was for US shares. No 'big' 5% days at all.
Although the local daily press carried news of the unfolding carnage on Wall Street, the overwhelming impression here was that the conditions were different here (and they largely were), and so the impact on our local companies would be relatively minor. Alas, it was not to be.
Although there were no individual ‘big days’ here like there were on Wall Street, the steep declines in prices and volumes of commodities, global trade and capital flows, did lead to the local market suffering its worst ever overall decline, even worse than the 1987 crash. I cover these market crashes in separate stories.
Long periods of relative calm
In between these occasional periods of high volatility in general market panics, there are long periods of relative calm. These are periods when investors become complacent, ignore risks, and bid prices up to unsustainably high levels on the assumption that ‘this time is different!’ Unfortunately, it never is.
Sell-offs usually recovered quickly
Each of these market panics were recovered – often very quickly, and so great fortunes were lost when people sold into the panic, only to regret their actions when they saw prices recovering very soon after they sold.
The chart shows that most of the big UP days were immediately following the big down days.
I have found over many cycles, that the rebounds from sell-offs are always stronger, faster, and broader than expected. It is extremely difficult to get the timing right. Far better to just stay invested, ignore the daily volatility, and use the sell-offs to buy cheap.
Is this the start of the next big correction/crash?
There are two main aspects of this question: – (1) the level of over-pricing (ie how vulnerable is it to a correction), and (2) the likely trigger for the correction.
On the first question, there is no doubt that the local ASX market is significantly over-priced, but not nearly as over-priced as the US market.
It is important to note that the local Australian market always falls when the US market suffers a major sell-off, regardless of local pricing and local conditions here. (The last time the local market held up despite a major fall on Wall Street was in the ‘Panic of 1907’).
On the second question – markets can remain expensive and keep on reaching higher levels for many years before finally crashing – eg the 1990s was virtually a decade of straight line gains for the US market in the long ‘dot-com’ boom, before finally crashing in the 2001-2 ‘tech wreck’.
The Australian market did not run up as high as the US market in the 1990s boom, and so it fell less in the ‘tech-wreck’. This is going to be the case again in the current cycle.
For over-pricing of the US market, see:

On the likely trigger, see -

Market corrections are times to pull out the ‘buy list’ to update data, valuations, and target buy prices. There are some great companies out there that are almost always too expensive to buy, but broad market panic sell-offs drag everything down – good and bad. These opportunities don’t come along very often.
It is what you do in the big market corrections that will determine the level of wealth and lifestyle for you and your family in 10, 20, 30 years time.
If the market recovers quickly from this current fall and resumes it's upward rally (and most of the time it does), then the buy list goes back in the bottom draw. But it is now up-dated ready for when the next opporunitity comes along.
‘Till next time – happy investing!
Thank you for your time – please send me feedback and/or ideas for future editions!