Cash rates have been cut everywhere (except Australia and Japan), and the tremendous rally in share markets over the past two years (even after this week’s mini-fall) has been based on the assumption of several more cuts coming soon.
The problem is that even if inflation was safely back to target ranges (and it isn’t yet), current cash rates are probably already too low to contain inflation in Australia, the US, and other major markets.
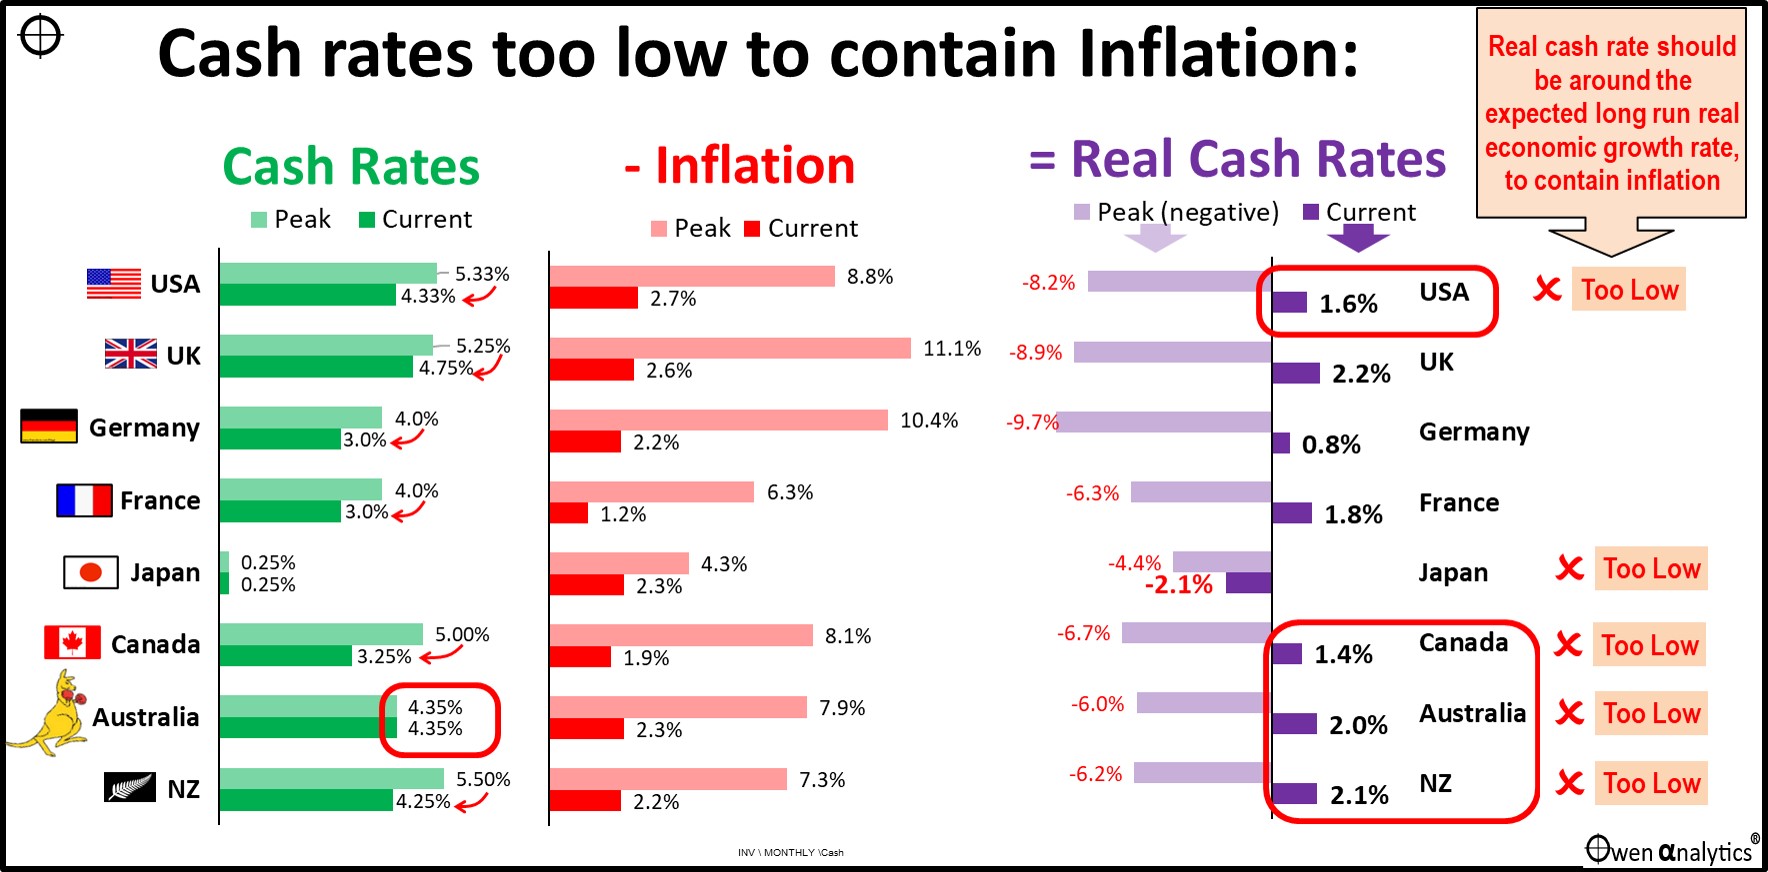
Today’s chart shows cash rates, inflation, and real cash rates (the nominal cash rate less inflation). For each, I show the peak level in the post-Covid cycle (light colours), and the current level (dark colours).

Inflation
Let’s start with inflation (middle section), because that is the core of the Covid stimulus problem. CPI inflation rates peaked near or above 10% (pink bars) around the world. Central banks attacked inflation with aggressive rate hikes 2022-3 (with no help from big spending governments everywhere), and inflation has now come back significantly in all markets (red bars).
The red bars are the most recent annual inflation rates. All are still above target ranges in each country. However, if we use current ‘running rates’ of inflation (eg annualised latest three months, or annualised latest month), and assume no increases from here on, then we can probably say that inflation appears to be back down near target.
Job done! Or so it would seem. Hence the calls from investors and borrowers for more rate cuts now.
(NB. Simply using very recent short term inflation rates – like annualising the most recent 1-month or 3-month inflation – sounds like a good idea, but in practice is problematic because short term numbers are often very choppy due to volatile factors like oil prices, weather, timing of temporary government subsidies, etc.)
Cash rates
What brought inflation down was the interest rate hikes (left section), plus the easing of several supply problems due to Covid lockdowns, wars, weather events, and a host of other random events.
For each country, the light green bar was the peak policy cash rate reached during 2023 (except in Japan it was in mid-2024).
Generational divide
Young folk with experiences limited to the post-GFC era of zero inflation and zero interest rates regard these peak rates of 4-sh or 5-sh percent, and even the current cash rates, as being horrendously punishing. This is understandable because they have only ever experienced the post-GFC era of unusually low inflation and interest rates.
In Australia, hundreds of thousands of young first home buyers (Lowe’s Lemings) were lured into the RBA’s misguided three-year forecasts of zero interest rates, but were hit severely when the RBA started to raise rates two years early!
While younger folk saw zero rates as normal (and supported by the misguided forecasts by the RBA), anyone with a reasonable amount of experience in markets knows that cash rates of 4-sh to 5-ish percent are not ‘high’ at all. They are pretty much in the mid-range of what is ‘normal’ in their experience. Most of us have lived through periods of double-digit inflation, double-digit interest rates, and double-digit unemployment. The current levels of interest rates, inflation and unemployment are actually quite low to moderate in historical terms.
The dark green bars are the current cash rates. As inflation has subsided, cash rates have been cut in all markets except Australia (highlighted) and Japan.
Australia’s rate hikes were later, slower, lower
In the case of Australia, rates have not been cut here yet for at least four reasons:
-
- (a) cash rates are not high - relative to other countries, relative to history here, and relative to inflation,
- (b) inflation is still not down to target,
- (c) the jobs market is still very strong, with unemployment running below 4%,
- (d) rising Federal and State government spending when the economy is already running above capacity.
Essentially, the RBA hiked interest rates later, slower, and lower than other countries, so inflation is still more problematic, and the RBA has therefore been slower to cut rates than other countries.
(Japan is a special case. It has been stuck in a debilitation deflationary spiral for the past three decades, so they are still actually trying to stoke inflation to trash the yen to help exporters. The Bank of Japan only very belatedly and reluctantly started to raise interest rates back into positive territory in July 2024.)
Real Cash Rates
The ‘real’ (ie inflation-adjusted) cash rate (right section) is the nominal cash rate (left section) minus the current inflation rate (middle section). Real cash rates are currently running at around 1% to 2%.
Remember that inflation here is the rolling 12 month rate – ie the annual ‘headline’ rate. The current/recent ‘running’ rates are probably around half to one percent lower than the annual headline rate, and this would increase the real cash rates by half to one percent. Therefore the current running rate real cash rates (based on current rate inflation) are probably around 2% to 2.5% in Australia and the US.
In a growing economy, the average ‘real’ cash rate should be at a similar level to the average real rate of economic growth in order to prevent inflation from rising.
In practice, cash rates and economic growth rates are not stable or flat, Economic growth rates rise and fall with business cycles, and cash rates also rise and fall, oscillating around their long term average level – cash rates are raised during booms to slow inflation, then cut during busts to stimulate growth and jobs.
In the three decades before 2008 (ie prior to the ZIRP/QE era), real cash rates averaged:
4.1% in Australia
2.4% in the US
4.1% in the UK
3.4% in Canada
‘r*’ (r-star)
Central bankers use the term ‘r*’ to refer to the ideal non-inflationary real cash rate. There is much debate on the actual value of r*. Probably the leading thinker on r* is John C Williams, and he is also the most relevant authority as he is President and CEO of the Federal Reserve Bank of New York, and Vice Chair of the Federal Open Market Committee which sets the Fed rates.
Estimating r* is difficult (Williams calls it a ‘hall of mirrors’) because it involves not only estimating likely future economic growth but also estimating future supply and demand for savings. Here is a recent paper by Williams on r*.
Adding fuel to the inflationary fire are governments running big spending programs and deficits, plus a looming global tariff war that will probably put upward pressure on domestic prices and wages.
Where are we now with real cash rates?
Real interest rates are currently running around 1.5% to 2% in US, UK, Australia, Canada, and NZ, or perhaps a fraction lower if we assume recent downward trends in inflation can be sustained.
Even if and when inflation is safely back to target levels, the real cash rates in each country would need to be around the expected long-term level of real economic growth in order to keep inflation contained.
Future likely economic growth rates?
Economic growth comes from three main sources:
-
-
- Population growth,
- Participation rate growth (more hours worked across the population, which is usually due to more people working (eg women), and increasing hours worked per person – working harder),
- Productivity growth (more output per hour worked – ie working smarter).
In recent decades, most of Australia’s economic growth has come from Population growth (mostly immigration), plus more hours worked (people retiring later, greater proportion of women working, more hours worked per person), but no Productivity growth.
Ie Australians are working longer and harder, but not smarter.
Historically, Australian rates of real economic growth have averaged:
-
-
- 3.1% pa in the 20th century
- 3.4% pa since end of WW2
- 3.1% pa since 1980 (but has been declining progressively each decade since the 1980s)
- 2.8% pa in the 21st century
For future average growth rates - just with population growth (immigration) and working longer and harder, but not smarter, real economic growth is likely to be slow to around 2.5% or perhaps even as low as 2% pa.
Likewise for USA, Canada, NZ – which are also growing economies with favourable demographics like Australia - population growth, working longer and harder plus minimal or no gains from productivity, are also likely to result economic growth rates slowing to around 2% to 2.5% pa.
(Europe and Japan probably have lower r* because of stagnant long-term growth outlooks.)
The point is, even if we assume future economic growth (and the required real interest rates to contain inflation) are going to be lower than historical averages – say a modest 2% to 2.5% pa, then the current level of cash rates in Australia, US and other similar growing markets are more or less around where they should be.
Bottom line – cash rates are currently not ‘high’ for where they should be even with very modest future economic growth outlooks, and even if we assume that inflation has been brought back to target ranges.
Implications for investors?
When making investment decisions on any asset or asset class, investors form a view on likely future cashflows, then apply a ‘discount rate’ to come up with a fair value. (People still do that I think, or maybe they just buy stuff that is going up in the hope that it will keep going up!)
The tremendous two year rally in share markets has been based on a near universal assumption of imminent and rapid rate cuts back to, or toward, those wonderful post-GFC and post-Covid years of zero interest rates, and hence artificially low discount rates. That assumption was always flawed.
It is good to see the Fed this week finally urging investors to abandon their unrealistic assumptions of rapid rate cuts and instead get used to the idea of cash rates averaging around about where they are now.
Despite expensive pricing on fundamentals, I have been bullish on share markets in portfolios, and US shares in particular. Like all booms it will end one day of course. This week’s re-adjust of expectations about future rate cuts is a healthy development, but probably not the trigger for the big crash that will end the current boom.
‘Till next time, safe investing!
For more on why the RBA is not cutting rates – see:

For my current portfolio views and asset allocation in my own long term ETF portfolio (I have been over-weight US / global shares) – see
