This is Part 2 in a series of stories about different ways to look at house prices.
House prices seem to have soared to astronomical levels, but that is only when you express ‘value’ in terms of our increasingly worthless paper money that governments are continuing to debase.
However, relative to other types of ‘real assets’ with intrinsic value, house prices have actually not increased at all. The growth in the ‘sticker price’ in paper dollars is mostly just a reflection of the collapse in purchasing power of paper money.
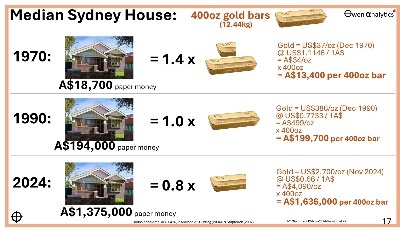
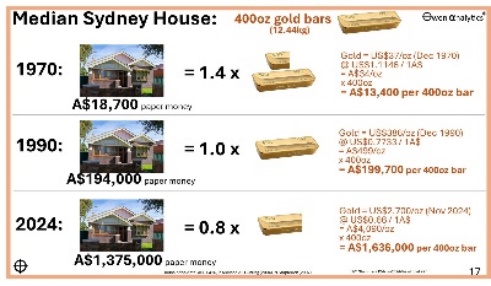
In Part 1 a couple of days ago, I compared Sydney median house prices to gold (the original ‘hard currency’) over different periods. While house prices have certainly soared in recent years and decades measured in paper dollars, gold has appreciated by even more, meaning the value of a median Sydney house has actually declined against gold – the hard currency.
After that story, a few readers commented that the comparison between houses prices and gold was not ideal because buying gold is not practical for ordinary investors, and there are other differences - for example, housing has rental income (or the benefit of saving imputed rent), and that gold earns no income, and costs money to store and insure, etc.
Microsoft shares
So, today’s Part 2 compares median Sydney house prices to Microsoft shares. Why Microsoft for this example?
Because it is large, widely held, and widely-known around the world. Just about every investor in Australia and around the world who has units in any large, pooled retirement fund (‘super’ fund in Australia), or owns units in an index fund or ETF of global shares, indirectly owns shares in Microsoft, whether they like it or not. Anyone with a mobile phone or PC can buy shares in MSFT in a few seconds with zero or near-zero brokerage cost.
(I am not suggesting you buy Microsoft. I am only using it for this example as it is widely held and accessible to anyone, anywhere).
Today’s chart shows the ‘median’ house price in Sydney at three different points in time – compared to the equivalent value in Microsoft shares, converted to AUD (because the house prices are also in AUD).
As in Part 1, I use Sydney ‘median’ house prices, as they are widely used in the media. (For the purposes of this exercise I ignore the fact that the ‘median’ house today is often quite different from the median house in past in terms of size, quality, amenities, etc.)
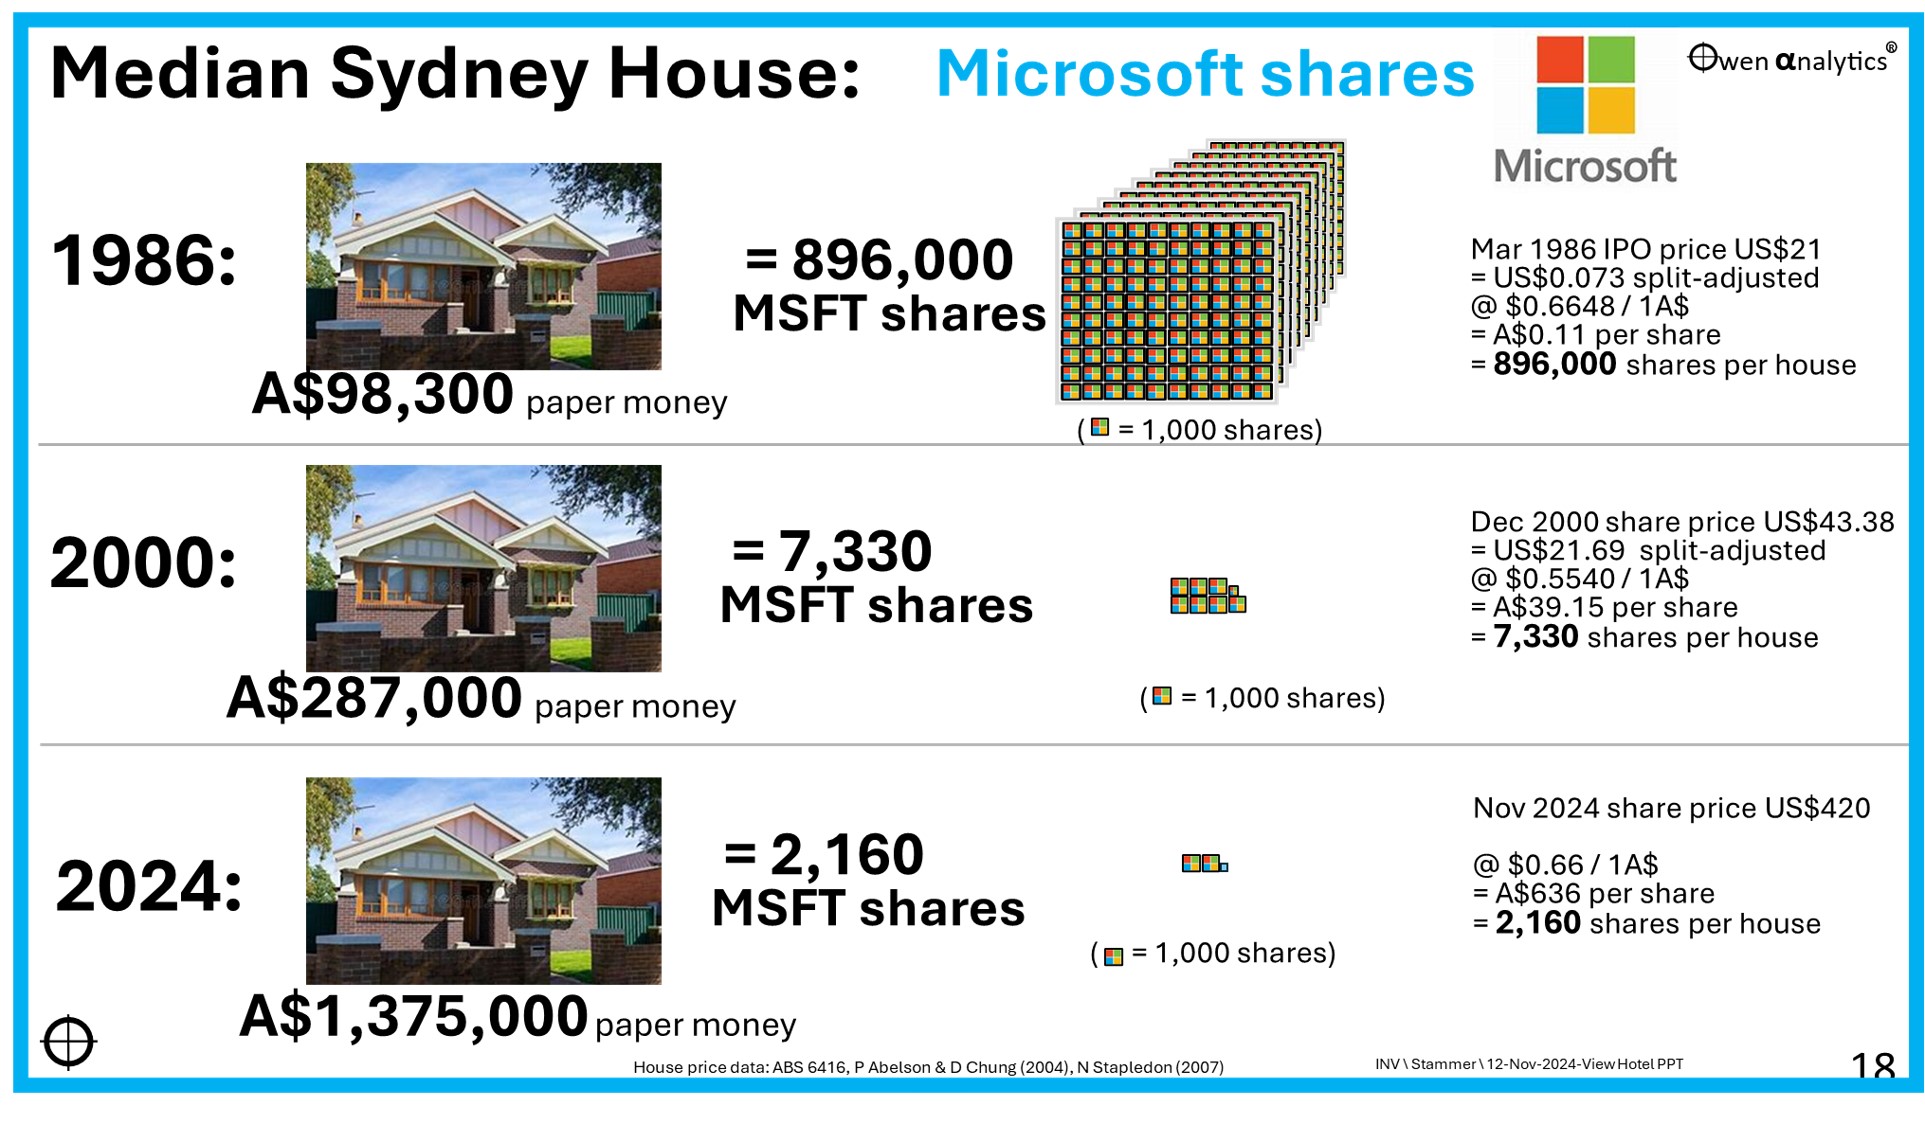
Microsoft was floated in March 1986 at US$21 per share. Since then, the company has split its shares nine times (seven were 2 for 1 splits, and two were 3 for 2), so each original share has now split into 288 shares. Therefore the split-adjusted IPO price was 7.3 US cents for each share on issue today.
In order to compare like for like, I compare how many split-adjusted Microsoft shares were needed to buy one median Sydney house at each point in time.
‘Values’ in 1986
In 1986 when Microsoft as floated, the ‘median’ house price in Sydney was A$98,300 in Australian paper dollars. In its March 1986 IPO, Microsoft shares were US$21 per share, or 7.3 US cents, or 11 Aussie cents in today’s split-adjusted terms.
So in 1986 a median Sydney house was worth the same in Aussie dollars as 896,000 split-adjusted Microsoft shares in Aussie dollars. Microsoft was a relatively small company back then, so you needed to own a fair chunk of it to be worth the same as a median Sydney house.
2000
Fast-forward to the year 2000, at the top of the late-1990s ‘dot com’ boom. Between 1986 and 2000, the amount of paper money needed to buy a ‘median’ house in Sydney had increased three-fold to A$287,000.
But, in the same 14-year period, Microsoft shares soared 300-fold to US$21.69 per share (in split-adjusted terms), or A$39.15 per share in Aussie dollars. Therefore, in 2000, you had to own just 7,330 Microsoft shares to be the same value as a A$287,000 median Sydney house at that time.
In other words, the ‘value’ of a median house in terms of Microsoft shares fell by some 99% between 1986 and 2000.
2024
Then, during the past 24 years from 2000 to today (November 2024), the amount of paper money needed to buy a ‘median’ house in Sydney increased a further five-fold, from A$287,000 to A$1.375 million today.
Meanwhile, over the same period, Microsoft shares have increased to US$420 today (or A$636) per share. Therefore you have to own just 2,160 Microsoft shares to be the same value as a A$1.375 million median Sydney house today.
In other words, the ‘value’ of a median house in terms of Microsoft shares fell by a further 70% over the past 24 years from 2000 to now (November 2024).
Not a case for buying Microsoft!
This is not a recommendation to buy shares in Microsoft as a pathway to buying a house in future, or instead of saving to buy a house. Nor am I suggesting that Microsoft shares will continue to appreciate at the same rate.
I am merely pointing out the problem of using paper money as a measuring stick for ‘value’. If we measure things in terms of our increasingly worthless paper money, we end up with crazy kinds of numbers that make little sense.
Compare the value of ‘real assets’, not paper money
Unlike paper money, housing and Microsoft shares are ‘real assets’.
A house is a ‘real asset’ with intrinsic value in the sense that provides rent-free shelter, freedom from landlords, and can be rented out in whole or in part. Owner-occupied housing also carries tremendous tax advantages in Australia.
Microsoft is also a real asset with intrinsic value – it is a real company with products that produce revenues, profits, and dividends.
I am not saying housing is not expensive – it is, but paper money inflation (ie declining purchasing power of money) raises the sticker prices of just about everything. However, in terms of value relative to many other types of real assets, house prices have actually not risen at all.
Ok, but Microsoft has been a star – what about the rest of the share market?
I used Microsoft in the above example because it is relatively easy to visualise and calculate the number of shares in the company at any point in time, to compare values with other assets.
It is also a very relevant and practical example because the vast majority of Australians (and investors everywhere) actually already own shares in Microsoft, directly or indirectly, via their diversified pooled retirement funds and/or ETFs.
Broad US share market -v- house prices
We can do the same value comparison using the entire US share market. Instead of using Microsoft shares, we simply use index points on an index of shares like the S&P500. This is also what just about every investor already has in their pooled retirement funds, although it is more difficult to visualise an ‘index value’ than a share in an individual company like Microsoft.
The results are along the same lines – both have appreciated against debased paper money over time. Here is the same exercise using S&P500 index points (converted to AUD) compared to Sydney median house prices over time – 1980, 2000, and 2024.
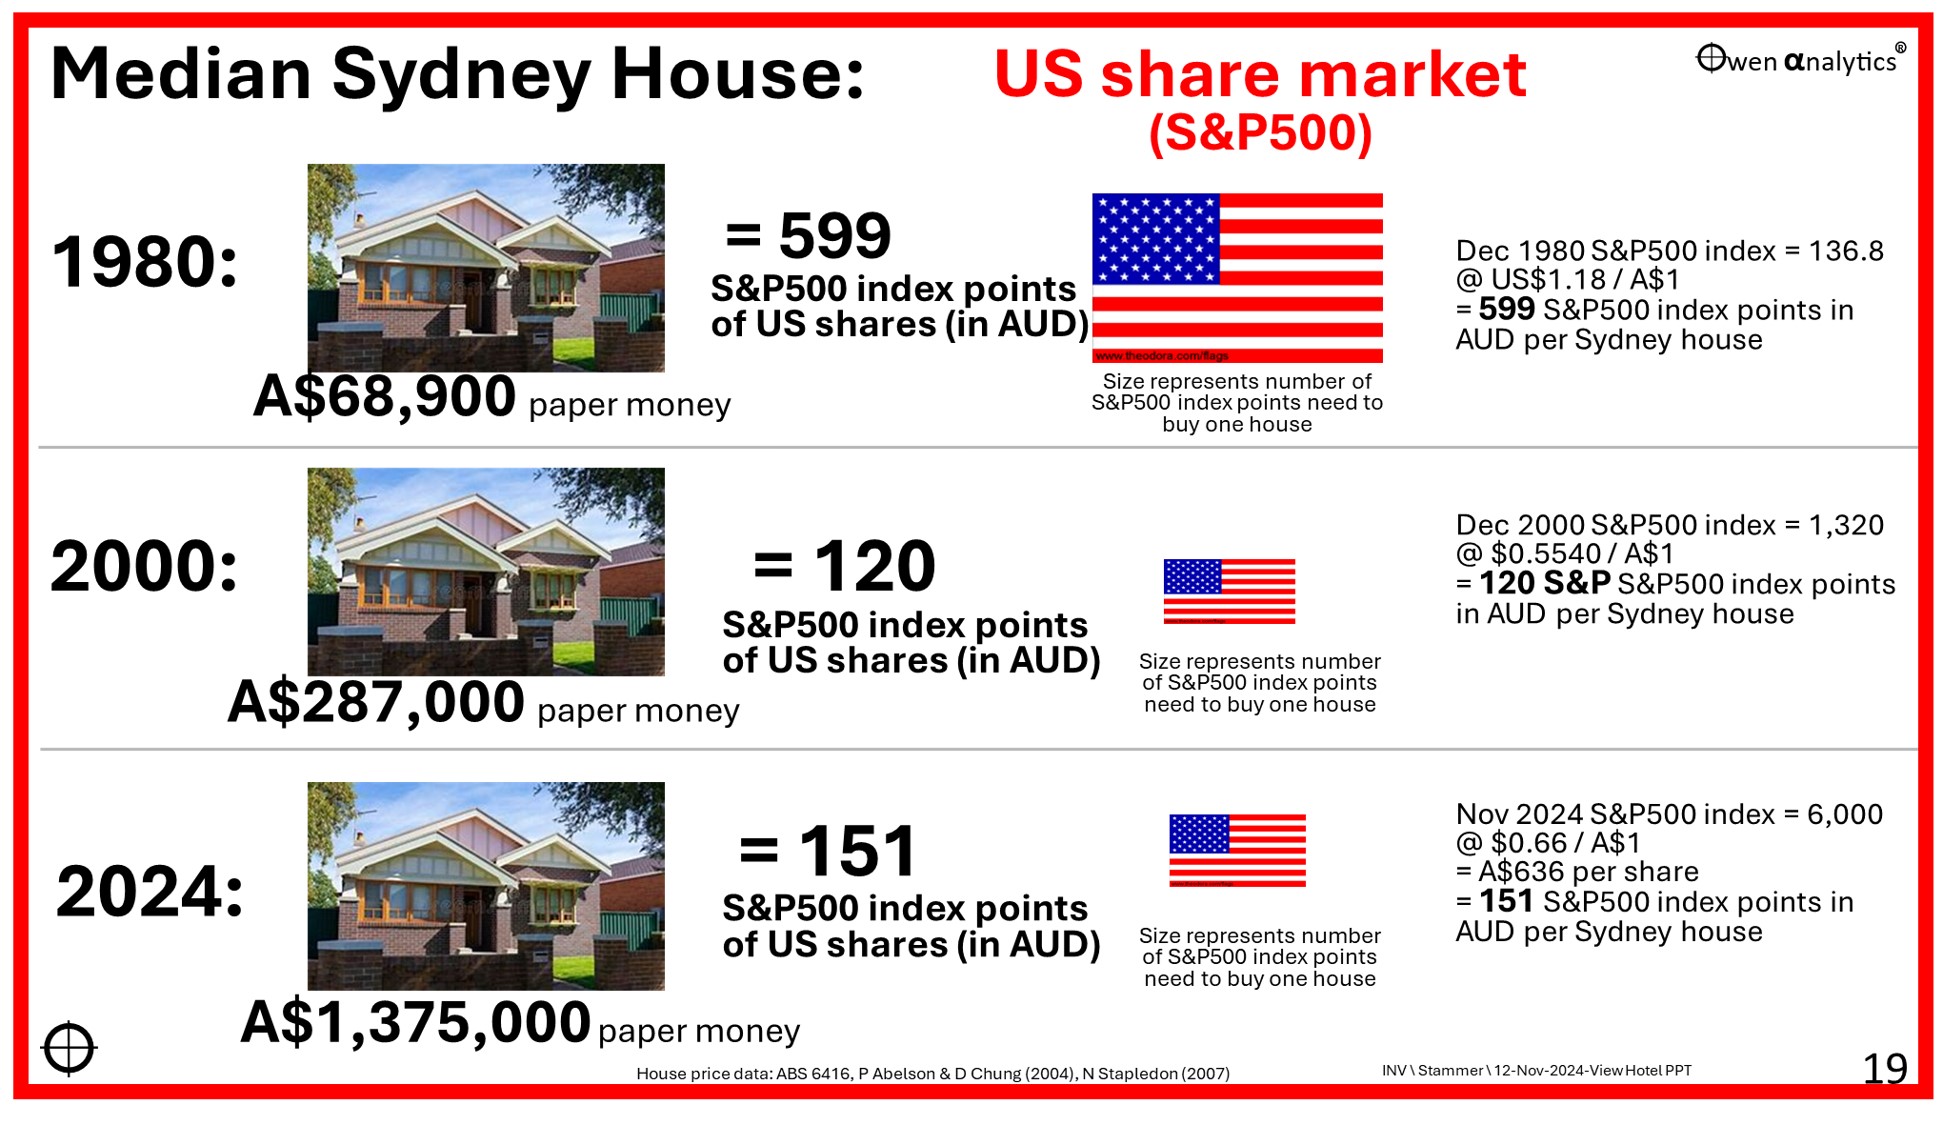
Here we see that the price of a median Sydney house, expressed in terms of S&P500 index points, fell by about 80% between 1980 and 2000 – ie the US share market rose by much more than Sydney house prices in that period.
However, over the past 24 years since 2000, both have risen at more or less at the same rate – both are up between 4-fold and 5-fold.
There are many differences between houses and shares of course. The ability to gear up, tax differences, rental/dividend yields, costs of ownership like repairs and maintenance, etc. On the other hand, companies can grow their income, profits and dividends over time. Houses can also increase their rents (or the value of imputed rent if you live in it), etc.
Again, the intention is NOT to suggest or recommend buying the broad US share market instead of buying a house. I always suggest buying a house is one of the most fundamental goals – primarily for peace of mind, freedom from landlords, and the tremendous tax breaks.
My intention here is to help people look beyond rising sticker prices expressed in terms of paper money (paper money inflation increases the sticker price of just about everything), and instead view housing as part of an overall plan to build real assets – many of which appreciate at least as well as housing.
‘Cost of living crisis’
Likewise, in the current ‘cost of living crisis’, the problem is NOT the rising paper money prices of everything. Rising prices are the outcome, not the cause.
The core of the problem is government policies trashing the purchasing power of government money – including loose fiscal policies (government spending, deficits, debts), monetary policies (money printing, interest rates, bank lending), and other government policies (including protection, subsidies, wages, uneconomic pet projects, and a host of others).
Look out for my upcoming comparison to Aussie shares including CommBank – how do you think they stacked up?
‘Till next time, happy investing!
See Part 1:
For my most recent monthly report on investment markets:
For my current views on asset classes and asset allocations - see:
