Australia’s unemployment rate has risen to 4.1% (up from a 48-year low of 3.4% in July 2022). Inflation is also running at 4.1%, down from 7.9% at the end of 2022). How bad are things (or how bad might they get)?
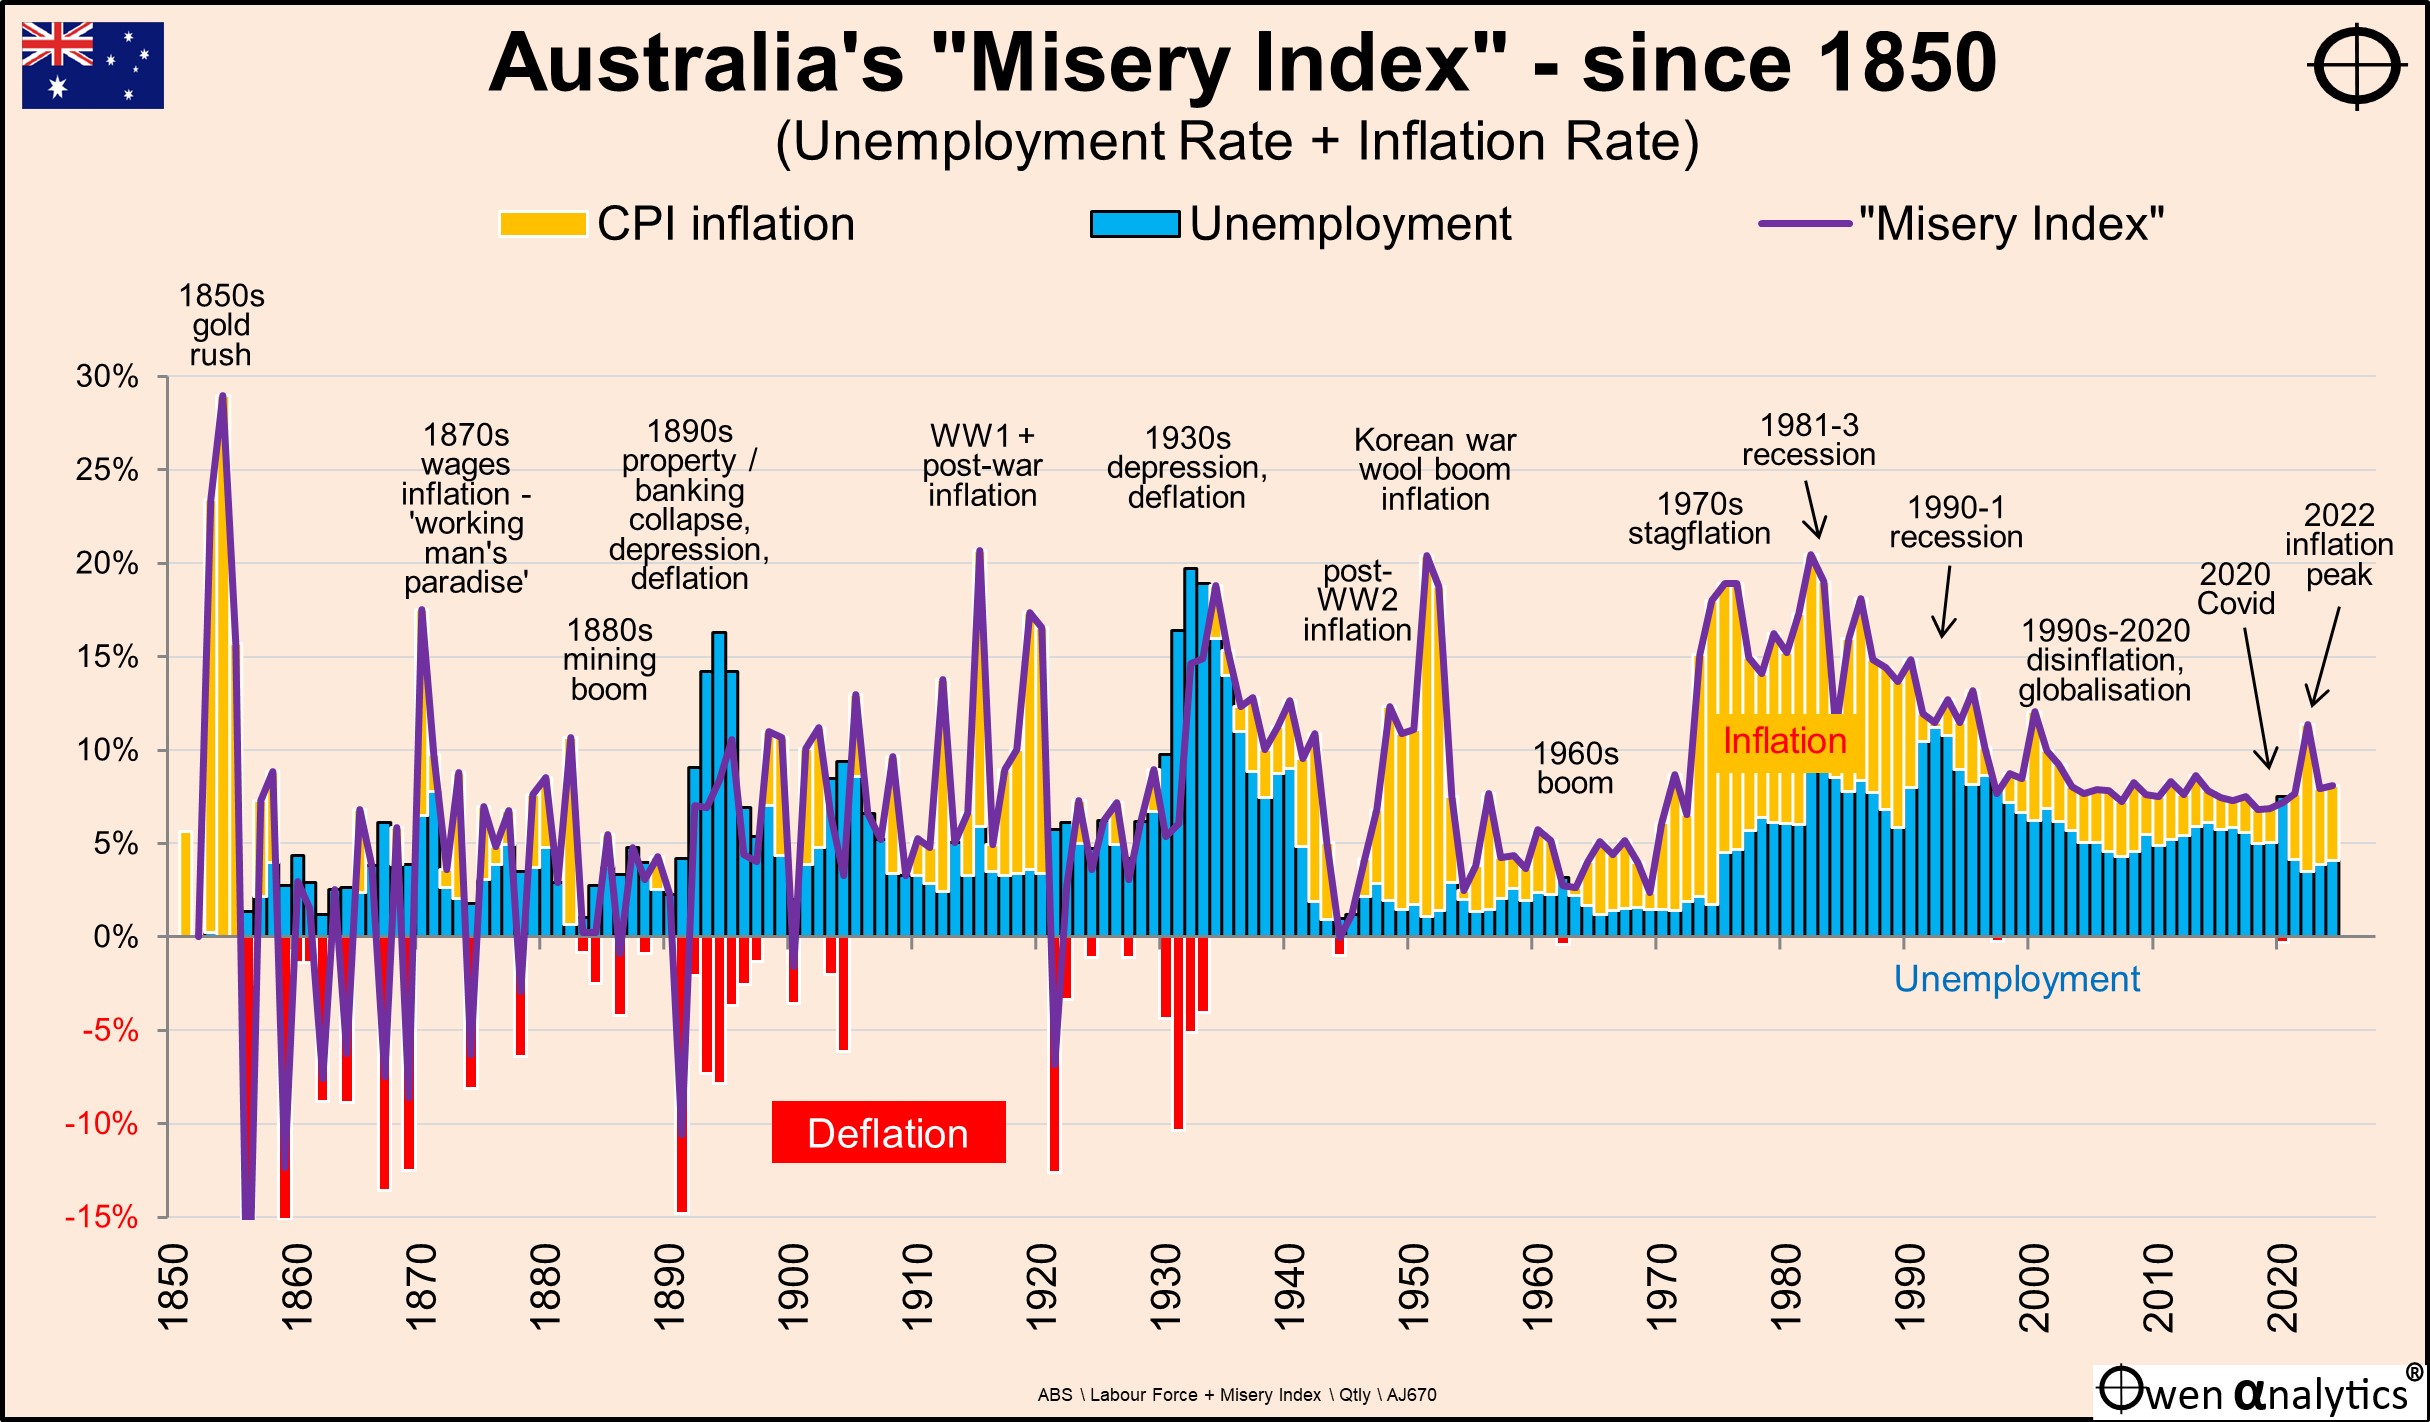
Unemployment and inflation are two of most potent causes of economic misery or distress in society, so here we add the two together to form a ‘Misery Index’. Here is a picture of Australia’s ‘Misery Index’ since 1850:

‘Rich world problem’
There are a host of other much more acute problems facing some people – including political persecution, occupation by a foreign power, slavery, racial or religious persecution, state violence, lawlessness, capricious confiscation of assets, arbitrary arrest and imprisonment, and so on.
Unfortunately, these are still present in many countries today, but Australians by and large have been fortunate to have been spared these evils at a national level, therefore this ‘Misery Index’ is very much a ‘rich world’ measure.
There also numerous problems with measures of unemployment and inflation – definitions, measurement methods, changes in processes over time, impacts of different groups in society, (aboriginal communities, etc).
We will not go into these here, but we will just use the ‘headline’ rates for the purposes of this quick national snapshot.
Unemployment
Unemployment is a source of misery for obvious reasons – not just economic misery but also because of the debilitating effects of unemployment on mental and physical health and wellbeing, and the tendency for it to become inter-generational.
Before the introduction of comprehensive welfare programs after WW2, unemployment without welfare support would have meant more acute hardship for those out of work.
Unemployment rates soared above 15% in the 1890s depression, and above 20% in the 1930s depression.
Unemployment peaked at much lower levels in the recessions in the early 1980s recession (10.4%), early 1990s recession (11.2%), and (very briefly) in the 2020 coronavirus recession (7.5%).
Inflation
Inflation is also a source of misery as it destroys the real purchasing power of income, savings, and welfare payments. On several occasions rising inflation has led to wage-price inflation spirals in which rising prices are countered with wage rises which in turn just push prices up further.
Australia has experienced several bouts of very high inflation. The highest overall rates of inflation were in the 1850s gold rush (29%), but there were also severe bouts of war-time and post-war inflation – during and after WW1 (15% in 1915, 13% in 1920), WW2 (9% in 1942, 10% in 1948), and the Korean War (17% in 1952).
Inflation rates were also very high during the 1970s and 1980s due to combination of government spending, loose control of money supply, and wage-price spirals. It was only brought under control from the early 1990s.
Then, after 40 years of global declining inflation, central bankers actually started to dream about how they could increase inflation!
They finally got their chance in the Covid lockdown crisis. Extraordinary bouts of loose monetary policy (central bank zero interest rates, money-printing and ultra-cheap lending programs – all running longer than necessary), and loose fiscal policy (government spending sprees, running up wartime-like deficits and wartime-like debts), created inflation - surprise, surprise!
Central bankers denied it at first, but then finally admitted that they created it, and would now have to raise interest rates and stop printing money, to bring it back down. Inflation in Australia peaked at 7.9% in 2022, and has been falling since then.
‘Misery Index’ peak
The highest misery index level was in the 1850s gold rush, when price inflation was at its highest but unemployment was effectively zero as workers from across the country (and from the across the world) abandoned their jobs and homes and headed for the goldfields. The sudden riches from gold finds benefited the few lucky gold panners and diggers, but it caused an explosion in prices of everything from food and basic necessities to property.
Depressions
The misery index was also very high during the economic depressions in the 1890s and 1930s, primarily because unemployment was high, even though inflation was deeply negative.
The misery index was very high for a sustained period during the 1970s and 1980s because both unemployment and inflation were high at the same time. Although there were comprehensive benefits programs for the unemployed, their welfare payments were quickly eroded by rising prices of food and everything else.
Australia’s misery index extended for longer than in the US and UK because the sharp and painful recessions in the early 1980s effectively killed off inflation in the US and UK. Australia did not follow the US/UK model of severe monetary supply control, but instead we had the ‘Accord’ process that was less effective in bringing down inflation. Chronic inflation in Australia was only brought a decade later by Paul Keating’s ‘recession we had to have’ at the start of the 1990s.
In 2020 (Covid lockdowns), unemployment reached 7.5% in July after government here (and around the world) unilaterally locked entire nations of citizens in their homes and out of their jobs for months on end.
However, inflation was running at -0.3% (price deflation) at the time. Unemployment was quickly brought down by government hand-outs that were neatly excluded from the unemployment numbers.
Where are we now?
In the scheme of things, the current ‘Misery index’ (4.1% unemployment plus 4.1% inflation = 8.2%) is still relatively mild.
Unemployment is rising (albeit still at very low levels), and is likely to rise further as demand, spending, and production are squeezed by the lagged effects of interest rate hikes and fixed rate mortgage re-financings.
On the other hand, the overall inflation rate is falling, led by declining goods inflation, although services and wages inflation remain elevated.
An economic contraction (eg a ‘recession’) would see rises in unemployment, but to some extent offset by lower inflation as demand for consumption and jobs slow further.
In a sharp recession, the overall Misery Index would rise because unemployment would probably rise by more than the decline in inflation.
A recession scenario would probably take the Misery Index from 4%+4%=8% to say 8%+2%=10%.
In a 1970s-2tyle ‘stagflation’ scenario, the Misery Index might reach 10%+4%=14%. That is highly unlikely, and would be on a par with the recessions of the early 1980s and early 1990s.
The ‘Real’ Misery Index
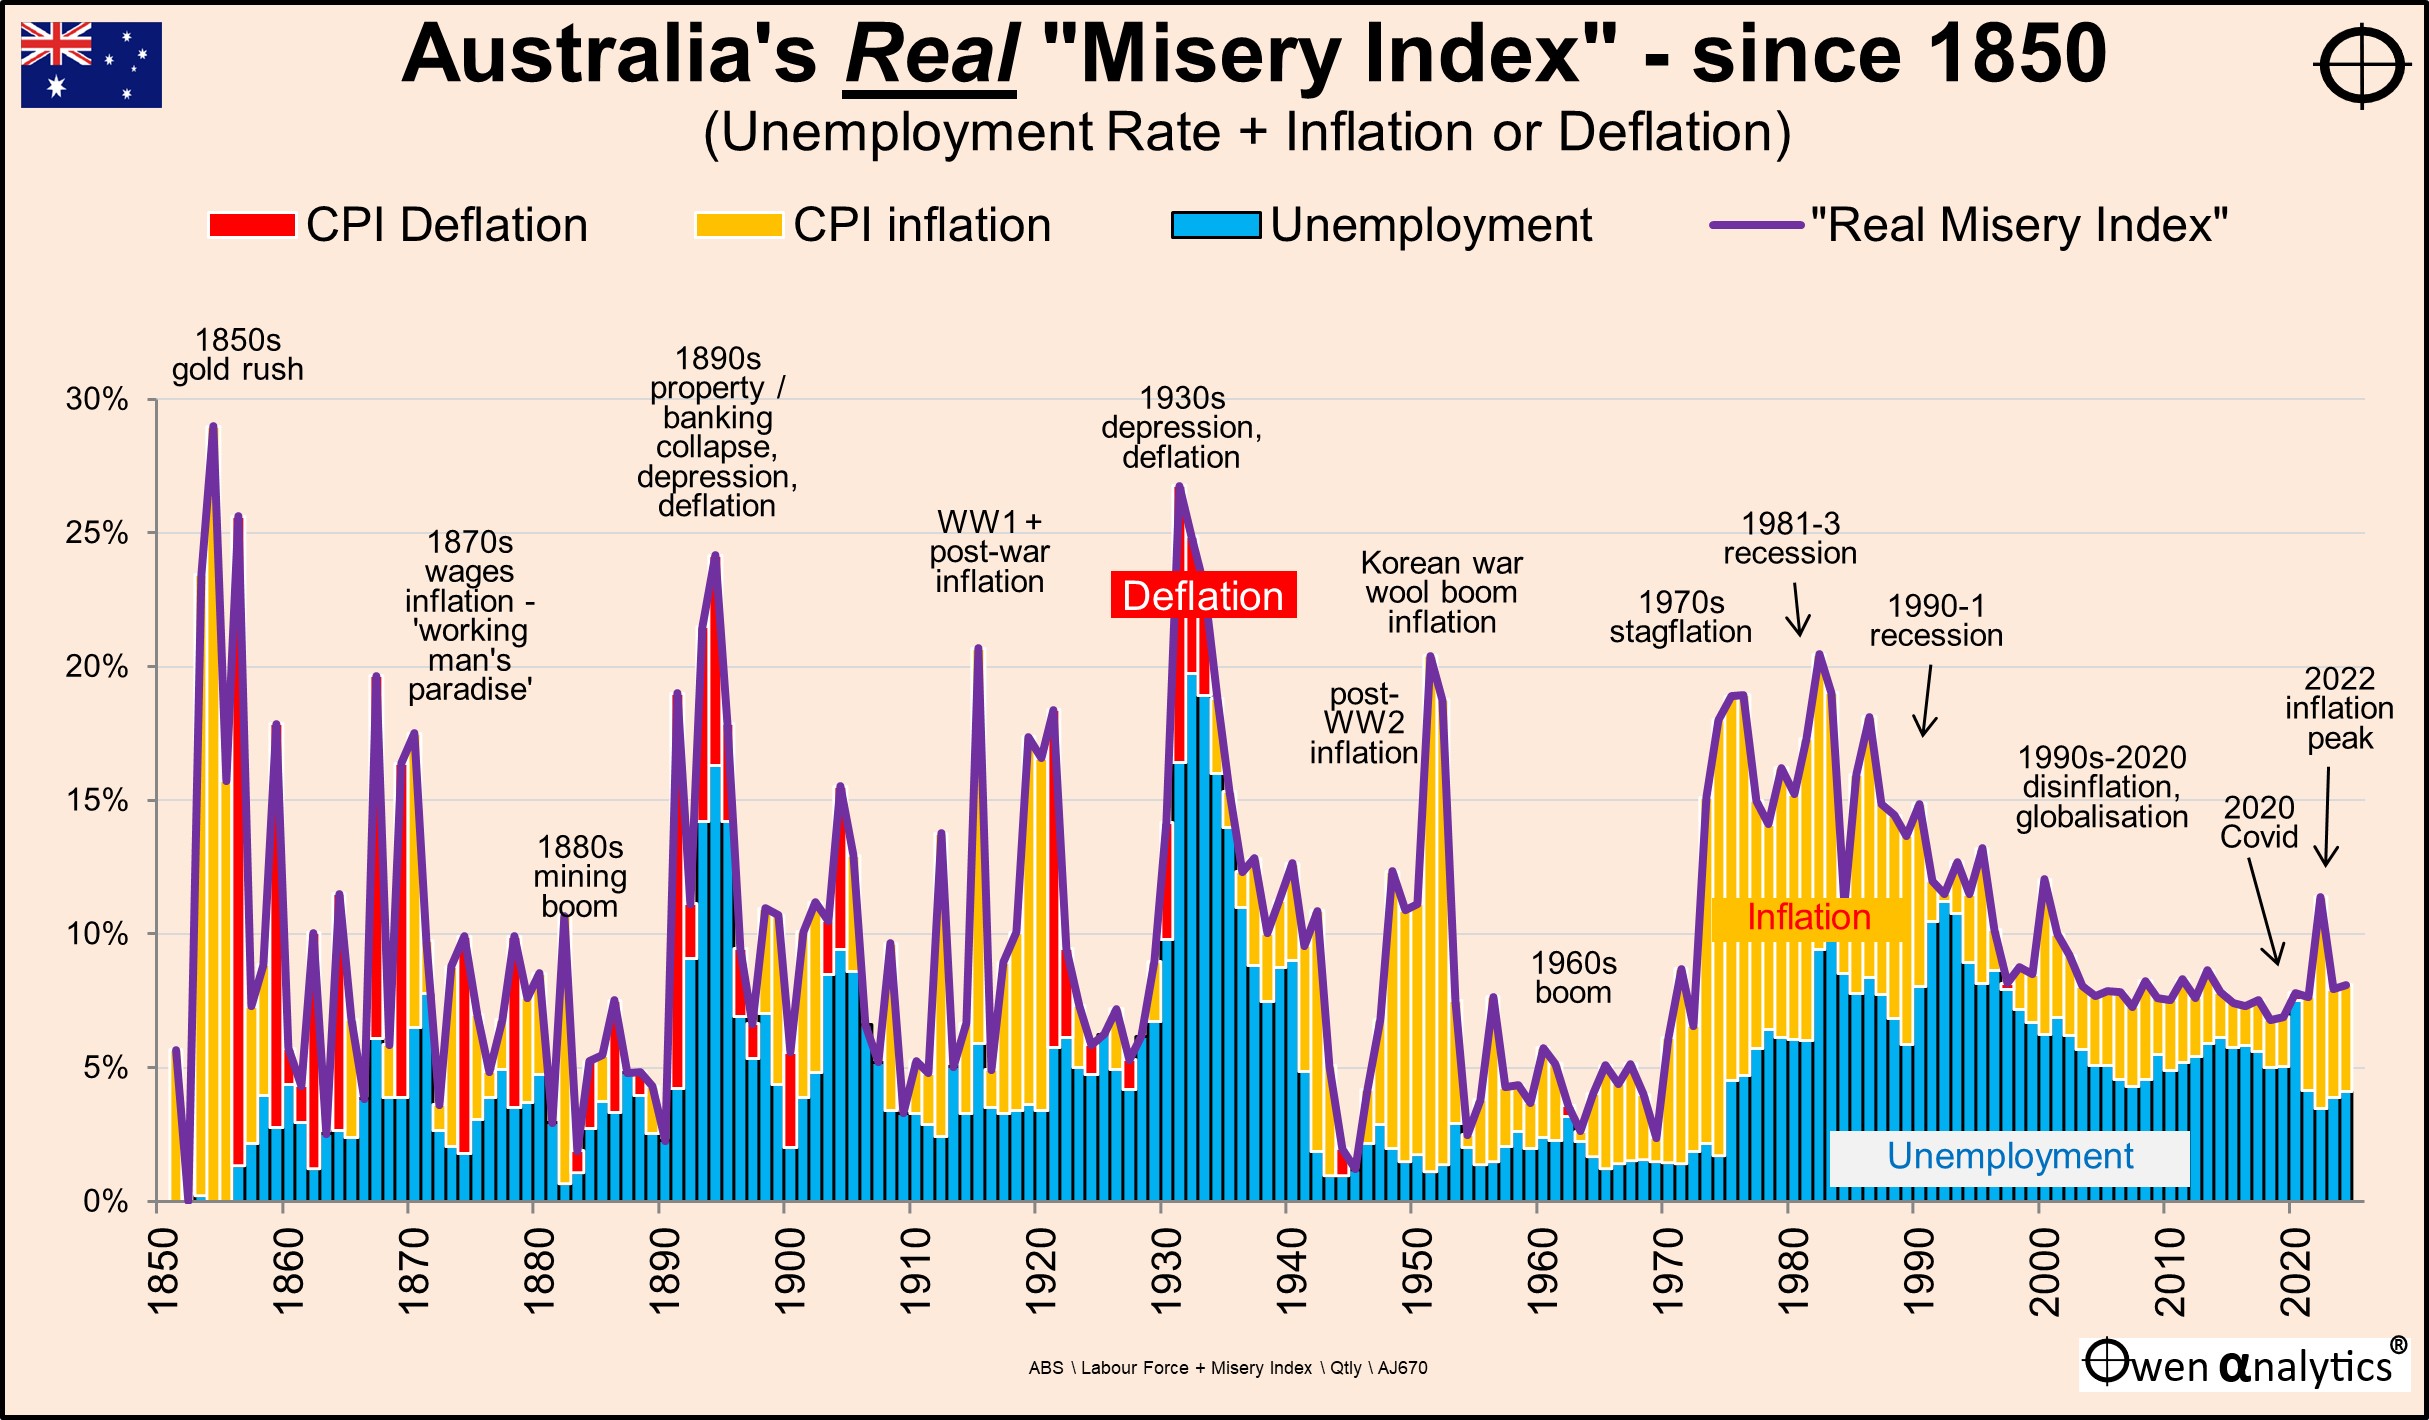
The ‘misery index’ outlined above is the sum of the unemployment and inflation rates – as these are two of the main causes of economic misery in 'rich world' societies. The ‘Real’ misery index goes one step further as it adds price deflation when it occurs, instead of deducting it.
The ‘Real Misery Index’ chart is the same as the previous chart for the regular ‘misery index’ except that price deflation has been added instead of being subtracted.

We can see that deflation added to overall misery in the 1890s depression and in the 1930s depression, because deflation adds to misery, rather than reducing it.
During the 2020 virus recession we also had a high ‘real misery index’ due to a combination of unemployment and price deflation, although both were very brief.
Deflation
While consumer price inflation is a source of misery, the regular ‘misery index’ assumes that price deflation is a benefit that offsets high unemployment, and reduces the ‘misery index’, but in reality it is nothing of the sort.
Price deflation means the prices of items decline over time and, in theory, that should be a good thing. But for the unemployed, falling prices have a range of damaging consequences. Falling prices often translate into falling household incomes.
For example the primary causes of the 1890s depression and the 1930s depression in Australia, US and Europe were falling incomes resulting from falling prices of agricultural produce which were, at the time, the primary source of household incomes.
For those in the cities and towns, declining prices of manufactured goods, especially in economic recession and slowdowns, also act as a disincentive for businesses to invest.
Declining prices discourage people from spending money. If people believe that the price of an item is likely to fall in the future – a classic example these days is electronic goods like TVs – they have an incentive to delay purchases and buy it next year at a lower price (and probably with better features and/or quality), and this suppresses employment.
This is one of the main reasons governments deliberately target positive inflation – because it encourages spending and employment.
Deflation does the opposite – and it is particularly damaging when unemployment is already high.
See also: