What is the best or ideal asset allocation for long-term investment funds, including retirement/pension funds?
This is the single most important decision for portfolio managers, fund trustees, and individual investors. Far more important than picking individual stocks or funds.
Every retirement fund system in the world has more or less the same goals (to provide incomes to workers when they retire, including inflation protection, long-term real growth, optimal risk-adjusted returns, liquidity, etc). Every fund also has access to more or less the same assets globally.
The portfolio managers, asset consultants, and investment committees all read the same asset allocation textbooks, study the same global investment curriculum, and have access to the same global datasets.
Given they are trying to solve the same broad problem with the same set of assets, using the same set of tools, you would think they would come up with more or less the same broad asset allocation mix.
Surgeons and Plumbers
If I asked 100 different surgeons about a particular surgery, or if I asked 100 different plumbers about a particular plumbing problem – even if they came from 100 different countries, I would expect most of them to come up with more or less similar approaches and solutions.
Not in the investment world!
Retirement/pension fund systems in different countries have remarkably different asset mixes. Australian superannuation funds as a whole have the highest ‘growth’/’defensive’ mix of assets in the world.
Why? Does having the highest share of ‘risk’ assets mean we have the highest ‘risk’?
Retirement Fund Asset Mixes in 43 Countries
The main chart shows asset allocation mixes in retirement funds in 43 countries tracked by the OECD (2021).
In the case of Australia, it includes industry funds, retail, corporate, self-managed funds, etc., and it also includes government-run funds that are earmarked for providing pension benefits (including the Future Fund).
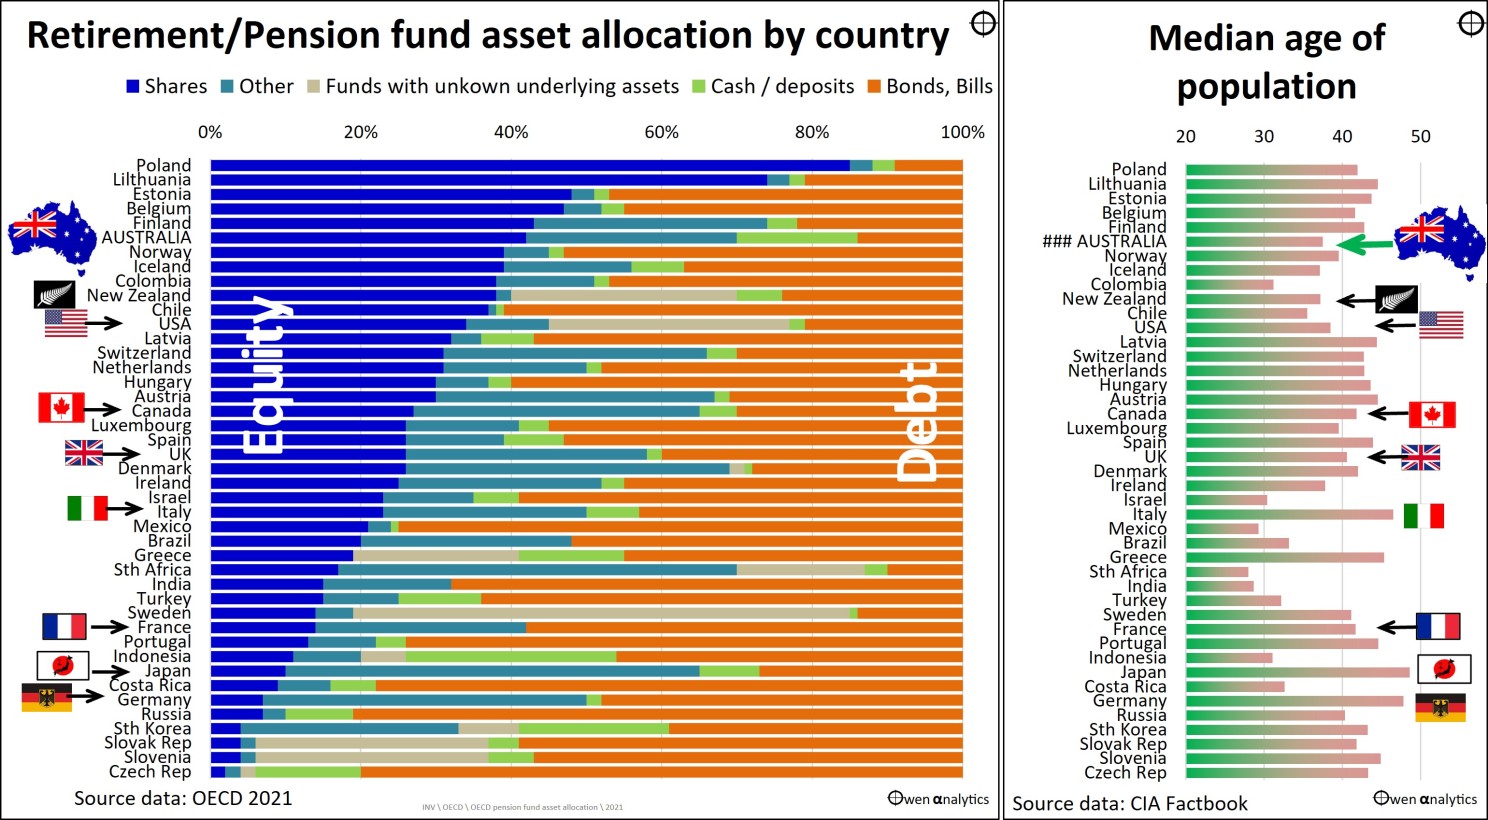
Chart of retirement fund asset allocation by country + chart of median age by country
On the left, the blue bars represent the allocation to shares in listed companies (‘equities’), which is the main type of ‘growth’ or ‘risk’ asset. On the right of the main chart, we have two colors for the main types of ‘debt’ (‘defensive assets’) – bonds and bills (orange), and cash and deposits (light green).
In between these two ends, there are two colors. ‘Other’ assets (dark green) include unlisted equity (private equity, venture capital, and direct share holdings), real estate, and hedge funds, which are generally classified as ‘growth’ or ‘risk’ assets. The final section (beige) represents pooled funds where the underlying assets are unclear. This is significant in some countries where fund reporting is opaque.
Extraordinarily Wide Differences in Asset Mixes in Different Countries
Although there are differences in definitions, retirement ages, life expectancy, pension systems, inflation, and tax regimes in each country, these would probably not be enough to explain the extreme differences in asset mixes.
Some countries have funds stacked with bonds and almost no shares - at the lower end of the chart. In more than one-third of countries, the allocations to shares are less than 20%. More than two-thirds of countries have more money in bonds than shares.
Australia is near the top of the chart, with around 70% in ‘growth assets,’ including more than 40% in listed shares. Australia has the smallest allocations to debt - except Poland, South Africa.
In Australia, we regard 50%+ allocations to shares as quite normal, but in most other countries, it is seen as outlandishly risky and negligent.
A few years ago, I was speaking at a conference in China, and I was on a discussion panel that included the CIO of one of the largest pension funds in South Korea. Their approved asset allocation was 90% government bonds, 5% REITs, and 5% cash. They were debating whether to increase REITs to 10%. That’s it!
No share at all!
Why these huge differences?
Demographics?
The right chart shows the median age in each country. Logically, we would expect some relationship between a country’s age profile and its asset allocation since we are looking at asset mixes across the whole of each country’s retirement fund system. But there is no relationship.
The two countries with the oldest populations - Japan and Germany - have very high allocations to bonds, and virtually no shares in their retirement funds, but the rest is a mixed bag.
The asset mixes in countries at the bottom of the chart might be appropriate if all of their fund beneficiaries were all like my 95-year-old mother, but they are not.
On the other hand, the asset mixes in countries at the top of the chart might be appropriate if all of their fund beneficiaries were all like my 23-year-old son, but they are not.
In fact, the median age in the five countries with the highest allocations to shares is exactly the same as the median age in the five countries with the lowest allocations to shares – 43 years.
Some countries with very young populations – including South Africa, India, Brazil, Mexico, Israel - have very low allocations to shares. Others with very old populations – including Poland, Lithuania, Estonia, Belgium, Finland – have very high allocations to shares.
Australia and NZ have the youngest populations in the ‘rich nations’ club, and we also have the highest allocations to shares. That at least makes some sense, relative to the rest of the world anyway!
Other Local Differences
Each country has very different customs, experiences, and capital market structures. These differences no doubt play a large part in the differences in asset mixes.
Australians have a long history of dabbling in speculative shares, going back to the early mining booms in the mid-1800s. We are the biggest gamblers in the world per capita - Statista), and Australia has the highest number of listed companies per capita in the world (World Federation of Stock Exchanges). We are, always have been, big risk-takers.
Conversely, Australians have an aversion to bonds. We have a relatively small domestic bond market – with relatively low levels of government debt, and an almost non-existent corporate bond market.
Some Implications
Does having the highest share of ‘risk’ assets, and lowest share of ‘defensive’ assets, make our system higher ‘risk’ and less ‘defensive’?
Not necessarily, especially in the current environment.
Advantages of a relatively high growth/defensive mix include:
- Superior inflation protection (all asset classes have lower nominal and real returns when inflation is high, but shares are still the highest returns of the major asset classes, albeit lower than when inflation is low)
- greater long-term real growth potential
- highest dividend yields (including franking credits/refunds) on domestic shares, which make up around half of our share allocations
- our relatively high allocation to domestic non-residential real estate offers inflation protection, an illiquidity premium, and lower daily price volatility
Disadvantages include:
- higher volatility of portfolio values
- higher volatility of portfolio incomes
- more vulnerable to equity bubbles & busts – eg technology, mining, biotech, [insert latest fad here].
- more vulnerable to industry/sector concentration within share allocations especially with our heavy ‘home bias’ – eg banks and iron ore miners in the case of Australia
- lower portfolio duration means less downside protection from bonds in recession sell-offs
Past versus Future
Much higher allocations to bonds in most other countries delivered near-equity-like returns from bonds with relatively low volatility over the past three decades of declining inflation and interest rates.
That era is now over.
In the new era of higher inflation and interest rates, shares offer superior inflation protection and higher nominal and real returns than bonds.
Bonds are only ‘defensive’ against share sell-offs when inflation (and inflation expectations) collapse in the share sell-off (eg 2008-9 GFC, early 1990s recessions, early 1980s recessions). These were in the era of declining inflation and interest rates.
Bonds offer no defense when inflation remains high, or is the trigger for the share sell-off (1976, 1973-4, 1965, 1960, 1951-2, 1948-9, 1920-1).
Australia in Pretty Good Shape!
In the future we are now in, the Australian superannuation system’s asset allocation mix looks a lot more attractive than just about any other country.
Of course, within each asset class, we need to have good fund and security selection. That is a given. But it is overall asset allocation that is the main driver of differences in portfolio returns and outcomes.
Thank you for your time. Please let me know what you think!