This week I did the final trades to set up a new portfolio. It is a new long-term diversified portfolio (in a separate broker account), with a chunk of cash I tipped in to kick it off.
I call it my ‘10-4 all-weather ETF portfolio’. It is a low-maintenance portfolio with three specific and measurable long-term goals: a return target, an income target, and a volatility limit. Here they are:
-
-
- Return target = 10% pa average total return after fees and taxes, measured over a decade.
-
-
- Income target = 4% pa average distributed income after tax.
-
-
- Volatility limit = no worse than the ASX ‘All Ordinaries’ Index (because that’s what makes the nightly news).
Why?
I have been using this approach for the past two decades, using many of the same ETFs (fortunately the range of ETFs has expanded greatly over time) – for my own money and in setting up and running a wide range of portfolios - everything from retail advice firms (with mum & dads, kids & grandkids) through to large ‘wholesale’ accounts, and ‘family offices’.
It’s the same approach that works for all amounts of money from a few thousand dollars (because ETFs can be bought for as little as $500 each), but it is just as effective for very large accounts, regardless of size, where the goals are the same – moderate returns ahead of inflation, with minimal risk of loss.
Clean up, simplify, re-focus
This year I have received more than the usual number of questions about how to clean up, simplify, and refocus ‘portfolios’. Actually, in most cases they are not ‘portfolios’ at all. They are more like haphazard, accidental ‘collections’ of random things they have added over the years.
Each holding sounded like a good idea at the time, but after a few years it turns into a haphazard ‘collection’ of things that make no coherent sense at all. Usually a couple have done well, but most end up in the 'bottom draw' waiting for a miracle.
Worse still, all this stuff ends up generating a constant stream of paperwork/emails and decisions – on things like rights issues, buy-backs, AGMs, EGMs, take-over offers, proxy battles, roll-overs, dreaded W-8 BEN forms, and a host of other constant hassles that need time and attention.
What is my 10-4 all-weather ETF portfolio?
It’s a serious portfolio with a serious amount of money in it, with a serious role.
The purpose and role is to generate total returns well above inflation, including moderate levels of growth and income through all sorts of economic and market conditions over many decades, to assist in meeting my long-term capital, income, and bequest goals, with minimal risk of permanent capital loss, and with minimal maintenance or worry.
In pursuing returns well above expected inflation, I understand and accept that the portfolio will go through ups and downs in capital values and income over time, and I am happy with this volatility - ie the volatility will not be enough for me to be panic buy in the booms, nor to panic sell in the busts that I know I will encounter along the way.
Where does it sit in the scheme of things?
Here is a Risk-Return map of ‘Investing’ versus ‘Speculating’. The horizontal scale (Risk of permanent loss) runs from risk-free cash and bank term deposits on the left, through to pure speculation on the right.
The vertical scale (Potential Returns) runs from 100% total loss at the bottom, to high gains at the top.
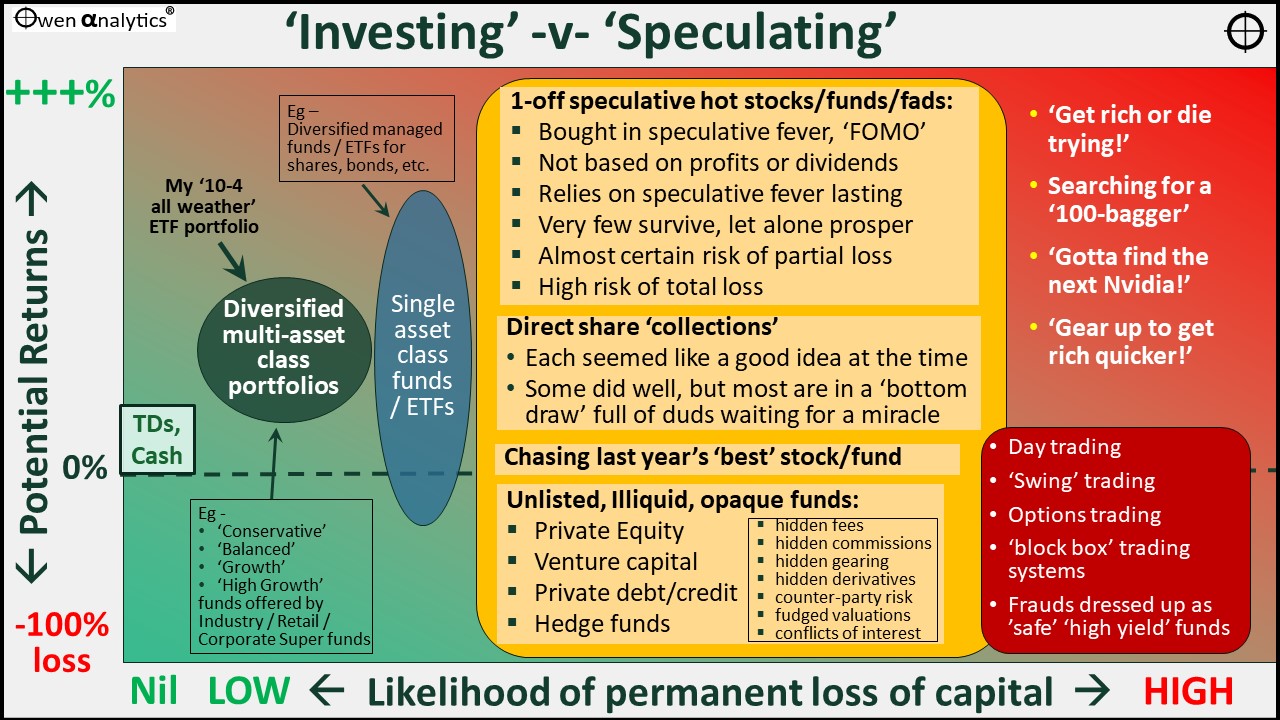
My low-maintenance 10-4 all-weather ETF portfolio sits with ‘Diversified multi-asset class portfolios’ in the dark blue circle on the left side – with moderate returns, some volatility, but minimal risk of permanent loss of capital.
Elsewhere in my personal balance sheet, I have a variety of other types of assets across the spectrum in different entities, including direct shares and real estate – but nothing on the right hand side of the chart of course!
What it is not
It is just as important to define what this portfolio is not.
-
- It is not exciting. It consists of a relatively small number of ASX-listed ETFs that anyone can buy with just $500.
-
- It will not chase hot fads or themes – like, ‘ai’, ‘battery metals’, ‘rare earths’, ‘crypto, ‘de-fi’, ‘fin-techs’, or [insert latest fad here].
-
- It will not search for a ‘100-bagger’, or try to find the next Nvidia, or chase hot IPOs.
-
- It will not panic buy in the booms, nor panic sell in busts. On the contrary, busts are great times to buy. (Just like in real estate, ‘you make your money when you buy’).
-
- It will not chase last year’s winners (asset classes, sectors, segment, funds, ETFs). This is a sure way to destroy wealth.
‘Cave money’ not ‘Play money’
Essentially this is ‘cave money’ – money that I and my family are going to rely on in decades to come.
Typically, it comes from regular contributions during working years. It also often includes money ‘taken off the table’, (eg after selling a business, or a house, or a hot stock that did well) to put aside in a safe place, out of harm’s way, for the long term – so I know it will be there to do its job in decades to come, regardless of what happens in the world.
The home for ‘Cave money’ is in the ‘Diversified multi-asset class portfolio’ circle on left side of the Risk-Return map.
‘Cave money’ is the opposite of ‘Play money’, which is money that people to use to chase the ‘100-bagger’, or to try to find the next Nvidia, or to chase hot fads of the day. This year it is ‘ai’ and ‘rare earths’, but fads come and go every year.
I am not saying ‘ai’ and rare earths are not important or life changing. They are, but that does not automatically make them good for ordinary investors.
The world is littered with examples of tremendous inventions that changed life as we know it, but turned out to be perennial graveyards for the vast majority of ordinary investors (eg commercial airlines, radio, VCRs).
There is a place for speculation with ‘play money’ – but not in this 10-4 portfolio.
I have nothing against going to the casino or race-track occasionally and placing the odd bet, or buying the odd ‘scratchie’. But we know that this is pure gambling with money we can afford to lose - ‘play money’.
The activities on the right of the Risk-Return map are in the same category. They are fine to do with play money you don’t mind never seeing again. Just make sure it doesn’t jeopardise your long term financial goals and lifestyle.
Why $1m?
$1m of my own money shows I’m serious.
It’s not a token amount I can afford to lose. I won’t be able to hide it or quietly close it down if it doesn’t go well. It is enough to make a meaningful difference to the living standards of me and my family in the decades to come.
This is a rather boring but reliable part of my overall wealth. Other parts of my personal balance sheet have more concentrated exposures, and therefore higher volatility and risk. However, this ‘10-4 all-weather’ portfolio is designed to be generate the returns I need for long-term financial goals as if it were the only long-term portfolio allocation I had.
This approach works with any amont of money from just a few thousand dollars (because each ETF can be bought with just $500), but I have also used it as the basis for discretionary portfolios totalling literally billions of dollars across thousands of investors over the past two decades.
Ok, now we get into the nuts and bolts of the goals of the 10-4 portfolio -
10% return target sounds pretty boring – why not more?
Many people might see this and say, ‘10% sounds pretty boring! I made 30% last year!’
This is not a ‘get-rich-quick’ or ‘get-back-on-track’ portfolio. It is designed to generate moderate levels of growth and income over many decades through all sorts of economic and market conditions, with minimal risk of permanent loss of capital. I want it to keep financing my financial goals for many decades, with minimal maintenance or worry.
Why 10%?
10% is a nice round number to aim for!
10% is consistent with long-term average returns from the best share markets in the world, through all sorts of conditions including high & low inflation, political crises, deep recessions, world wars, countless minor wars and conflicts, and a host of booms & busts. Eg:
-
-
- Australian shares have generated total returns averaging 9.0% pa over the past 30 years, and 11.1% pa over the past 50 years. (All Ords TR to June 2024)
-
-
- US shares have generated total returns (in USD) averaging 10.6% pa over the past 30 years, and 11.4% pa over the past 50 years (S&P500 TR to June 2024).
Note that these historical average returns of around 10% pa from Australian and US share markets were attained with relatively high levels of volatility and deep setbacks along the way. However, I want to achieve decent returns without the same deep setbacks if possible. I don’t want to be tempted to sell in crashes. I want to be able to ride them out, and buy more when prices are low. See section on ‘Risk Limit’ below.
After fees and taxes?
Also note that these market returns were before fees and taxes, whereas my return target is after fees and taxes, because that what happens in the real world.
I will minimise fees by using mainly low-cost index funds/ETFs, and having relatively low turnover.
I will minimise taxes because this portfolio is part of my super fund in tax-free ‘pension’ mode.
Is 10% realistic? No other large professionally-run fund has achieved this.
A long-term return target of 10% pa might sound rather tame, but it is actually more than any other large diversified long-term fund has been able to achieve in Australia. For example:
-
- The Australian government’s sovereign wealth fund - the Future Fund (Target = CPI+4-5%, with an 80/20 growth/defensive mix) has returned an average 7.6% pa in its 17 years since inception (May 2006), against a target return of 7.0% (data to Dec 2023).
-
- Australia’s largest industry super fund – Australian Super – its ‘Growth fund’ (CPI+4% target, with a 75/25 growth/defensive mix) has returned an average of 9.1% pa in its 37 years since inception (1987), and 8.1% pa in the past 20 years (to Dec 2023).
-
- The construction industry fund, Cbus Super’s ‘Growth (MySuper)’ option has returned an average of 8.9% pa in its 39 years since inception (1984), and 7.8% pa over the past 10 years.
-
- The Health and Community Services industry fund, Hesta - ‘Balanced Growth has returned an average of 8.5% pa in its 37 years since inception (1987), and 7.6% pa over the past 10 years.
-
- Education industry fund, UniSuper – Balanced fund (targets CPI+3% with a 72/28 growth/defensive mix) – has returned an average 7.9% pa over the past 10 years, and 7.8% pa over the past 20 years (to Dec 2023).
-
- A comparable diversified index fund - Vanguard’s Diversified Growth Fund (VAN0110AU) which has an equivalent ETF (ASX:VDGR) – is probably the most appropriate diversified index fund to compare these public funds against. It has returned an average of 7.7% pa over the past 22 years since inception (2002), and 7.5% pa over the past 10 years. And, yes, anyone can buy the ETF version (ASX:VDGR) with just $500. BetaShares also have a similar diversified growth ETF (DHHF), but the Vanguard one has been around for a lot longer.
These are considered to be the best performing large, diversified long-term funds in Australia. Each has hundreds of thousands or millions of members and large teams of highly paid portfolio managers and research analysts. On the other hand, ‘Corporate’ and ‘Retail’ super funds have had lower returns, mainly due to their higher fees and sales commissions.
NB - You will no doubt notice from the above returns that the ‘leading’ industry funds mentioned above have done no better than the bog-standard Vanguard diversified index fund with the same broad asset allocation! (The ‘Compare the Pair’ ads are about expensive Retail funds because they are an easy target!)
From these examples of large, diversified funds with 70-80% growth portfolios, it would seem that a target of around 8% pa (or around CPI+ 4%-4.5%) is all that can be expected and achieved from long-term growth-oriented diversified funds. That’s not bad, but I would still like to target a nice round 10% pa.
Why a ‘nominal’ return target, not ‘real’ (after inflation) like most institutional diversified funds?
‘Real’ returns are harder to explain and measure. On the other hand, nominal returns are simple and transparent. It’s what appears on portfolio statements. I want returns to be clearly visible and measurable.
I don’t want to wait months for the inflation number to come out, and I don’t want to have to make adjustments to prior quarter and year results when official inflation numbers are subsequently adjusted, as they often are.
Why an ‘absolute’ target (10%) and not a ‘relative’ target (eg x% above a ‘benchmark’)?
It is standard practice in the investment industry to target returns relative to a specified blended benchmark that is appropriate for its mandate and portfolio asset mix. This suits the industry, but it is meaningless for investors.
What I want as an investor is a portfolio that generates returns in actual money terms, not returns relative to some theoretical ‘benchmark’.
For example, let’s say a particular fund’s stated return ‘benchmark’ (eg the All Ords, or ‘MSCI World’, etc) falls by -40% one year (like in the GFC). If a fund’s value fell by ‘only’ -35%, the fund manager has done well in relative terms and gets paid a bonus (out of my money), even though I am 35% poorer! That doesn’t make sense.
Why a 4% income target?
My 10% average annual total return target includes an average income target of 4%.
This portfolio is designed to generate total returns over long-term (multi-decade) holding periods, from an investor’s ‘accumulation’ phase (while working, when portfolio income is reinvested) through to ‘pension’ phase (in retirement).
In planning retirement portfolios, my basic rule of thumb is that a 60-70 year old retiree generally needs around 25 times their annual spending budget (ie they can withdraw 1/25 of the balance, or a 4% ‘safe withdrawal rate’) to have a high degree of confidence that their portfolio will continue to keep growing for inflation after 4% withdrawals each year, so the withdrawals, and the balance after withdrawals each year, can keep pace with inflation to maintain their purchasing power and living standards indefinitely (or at least until they or their partner live to 100).
It is no coincidence that 4% is the legislated starting point for compulsory withdrawals (for those up to 65 years of age) from pension accounts under the superannuation rules in Australia. The legislated 4% withdrawal rate then rises over time as the beneficiary ages. This is designed force people to run down their capital and not leave a legacy (government mandated Super was intended to provide for retirement incomes, not a tax-advantaged estate-planning tool).
In my case, however, I don’t want to run down capital. I want preserve capital and leave a legacy. I will re-invest the income for this portfolio, so the statements show ‘total returns’.
Franking credits?
The portfolio’s income (and total return) goals include franking credit refunds where available, as this is what happens in real life.
Franking credits on Australian shares have added an average of around 1.5% pa to total returns to diversified Australian shareholder returns over the past decade.
Why not higher than 4% income?
People will say that they can get much higher income than 4% on their money. That is true of course – today (2024), the official cash rate in Australia is above 4%; boring bank term deposits are paying more than 5%; and there are plenty of low-ish risk, diversified ‘income’ funds paying more than 6% or even 7%.
The problem is that these ‘income’ investments usually have no inflation protection, and no growth prospects, so they will be a drag on my overall portfolio return target of 10%.
There are ‘income’ products on the market that claim to offer returns of 10% or even more, but they invariably carry unacceptably concentrated risks and/or unacceptable risks of permanent loss of capital (or are straight-out frauds).
Is 4% income achievable?
This will actually be a tough dual goal to achieve, because my relatively high total return goal (10%) will require mostly ‘growth’ assets (mostly company shares) most of the time, where most of the total return is in the form of capital gains, with a relatively small part of the total return coming from income.
The Australian share market (even before franking credits) pays the highest dividends in the developed world, but I want to diversify beyond just the local Australian share market, so this will mean lower overall dividend income than investing in the Australian share market alone.
It is true that some sectors of share markets pay higher dividends (eg bank shares), but there is a trade-off between dividends and future earnings growth – higher dividend yields usually mean lower long-term capital growth because high dividend paying companies pay out their profits in dividends, rather than invest for future growth.
One of the implications of the 4% income target is that it will prevent the fund from investing too much in assets that may offer greater growth potential but pay zero income (eg gold or crypto), or low income (eg tech sector, ‘growth’ stocks, the US share market, NASDAQ, etc).
In addition, the current conditions make hedging foreign assets (shares, bonds, etc) very expensive. Because cash rates are higher in the US than Australia at the moment, the FX hedge on hedged global funds/ETFs knocks about 1% straight off the top of the dividend and interest income.
Why have a ‘Risk’ or ‘Volatility’ limit?
My volatility limit is for the portfolio’s setbacks to be no worse (no deeper or longer) than the Australian All Ordinaries index.
In truth, I don’t really want to have a specific volatility/risk limit because volatility limits are generally imposed on portfolio mandates to try to reduce the frequency and depth of short-term negative setbacks that tend to spook investors into panic selling or even abandoning the whole strategy when prices are low in a panic sell-off.
I actually look forward to market-wide sell-offs (the deeper the better!) as they create rare buying opportunities.
Why the ‘All Ords’?
Because that is the most quoted number in news media reports in Australia. (If I were in America, I would use the ‘Dow Jones’).
News headlines are designed to scare people. For example, nightly TV news bulletins often feature shrill announcements like: ‘The All Ords was down x% today, so we are all now x% poorer!’ That is nonsense of course, unless you are spooked into panic selling, which turns a temporary 'paper' loss into a permanent actual loss.
Why not use a ‘standard deviation’ target, like most professional funds?
In the investment industry, ‘risk’ is defined as ‘volatility’, and this is expressed as the annualised ‘standard deviation’ of price variations over time.
(Ok, since you asked: the ‘annualised standard deviation’ of a return series is the square root of the sum of the squares of the arithmetic differences between the natural log of the return each period and the natural log of the mean period return, multiplied by the square root of the number of measurement periods per year. See!).
This theoretical measure is misunderstood by most investors and even most investment professionals. Anybody who knows the maths behind it understands how flawed it is (ie divorced from real world markets).
I prefer to define risk in different ways that affect real investors in the real world. For me, ‘risk’ is:- the risk of running out of money, the risk of not keeping pace with inflation, the risk of permanent loss of capital, the risk of not being able to achieve important cashflow, capital and bequest goals.
Why a ‘volatility limit’ is useful?
Having a volatility limit is actually a very useful discipline. For example, without a volatility limit, I could simply gear up the portfolio and/or invest in highly speculative ventures, or derivatives. This might magnify returns during a rising market, but the setbacks would be much deeper, and would risk wiping out the fund altogether. Having a volatility limit restricts the use of debt, derivatives, and speculation.
Having a volatility limit means I cannot chase high short-term returns. This fund will not double or triple my money in a year or two, but it will also minimise the risk of blowing up the fund, and provide confidence that it will survive through all sorts of market conditions.
Having a volatility limit also means the fund will not be able to invest in individual companies or securities, or in this case, narrow ETFs. Widely diversified exposures, plus the inability to gear up the portfolio or use derivatives, minimises the risk of permanent loss of capital.
Simple, no unnecessary complexity
The portfolio holdings are relatively simple. People will look at them and say: ‘That’s easy – any 10 year old kid could do that!’
That is actually the point. Long-term investing need not be that difficult. All of the building blocks are available to anyone with an internet connection and an online broker account. The problem is that there is simply too much choice, and too many temptations out there. I will ignore 90% of the ETFs available on the market, and just use a handful that I need.
There is no need for fancy, complex products that have hidden layers of fees, derivatives, gearing, commissions, opaque structures, conflicts of interests, fudged valuations.
Why just ASX-listed ETFs?
Fortunately, thanks to the proliferation of ETFs, there are plenty on the menu these days. Too many, actually.
There are now more ETFs than investable shares on the ASX. Here is the ASX’s current list of ETFs. (348 in June 2024).
(True, there are 2,400 entities listed on the ASX, but well over 2,000 of them are tiny, illiquid, cashless, profitless specs that struggle to pay their annual listing fees, and have little more than hope and hype.)
Likewise, 90+% of the ETFs on the ASX are fascinating on the surface, but no good for my long term, low-maintenance portfolio.
Although there are hundreds of ETFs available, most are too narrow and specialised for my needs, and some are downright crazy (who needs a geared, short, hedged US treasury bond fund (BBFD), seriously!?).
(Despite the hundreds of ETFs on the market, there are still some real gaps – eg I would like an un-hedged global or US government bond ETF)
ETFs are like bricks
ETFs are NOT the magic pill solutions they are often made out to be.
ETFs are like bricks to an architect. By themselves they are just bricks. Using the same bricks, you can build a great building, or you can also build a disaster waiting to happen.
What is important is how you put different types of bricks together to create a portfolio that does what you want it to do.
How many ETFs do I use?
Of the 348 ETFs listed on the ASX, I have only approved 30 for use in the portfolio, and I am currently using just nine to get all the exposures I want at the moment, across Australian and global asset classes.
Here is how the ASX-listed ETFs break down:
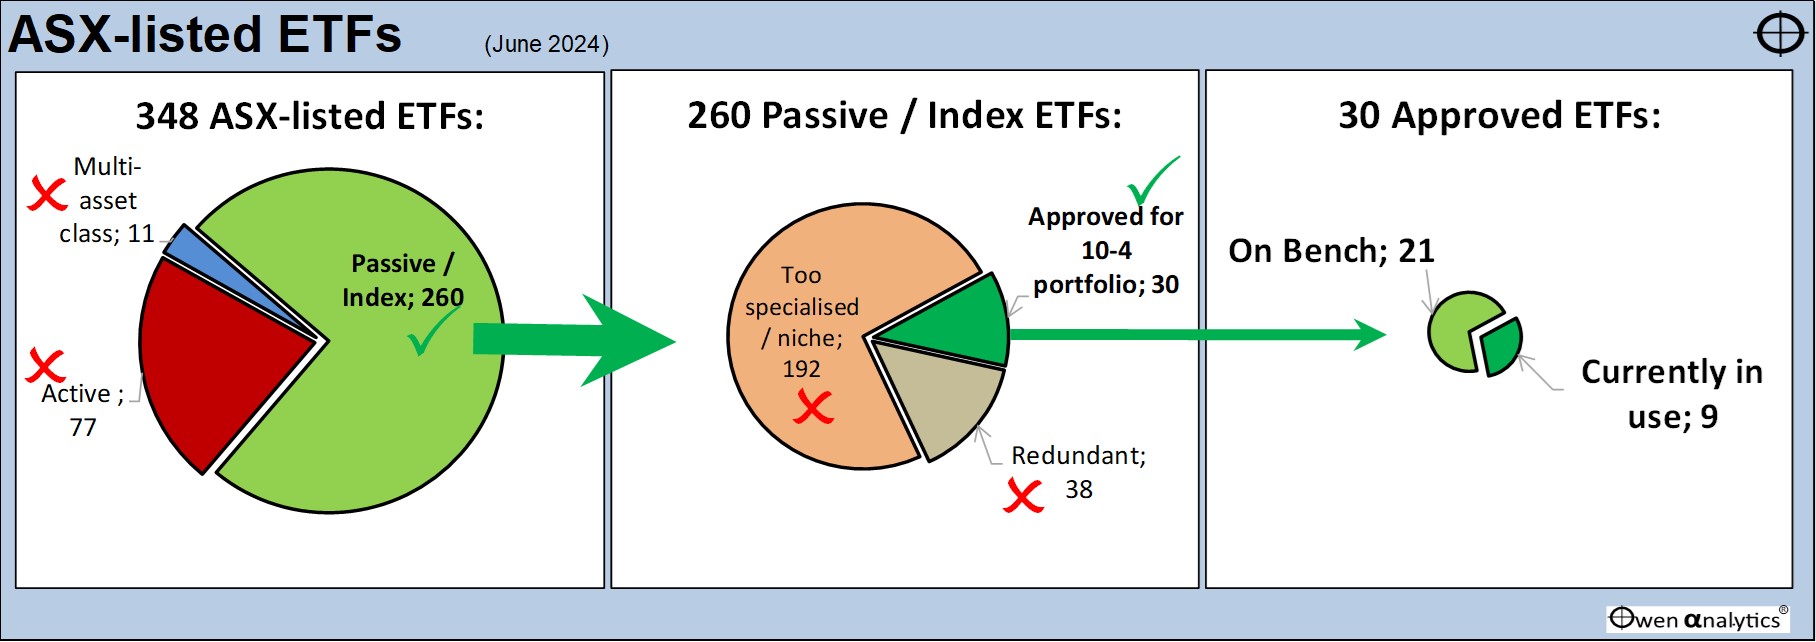
Of the 348 ETFs listed on the ASX (left pie chart):
-
-
- 77 are active funds run by fund managers – these are no good for this purpose (or any purpose really).
-
-
- 11 are multi-asset class ETFs – these are fine in principle, but they have fixed allocations and rigid rules that are not appropriate for all conditions. I want to adjust the mix of asset classes and sectors/segments to suit market conditions from time to time.
-
-
- 260 are passive / index funds that track a specific index – this is what I am after for this portfolio.
Of the 260 passive / index ETFs (middle pie chart):
-
-
- 192 are too specialised for my long-term, low maintenance portfolio.
-
-
- 38 are redundant – they are useful, but are too similar to others that are better/cheaper.
-
-
- Only 30 are approved for use in this portfolio.
Of the 30 ETFs I have approved for the 10-4 portfolio (right pie chart):
-
-
- I am currently using 9 in the portfolio.
-
-
- That leaves 21 ‘on the bench’, ready for use in the right conditions.
Which ETFs?
I will list my approved ETFs and the ones currently in the portfolio, and their weights, in the next story in a few days.
I will also describe in what types of market conditions they suit and don’t suit. (No secret – just too long for this story.)
‘Active’ or ‘Passive’?
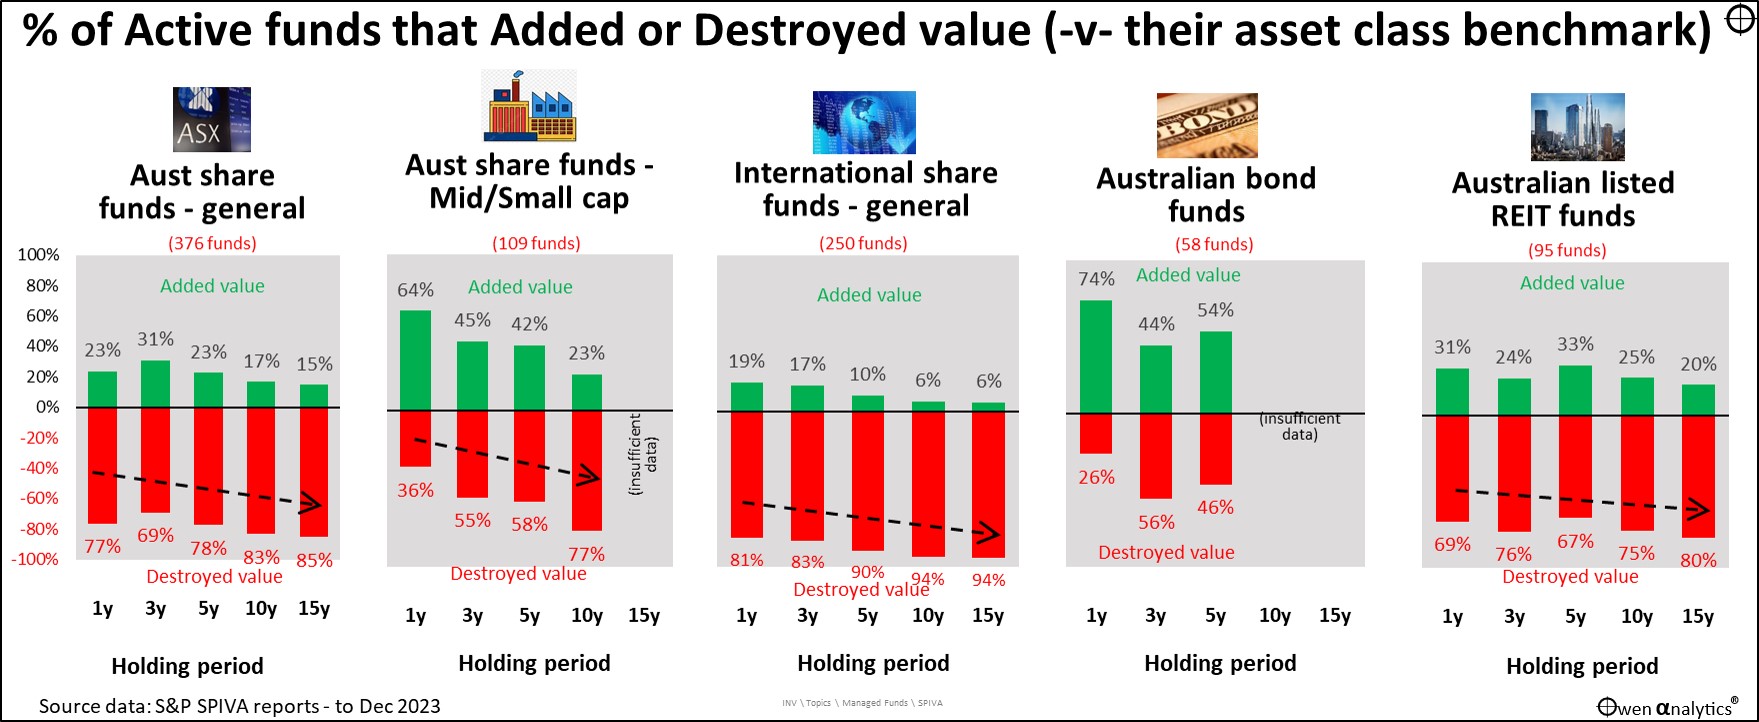
Within asset classes and sectors, this portfolio uses passive/index ETFs rather than active funds. Very few active funds have added value after their fees and transaction costs, over any length of time. Most actually started off with great returns in their early years, but all or almost all fade over time, for a variety of reasons.
This is well documented across every asset class in every country – including Australia. For example, see:
· 22-May-2024-Update: Most active fund managers continue to destroy value and line their pockets with your money – why do we let them? (22 May 2023)
I have nothing personal against active fund managers. Many of them are good friends. I have used active funds in other parts of my assets over the years, but this portfolio is designed to achieve the same or better returns than active funds, at lower cost, and with lower entry levels (ie lower minimum investment size).
‘Active’ between asset classes and sectors
Although within each asset class I use passive ETFs that just track an index, between individual asset classes and sectors - I will be active from time to time through each market cycle as conditions change.
For example - adjusting the mix between Australian and international shares, adjusting the mix between hedged and unhedged international shares, adjusting the bias toward particular sectors, or strategies within each asset class, to suit market conditions. All with passive ETFs that track an index at minimal cost.
It works!
In running discretionary portfolios for thousands of investors for advice firms over the past two decades, the diversified portfolios (‘Conservative’, Moderate’, Balanced, ‘Growth’, etc) were offered in two flavours – an ‘Active’ version and an ‘Index’ version. The ‘Active’ version contained a mix of active and passive funds in each asset class, and the ‘Index’ version was made up of ETFs, using many of the same ETFs in my 10-4 portfolio.
The Active and Index version of each portfolio used the same asset allocation rules and the same asset allocation changes over the various market cycles and conditions over the years.
The results? In all cases, over all time periods, the ‘Index’ versions beat the ‘Active’ versions by an average of around 1% per year. It is still the case today.
Why? Mainly because the active funds were much more expensive and under-performed the index funds. As it turned out, about half of the active funds we used did add value, but they were always clobbered by the few that lagged badly.
Fairly lazy
Generally, I only adjust portfolios once or twice per year at the most. Sometimes I retain the same allocation for two or three years without making any changes. The aim is for a low-maintenance, low-hassle portfolio. Most of the adjustments are usually just regular re-balancing holdings back to their target weights.
I will not be sweating over the portfolio values or performance every day or week or month. The process I use for my roles on Investment Committees is for quarterly reviews of all asset classes and holdings. In most quarters, I recommend no changes, but there are occasions when changes are needed.
Why now? Why not wait for a correction?
Of course, the perfect time to start a new portfolio would be at the bottom of a correction, and the worst time would be at the very top of a boom right before a crash. Unfortunately, the bottoms of crashes and the peaks of booms are only visible in hindsight.
At the moment, we are clearly in a boom driven by US tech stocks. Share markets everywhere are expensive, but booms can run for many years before collapsing. (For example - the 1990s US tech boom ran for ten years in a straight line upward, until the 2001-2 ‘tech wreck’).
I would rather be fully-ish invested during the booms, and then deal with the dips and corrections when they occur, which is frequently.
Will current pricing affect future returns?
I fully expect that future returns (from current expensive heights) will be lower than past returns.
Although Australian and US share markets have historically generated returns averaging around 10% pa, my 10% return target will be quite difficult to achieve starting at current levels because all share markets (and all other types of assets) are still over-priced at the moment (2024) as they are still priced on the assumption of a quick return to low inflation and low interest rates in the post-GFC world of ‘ZIRP’ (zero interest rates) and ‘QE’ (‘quantitative easing’ - ie central bank bond buying to suppress interest rates).
Investment markets will probably fall back to more reasonable levels when the reality of higher inflation and interest rates sets in. This correction will affect my portfolio’s returns, but that’s life in the real world. I’m in this for the long term – beyond the current cycle.
In the next instalment of this story I discuss the 30 approved ETFs, and the 9 currently in use – and why.
Stay tuned!
‘Till next time – happy investing!
Thank you for your time – please send me feedback and/or ideas for future editions!
(I want to make it very clear that I receive no direct or indirect financial or non-financial benefit from any ETF provider, or any other product provider).