Active fund managers are almost universally useless. Here is my updated report on how much wealth they destroy for Australian investors.
- Are they getting any better?·
- Why do we let active fund managers take $4.5 billion from investors’ pockets every year?
- Where does the money go? How much do they pocket?
- And how much do they just throw away through incompetence?
Active managed funds in Australia destroyed $4.5 billion of wealth from retail investors in 2023. Half of this was a straight transfer of wealth from the pockets of innocent investors to the pockets of fund managers. The other half was genuine wealth destruction through incompetence.
S&P’s ‘SPIVA’ reports
For the past 20 years, global index provider S&P has published regular surveys of active fund performance in Australia and other major markets around the world. The series is called ‘SPIVA’ (‘S&P Index Versus Active’). They compare how active funds perform against the benchmark index they are trying to beat in their chosen asset class.
The results are always the same – the vast majority of ‘active’ funds consistently under-perform their benchmark.
Investors would be far better off using low-cost ‘passive’ index funds/ETFs. Passive index funds don’t have over-paid active fund managers and teams of expensive analysts trying to pick stocks. They just buy all stocks in the chosen index at their index weights, and automatically re-balance (adjust) the weights regularly so the holdings keep track of the index.
That’s it. Simple, low-cost, passive index funds beat most active funds most of the time. It is the same in all markets everywhere.
‘ETFs’ (Exchange Traded Funds) also offer other advantages of transparency and tax-effectiveness.
With the power of compounding, even small differences in annual returns add up to big differences in wealth and incomes over many years.
Why do they bother?
The only reason an active fund manager gets out of bed each morning is to beat the market. If they can’t beat the market, they should hand back investors’ money and get a real job.
If they were smart, they would just buy all stocks in the index they are trying to beat, then take the rest of the day off, knowing that just ‘buying the index’ would beat most of their peer active fund managers most of the time. But they are not that smart.
Why do active fund managers continue to try to beat the market despite continued failure year after year?
Mostly ego. They all think they are the next Warren Buffett. They all start out with a lucky break – they might have picked some tech stocks in a tech boom, or lithium stocks in a lithium boom, or biotechs in a biotech boom, or whatever. They confuse luck with skill, and they think they can pick the next boom, and the next, and the next.
They can’t. The results prove it. Every year!
Funds management is a ridiculously high paying industry (ie high cost for investors). That would be justifiable if the industry as a whole added value. It doesn’t. It destroys billions of dollars of investors’ money every year.
SPIVA results to December 2023
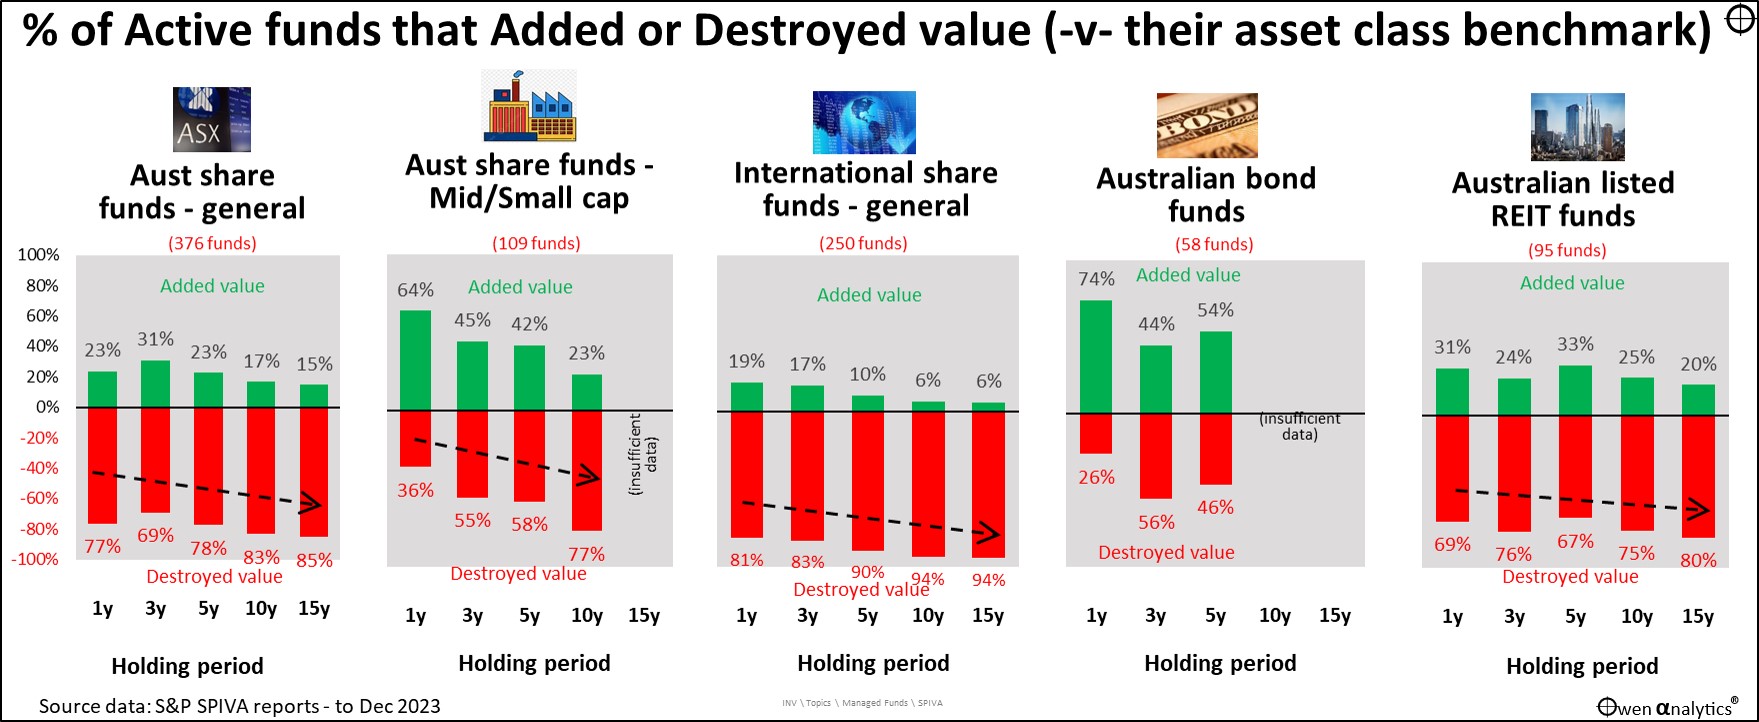
The first chart shows the performance of 1,000 active funds across the main asset classes in Australia. (There are actually many thousands of active funds available on retail platforms, but most are duplicates and different versions of the same fund, eg for different classes of units, or for different ‘platforms’, or with different fee structures.)
The chart shows the proportion of active funds that out-performed (positive green bars), or under-performed (negative red bars), the market benchmark index for their asset class. (The benchmark index for Australian shares is the S&P/ASX200 index, and so on. Full details are in the SPIVA reports).
Performance is shown over different holding periods (1 year, 3 years, 5 years, 10 years, 15 years) to December 2023.
Full credit to S&P for doing the work and publishing the results. The full report is here.
The charts in my story are simply my way of highlighting the results.

It's a depressing sea of red ink – for almost all types of funds, and over almost all time periods.
Different holding periods
For shorter-term holding periods (1y, 3y), we would expect a significant proportion of active fund strategies to lag their index because short-term cycles might favour particular sectors or stocks, and/or reflect the latest market fad.
However, we are more interested in longer periods as we are long-term investors. Longer holding periods (5y, 10y, 15y) should smooth out these short-term cyclical swings and reveal real stock-picking skill in active funds. Anyone can get lucky over short periods, but if they manage to beat the market for a decade or longer, it is more likely to be genuine skill, not just luck.
Good in theory but, in practice, performance over longer terms actually gets worse, not better! This is indicated by the black arrows.
The longer you hold onto an active fund, the less chance it will ever add value. It is much better to cut and run early, rather than grimly hold on, hoping for a miracle.
This is where I have made mistakes over the years – not dumping under-performing active funds soon enough. (I should have left ‘Holding On For a Hero’ to Bonnie Tyler!).
Just as with individual stocks – the buying decision is hard enough, but knowing when to sell is even harder.
Let’s take a look at active fund performance in the main asset classes -
Broad Australian share funds
This is the largest segment of active managed funds in Australia, and it has always been a serial wealth destroyer for investors.
The local ASX market is dominated by the four big dinosaur banks, three big miners, some mature, century-old behemoths (CSL, Telstra, Woolworths, etc), and a small handful of 'younger' giants (Macquarie, Woodside, etc).
There are truckloads of ‘research’ reports on the largest fifty or so companies on the ASX, so it is hard for active fund managers to dig up better, or faster, information on these companies that they can use to beat the market.
They try, but most never succeed in beating the overall market index over any length of time.
Smaller company funds
This is an area where active management should be able beat the index because they are dealing in companies that have far less research coverage than the larger companies. Active managers should be able to obtain an information edge that should enable them to buy or sell shares before the rest of the market gets the news. They don’t.
2023 was a very unusual year, because 64% of active small company funds did manage to add value. But over longer periods most under-performed, as per the usual practice.
International share funds are the worst
Australian fund managers’ record of picking international stocks has always been woeful. There are almost universally useless.
What makes fund managers think they can know more about companies on the other side of the world than 'experts' in the companies’ home markets? The further away from a company you are, the less likely you are to get an information edge that you can exploit to beat the market.
Australian bond funds
This is the only area where a decent number of active fund managers have added any value against the market ‘index’. The main reason is NOT that they are smarter or have better knowledge (the bond market is dominated by a single issuer – the Commonwealth Government). It is because ‘the market’ is an arcane ‘over-the-counter’ market between bond dealers who trade mainly in $10 million parcels, rather than an automated, electronic market like the ASX, where the minimum trade size is $500.
In these opaque over-the-counter markets, the ‘benchmark’ index is largely theoretical, which makes this type of active-versus-index not very informative.
REIT (property trust) funds
There are only a dozen investable REITs on the ASX, but there are more than a hundred active funds that invest in REITs and try to beat the passive REIT index. Almost all do a lousy job over all time periods.
The local REIT market has always been very lumpy, dominated by a single giant stock. For decades it was Westfield, but that was bought by Unibail-Rodamco (France) in 2018. Now the dominant ASX-listed REIT is Goodman.
The biggest driver of active fund performance relative to the passive REIT index comes down to just one decision - do you over-weight or under-weight the dominant stock. Simple. But most active REIT funds get it wrong most of the time! And it gets worse the longer they keep trying!
They should all just buy the index first thing in the morning, then go to lunch for the rest of the day!
How much wealth is destroyed by active funds?
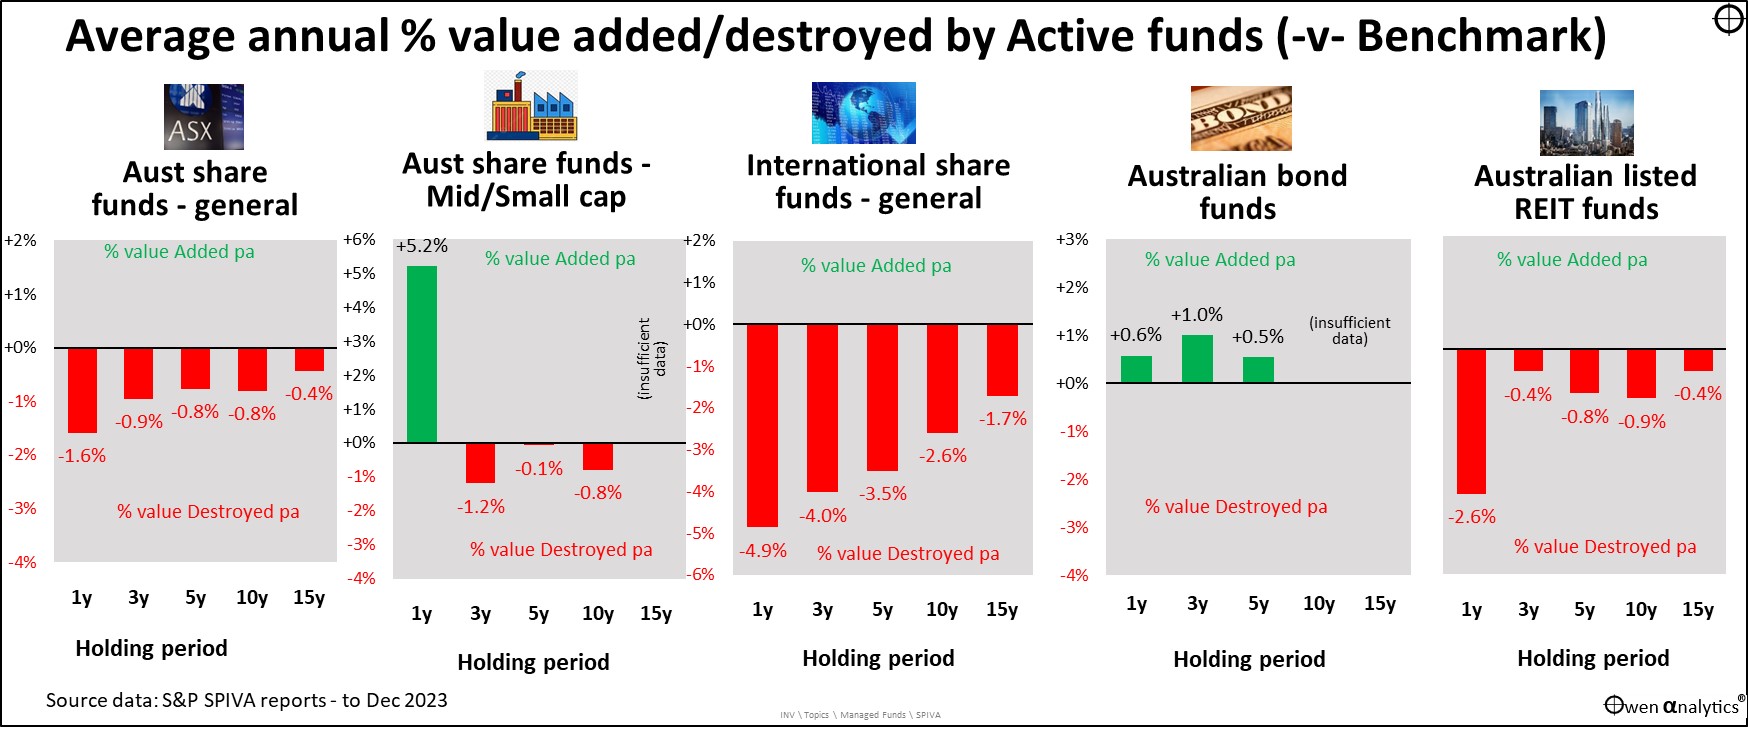
The next chart shows average under-performance of active funds relative to their market benchmark index, over the different holding periods (1y, 3y, 5, 10y, 15y).

This is also a sea of red ink every time S&P publishes its SPIVA reports. The worst under-performance is in international share funds, but all asset classes (except bonds) are woeful.
This time we have the exceptional 1-year out-performance of small company funds, but over longer periods they under-perform.
$4.5b in investor wealth destroyed last year
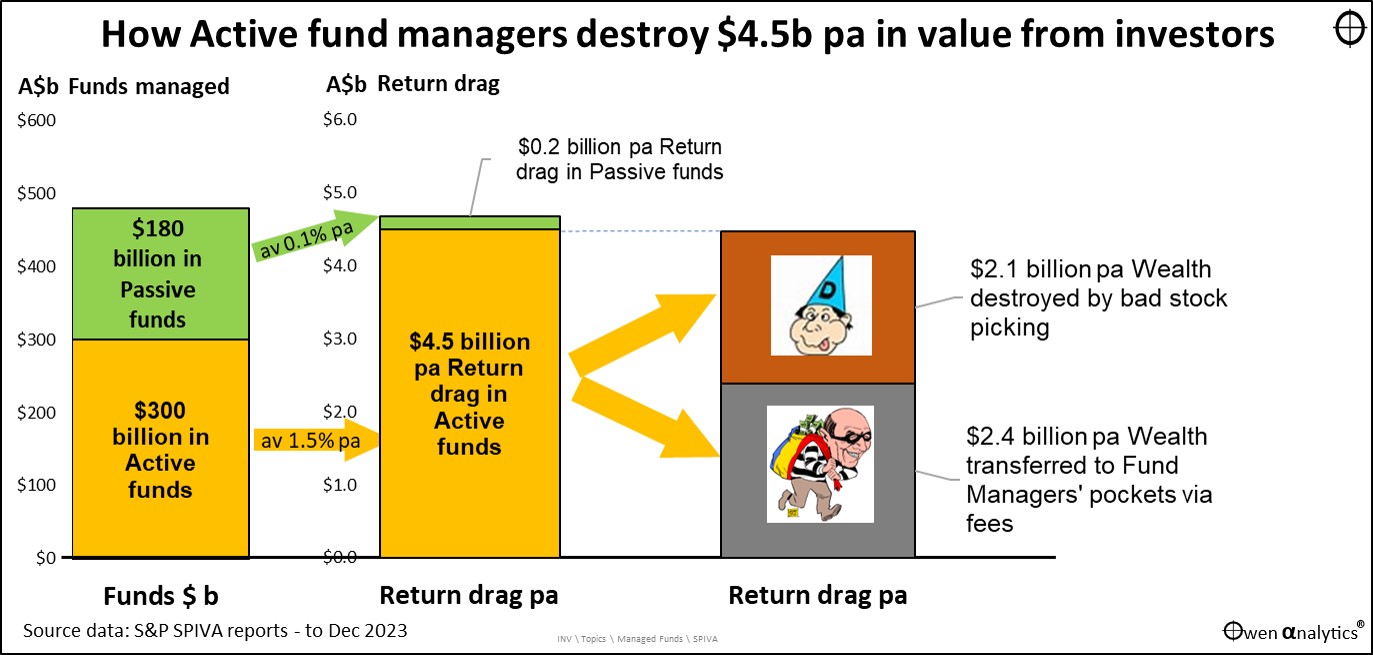
There is $480 billion invested in retail managed funds in Australia (ABS 5565). Around $300 billion of this is in active funds, and around $180 billion is in passive index funds, including $160 billion in index ETFs (BetaShares ETF review).
Under-performance in the active funds averaged around 1.5% per year, or $4.5 billion per year in value taken from the pockets of retail investors.
This destruction of wealth is completely unnecessary because investors can get better returns from passive index funds for each asset class – over all holding periods.
This should be a national scandal, but nobody takes any notice - except of course active fund managers who are lining their pockets with our money!
Where does the money go?
Here is where the return drag totalling $4.5b goes:

About half of the under-performance is due to active fund fees – so that part is not really value ‘destruction’ - it is a straight transfer of wealth from investors’ pockets to the fund managers’ pockets.
The other half of their under-performance is genuine value-destruction due to incompetence.
‘But 100% of Passive index funds/ETFs also lag their benchmarks’
Active fund managers retort, saying: ‘Yes, we know 90+% of us are useless and under-perform the market consistently (but I’m different – I’m the next Warren Buffett!), but 100% of passive funds under-perform as well! At least some of us get lucky once in a while. No index fund ever beat the index!’
That is true – 100% of passive/index funds and ETFs lag the index they aim to track, by definition, because of their management fees. But passive fund fees are a less than one tenth of active fund fees, on average.
The total return drag from $180b in passive index funds/ETFs is $200 million per year. This is declining as ETFs fees have been declining in recent years. You can now buy broad market ETFs for well below 0.10% pa.
But the total return drag from $300b in active funds is a whopping $4.5 billion per year. That’s $4.5b in your wealth – gone. Every year.
The power of compounding in reverse
Passive funds provide good value in allowing even very small investors to access investment markets at very low cost.
Active funds offer a very expensive way for investors to throw their hard-earned money away and have less wealth and income for the rest of their lives.
A tiny proportion of active funds DO add value over the long term, but the chances of ordinary investors finding them – IN ADVANCE – is extremely slim.
Ordinary retail investors can buy passive index ETFs with management fees below 0.10% pa in the case of ETFs for the broad Australian and international share markets, and a little higher than that in the case of REIT and bond ETFs.
The average return drag for active funds is around -1.50% pa, versus around -0.1% pa for broad market-tracking index funds.
With the impact of compounding over time, a return difference of just 1% higher fees per year compounds into -18% lower wealth and income over 20 years, and -26% lower wealth and income over 30 years.
Why is this allowed to continue?
Simple – because retail investors keeping giving active managers their money!
Why?
- Because of the power of marketing and money. The billions of dollars active funds siphon off from investors each year buys a lot of advertising and marketing spend.
- Financial planners have always been the main sellers of active funds. Straight-out sales commissions have been outlawed (sort of), but managed funds still sponsor adviser conferences, ‘training’, and a host of other benefits.
- Media outlets – newspapers (remember them?) are also riddled with fund manager ads and glowing sponsored stories about ‘rock star’ fund managers and their latest hot stock picks.
(Spoiler alert: fund managers on the ‘Rich List’ got there from their fund fees, not by investing in their funds!)
- Investment seminars – offered by these ‘free’ sites and services – are also sponsored by managed funds.
- Many investors are lured into last year’s best-performing funds trumpeted in glowing (sponsored) media reports. Chasing last year’s winners is another story for another day, but is a sure way to destroy wealth.
- There is also probably a small part of all of us who believe that even if we are not going to BE the next Warren Buffett, then maybe we can FIND an active fund manager that turns out to be the next Warren Buffett.
ASIC should apply the APRA Super fund test to managed funds
The industry regulator for Superannuation funds in Australia (APRA) has a performance test for MySuper funds, to rid the super industry of under-performing super funds.
The APRA test is based on super fund returns over an eight-year period, measured against its benchmark based on the fund’s asset allocation (ie its mix of shares, bonds, property, cash, etc).
If a fund’s returns under-perform its benchmark by more than 0.5% pa, the consequences are dire. Funds that fail the test must notify their members to find better fund, and funds that fail two years in a row are banned from accepting new money. It is a savage test, but it has removed hundreds of under-performing funds, and saved hundreds of thousands of investors.
Why is this not applied to managed funds as well? It would clean out 90% of existing active funds, and end the enormous transfer of wealth from the pockets of innocent investors to the pockets of fund managers.
Finding a needle in a haystack
A tiny proportion of active funds do add value over the long term, but the chances of us finding them – IN ADVANCE – is very slim. (Hello Frank!)
In this article I look at why active fund manager performance fades over time, and how to spot it -

See also:

‘Till next time – happy investing!
Thank you for your time – please send me feedback and/or ideas for future editions!
Quick Quiz – I have never met anyone under 40 who invests in active managed funds. Have you?
Ps. If you are an active fund manager – let’s do lunch! – your shout.