Here is my essential 1-page snapshot chart for Aussie investors – covering Australian and US share markets, short- and long-term interest rates, inflation, and the AUD/USD exchange rate.
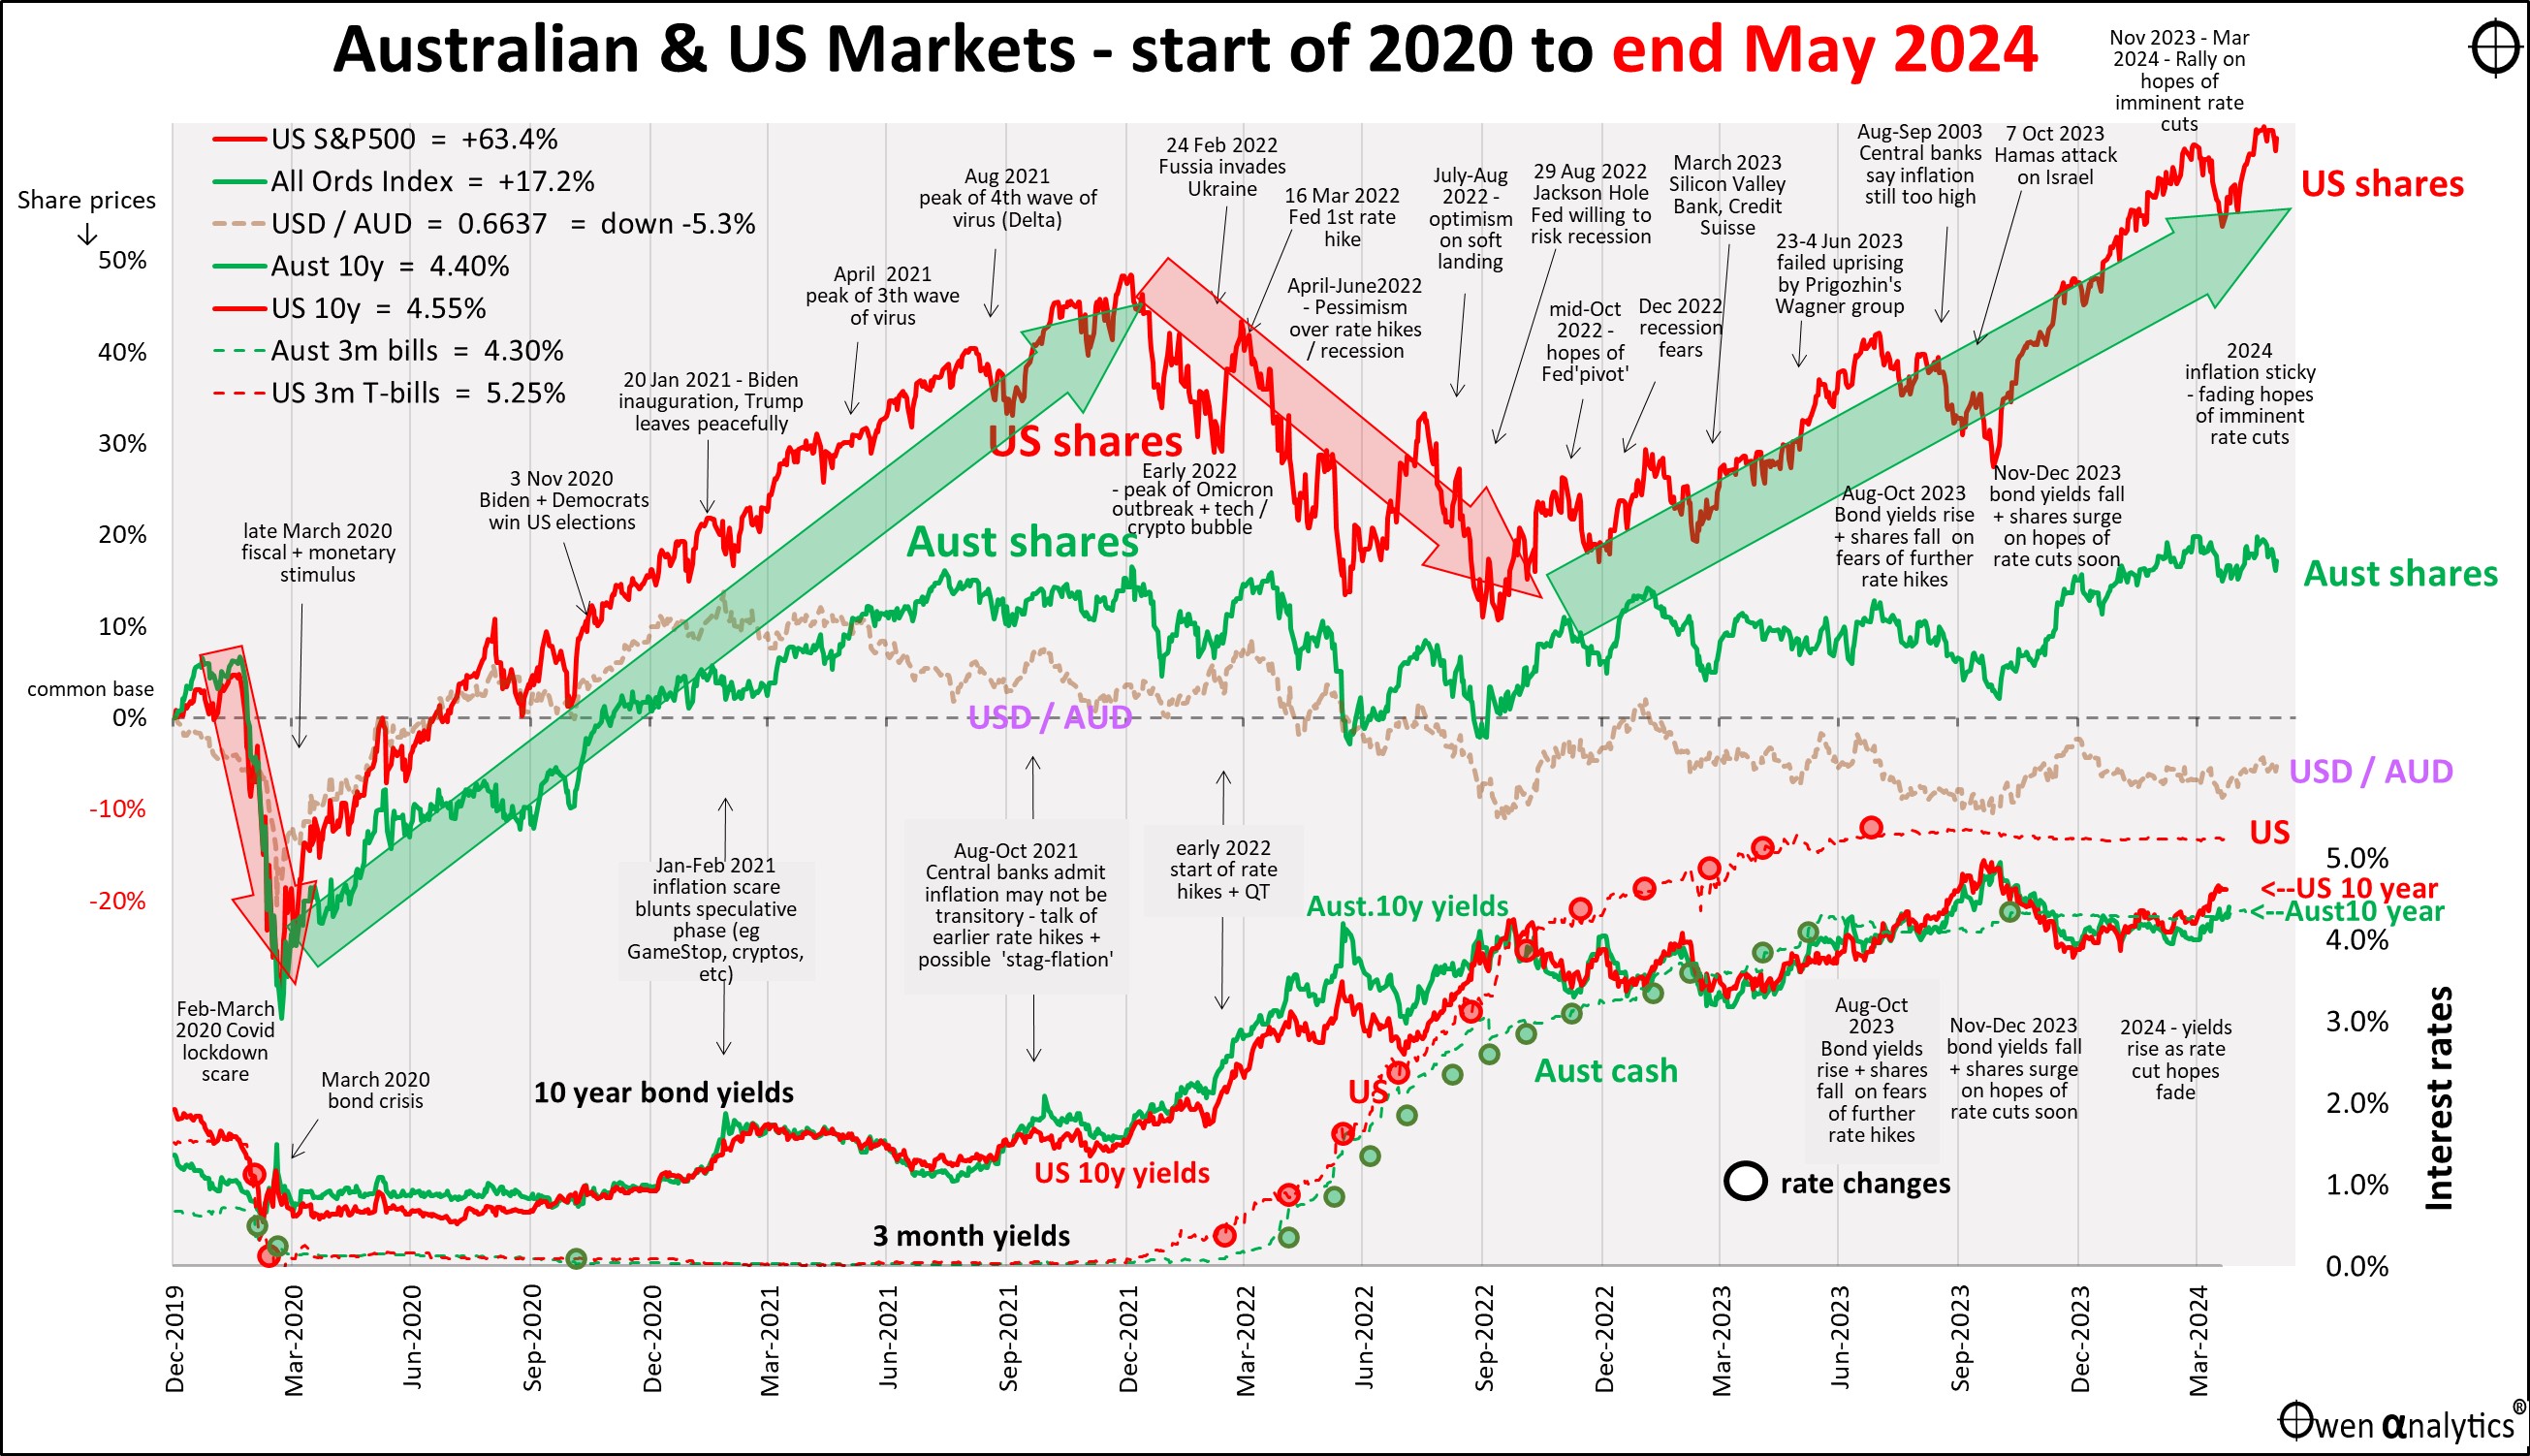
There are two versions – first is the traditional version on a single chart:
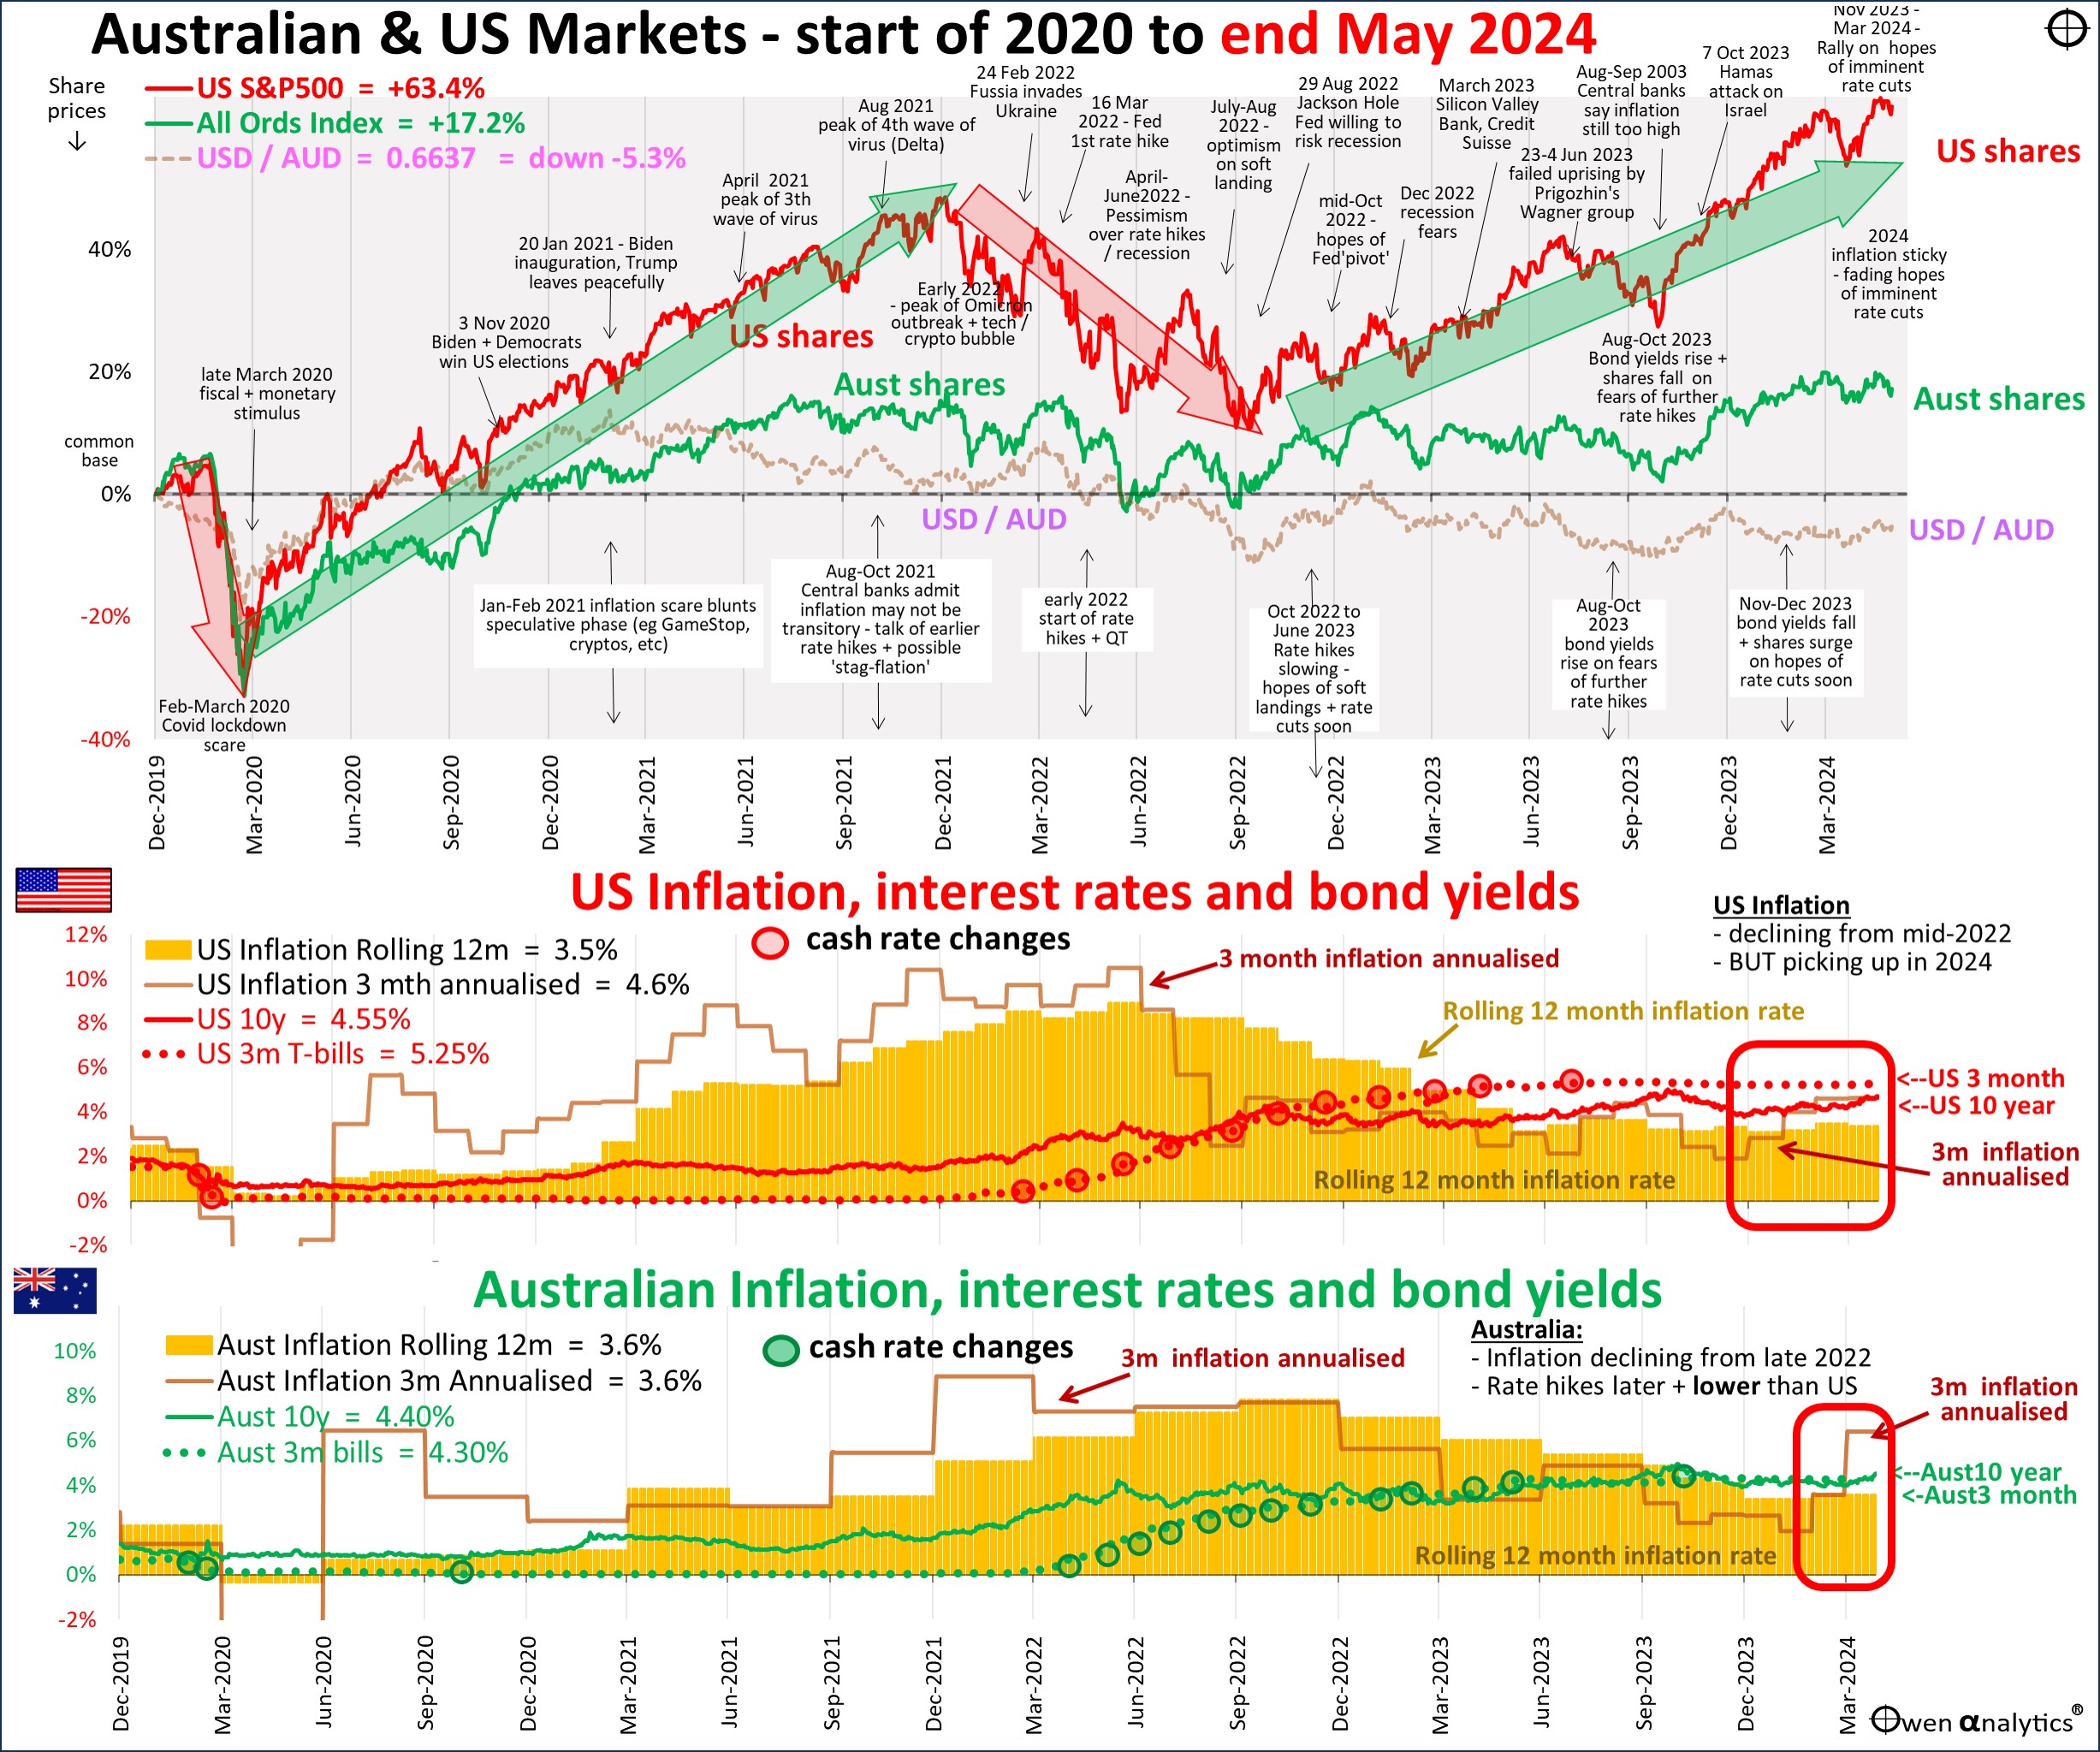
Also the alternate version below, requested by several advisers - showing inflation (rolling 12-month annual rate, and annualised rolling 3-month rate) in Australia and the US in the lower sections.
The broad green and red arrows marking the US S&P500 index in the upper section are just my simple estimation of the big swings in the US share market. It is not a prediction, just my sense of where sentiment is taking the market. This current upward trend (current green arrow) is being sustained by the end of aggressive rate hikes, declining inflation, and avoidance of sharp recessions.
Regular readers will know that I have not changed the direction or slope of the current green bull market arrow over the past year. The US market has just kept on the same broad upward trend driven by positive sentiment since late 2022.
Sometimes the market gets ahead of itself and surges ahead of the green arrow – eg in mid-2023 and again in early 2024 – but it inevitably falls back to a more sustainable trend.
Currently the US market is above trend once again, so it is vulnerable to fall back sooner or later. It is probably not going to be a big ‘crash’ just yet, just a healthy correction, unless sentiment changes dramatically.
(I tend to focus firstly on the US as it drives all global markets, including Australia, reglardlss of local pricing, and conditions).
Inflation and interest rates
During May, inflation numbers for April in the US and Australia confirmed that inflation was is falling neatly back to target.
Regular readers of this report will know that over the past two years I have said repeatedly that this market-wide assumption of imminent rate cuts was far too optimistic. Inflation was not going to fall neatly back to target, especially with wages rising everywhere, and central banks were not going to cut rates back to post-GFC and post-Covid zero or near-zero levels, even if inflation did magically return to target.
The inflation cat is out of the bag. Wage regulators and employers, pressured by the government sanctioned revival of 1970s-style industry-wide strike powers for unions, are granting double-digit wage claims without even a pretence of productivity gains, but just to cover rising ‘cost of living.’
This runs the risk of creating an upward spiral in prices and wages, especially with very tight jobs markets and expansionary fiscal policy – ie government spending rising faster than inflation.
(The Left call it a ‘price-wage’ spiral, the Right call it ‘wage-price’ spiral, to emphasise what each side believes is the primary cause). In Australia, we have Treasurer Jim Charmer back-slapping union bosses to go for 20+% wage claims with not even a hint of productivity gains, unwinding the great work done by his former mentors Hawke and Keating.
On top of this we have the steady escalation in global trade wars, with Joe Biden out-bidding Trump in raising inflationary protection barriers and industry subsidies to counter China’s heavy subsidies.
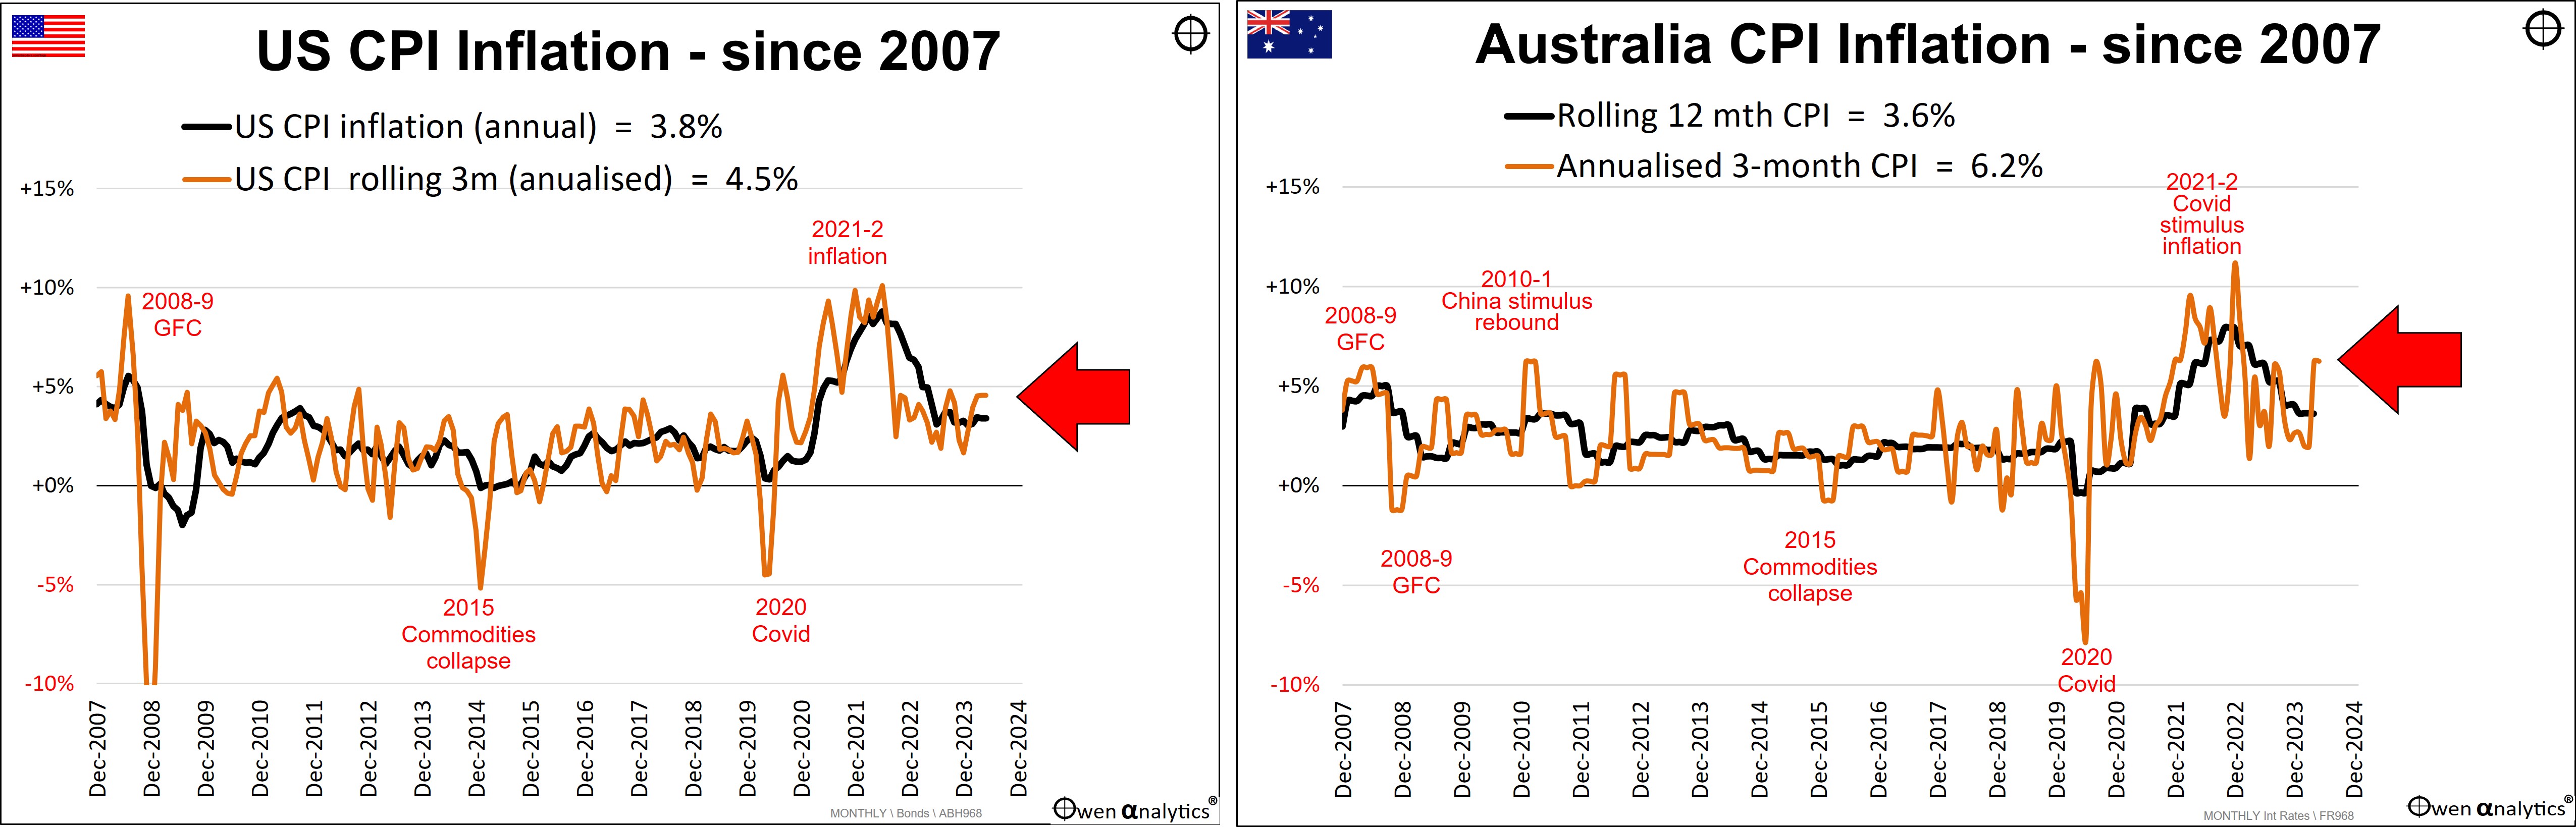
Inflation proving ‘sticky’
The next pair of charts expand the inflation story in the lower sections in the above chart. In the US, annualised 3-month CPI inflation is now back up to 4.5% pa, which is above the still rather high 3.8% rolling 12-month ‘headline’ rate. This is the wrong direction for rate cuts.
In Australia, annualised 3-month CPI inflation was leading the rolling 12-month ‘headline’ rate down over the past year, but has now spiked up to an annualised 6.2% (due mainly to rising rents, fresh food and petrol).
Goods -v- Services inflation and Wages
The problem is mainly with services inflation, being kept high by rising wages.
Here is an update on the Australian picture for Goods inflation (blue) versus Services inflation (orange). I have also added Wage inflation (black dots). The solid blue and orange lines are rolling 12-month inflation rates, and the faint dotted blue and orange lines are annualised rolling 3-month rates, which show the recent trends, but are much more volatile
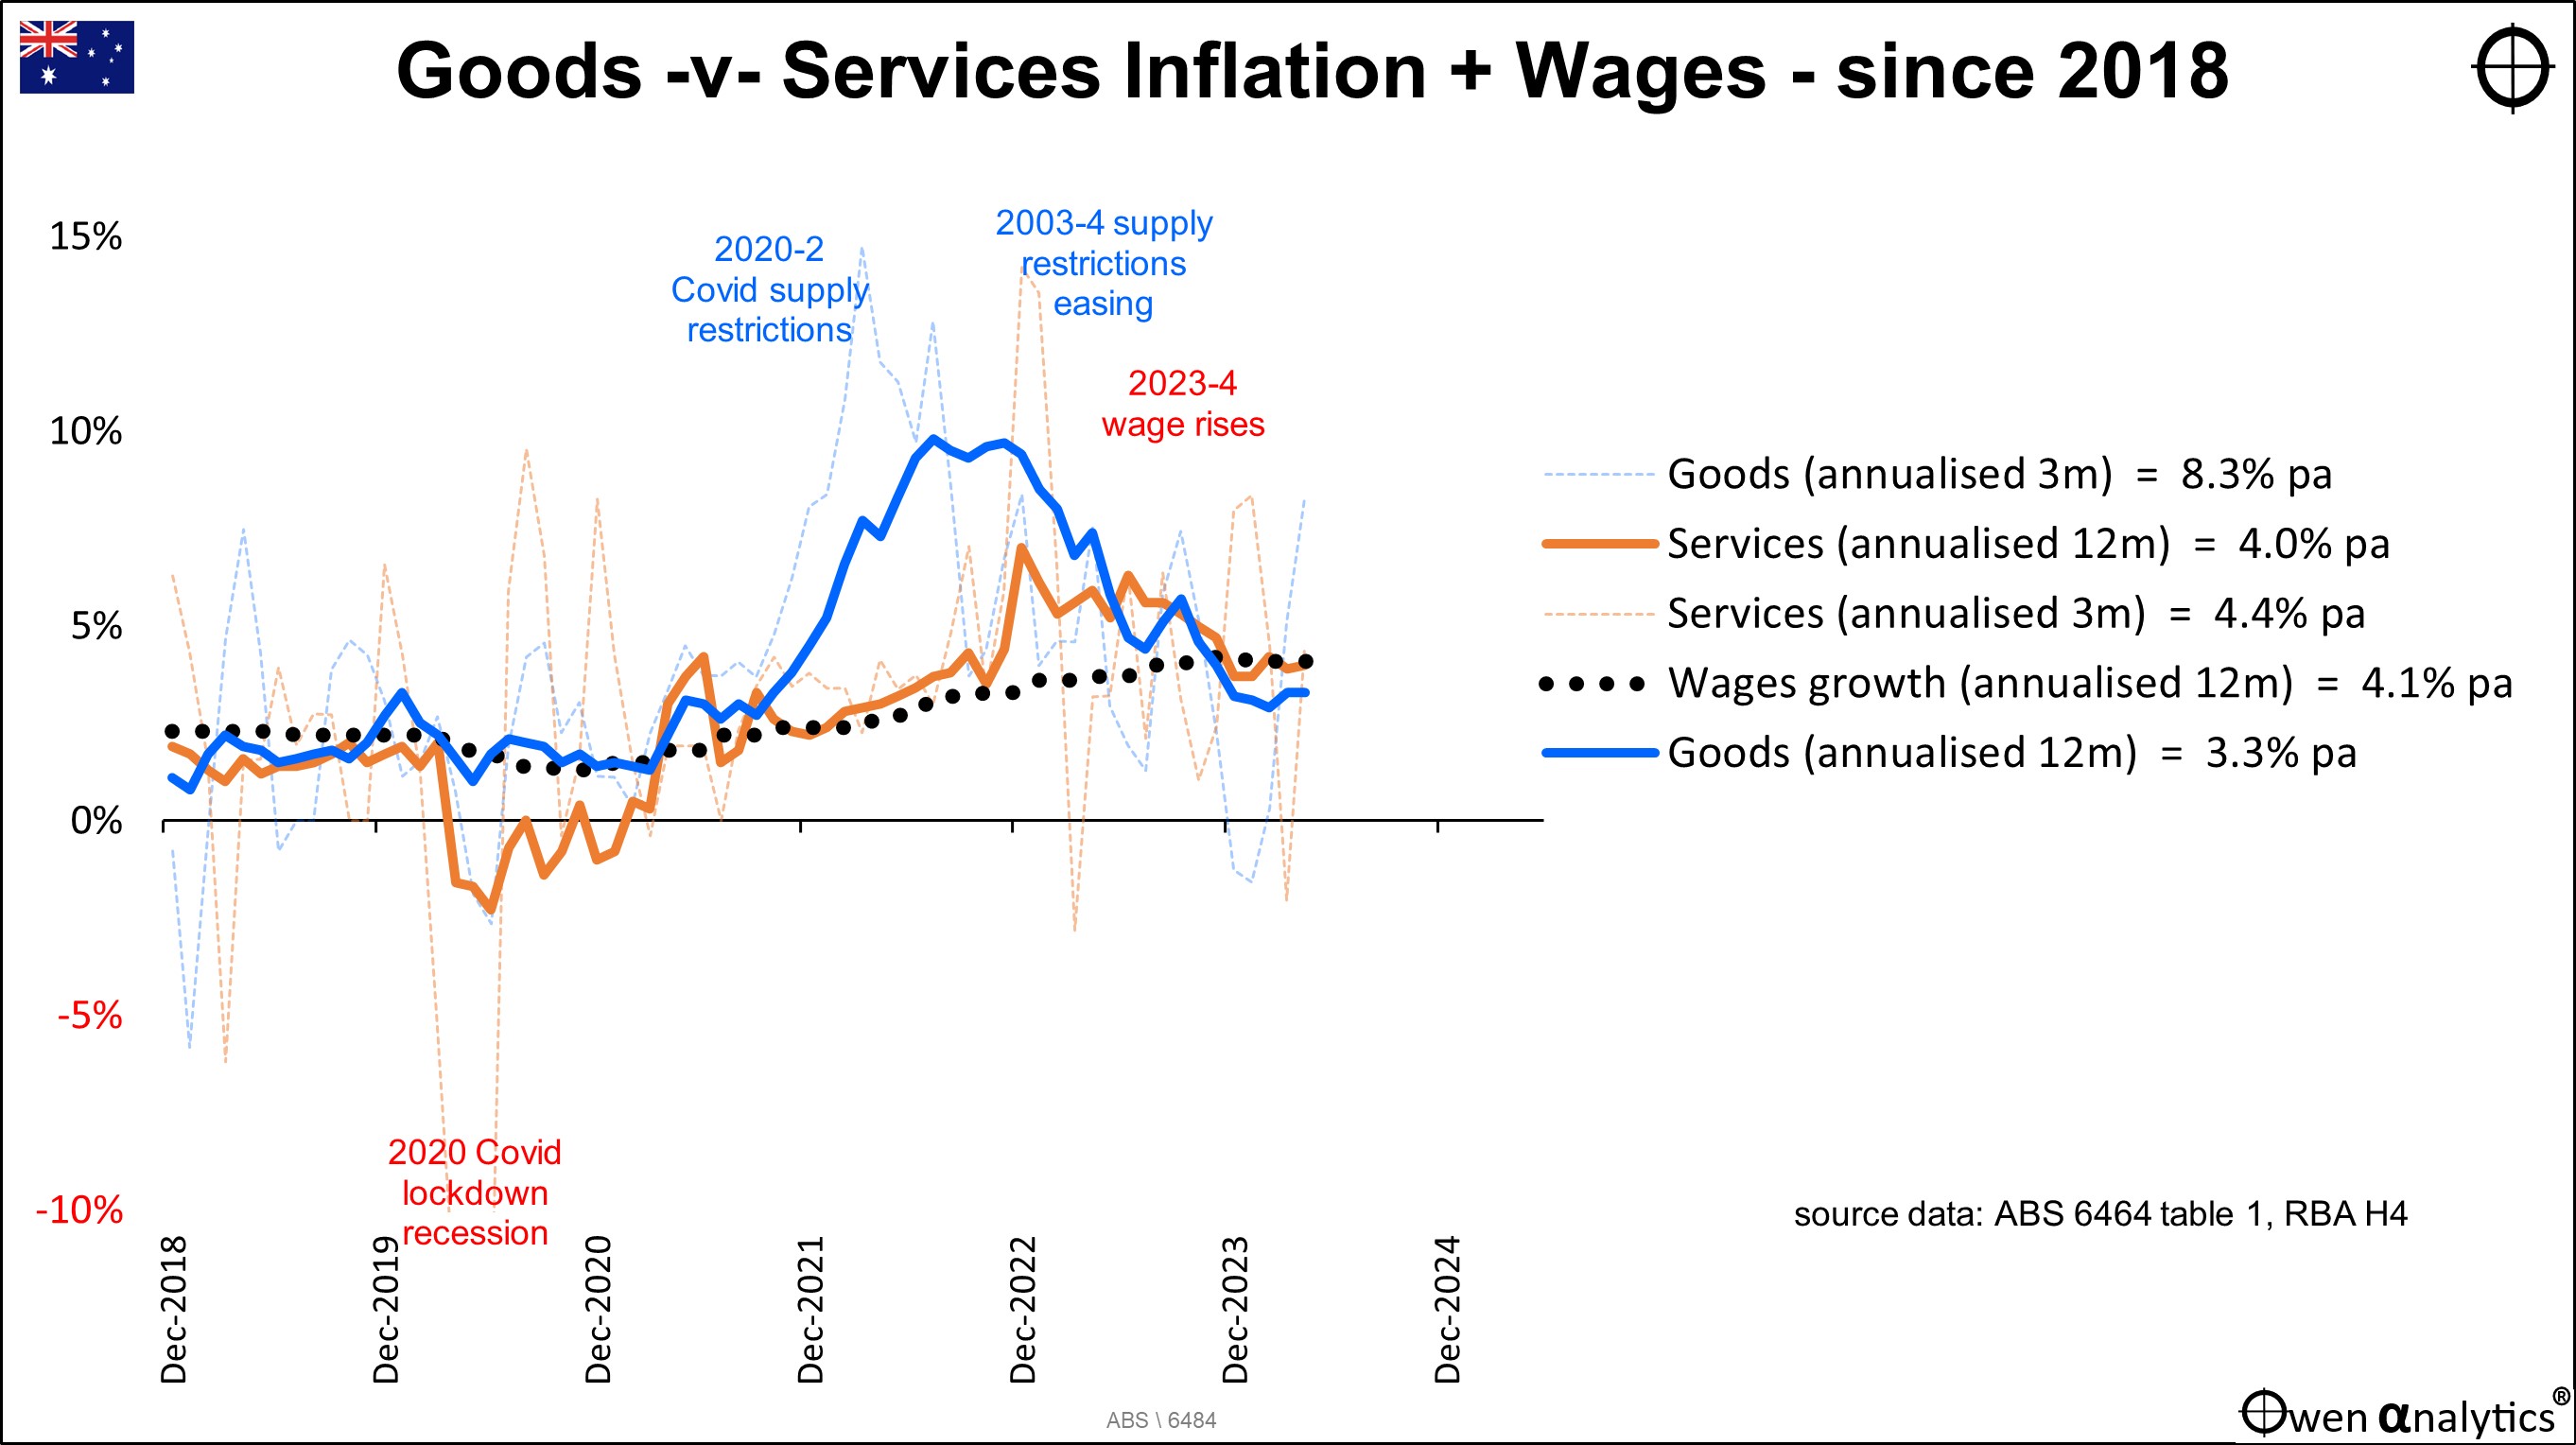
Goods inflation and services inflation in Australia were both running steady at around 2% pre-Covid. Then the Covid lockdown restrictions in 2020 hit global supply chains, sending goods inflation (blue) soaring above 10% during 2021-2. As supply chain restrictions eased over the past couple of years, goods inflation declined, but still remains at higher than target at 3.3% pa.
Services inflation (orange) was sharply negative during Covid in 2020, then recovered in 2021-2, but is now running at 4%, due largely to rising wages.
Wages inflation (black dots) was running at around 1.5% to 2.5% pa pre-Covid, but rose 3.3% in 2002, another 4.2% in 2023, and into 2024.
Services inflation is likely to remain high if jobs markets remain tight and governments and employers allow unions to win wage cases purely to chase rising living costs with no requirement for productivity gains.
On the other hand, there is more scope for goods inflation to fall back further toward target levels, despite governments’ best efforts to increase prices by trying to revive inefficient, non-competitive local manufacturing, propped up by tax-payer subsidies and protected by trade restrictions.
Fears of rising wages, zero productivity growth, rising protectionism, ballooning government spending, the expensive and probably inflation transition to renewables, and signs of slowing US economic growth, are starting to re-ignite fears of the dreaded ‘stagflation’ – higher than target inflation plus slow growth.
What is missing thus far, thankfully, is unemployment, but that has now ticked up by 0.5% in the US.
Meanwhile, in the background are ongoing threats of rising military tensions in Europe, the Middle East, and East Asia.
For the impacts of inflation on investment market returns see:
The Low Inflation era of great returns is over. Investing just got a whole lot harder! (16 Apr 2024)

Global shares – recovered April’s decline
In May, global share markets brushed off fears of entrenched inflation and further delays for rate cuts, and recovered April’s declines. All global industry sectors were up (just) for the fourth time in the past seven months, illustrating the broad nature of the rally. Most of the major global stocks were ahead in May (left chart below) – led by Nvidia, Netflix, Apple, Microsoft, Meta/Facebook, Alphabet/Google. Banks were also stronger (recessions avoided).
On the negative side, most discretionary stocks were weaker, with interest rates hurting consumer spending, but staples were stronger. At a country level, the main winner in May was the US, led by its tech giants. Most other country share markets were also up a fraction for the month (including Australia – see below).
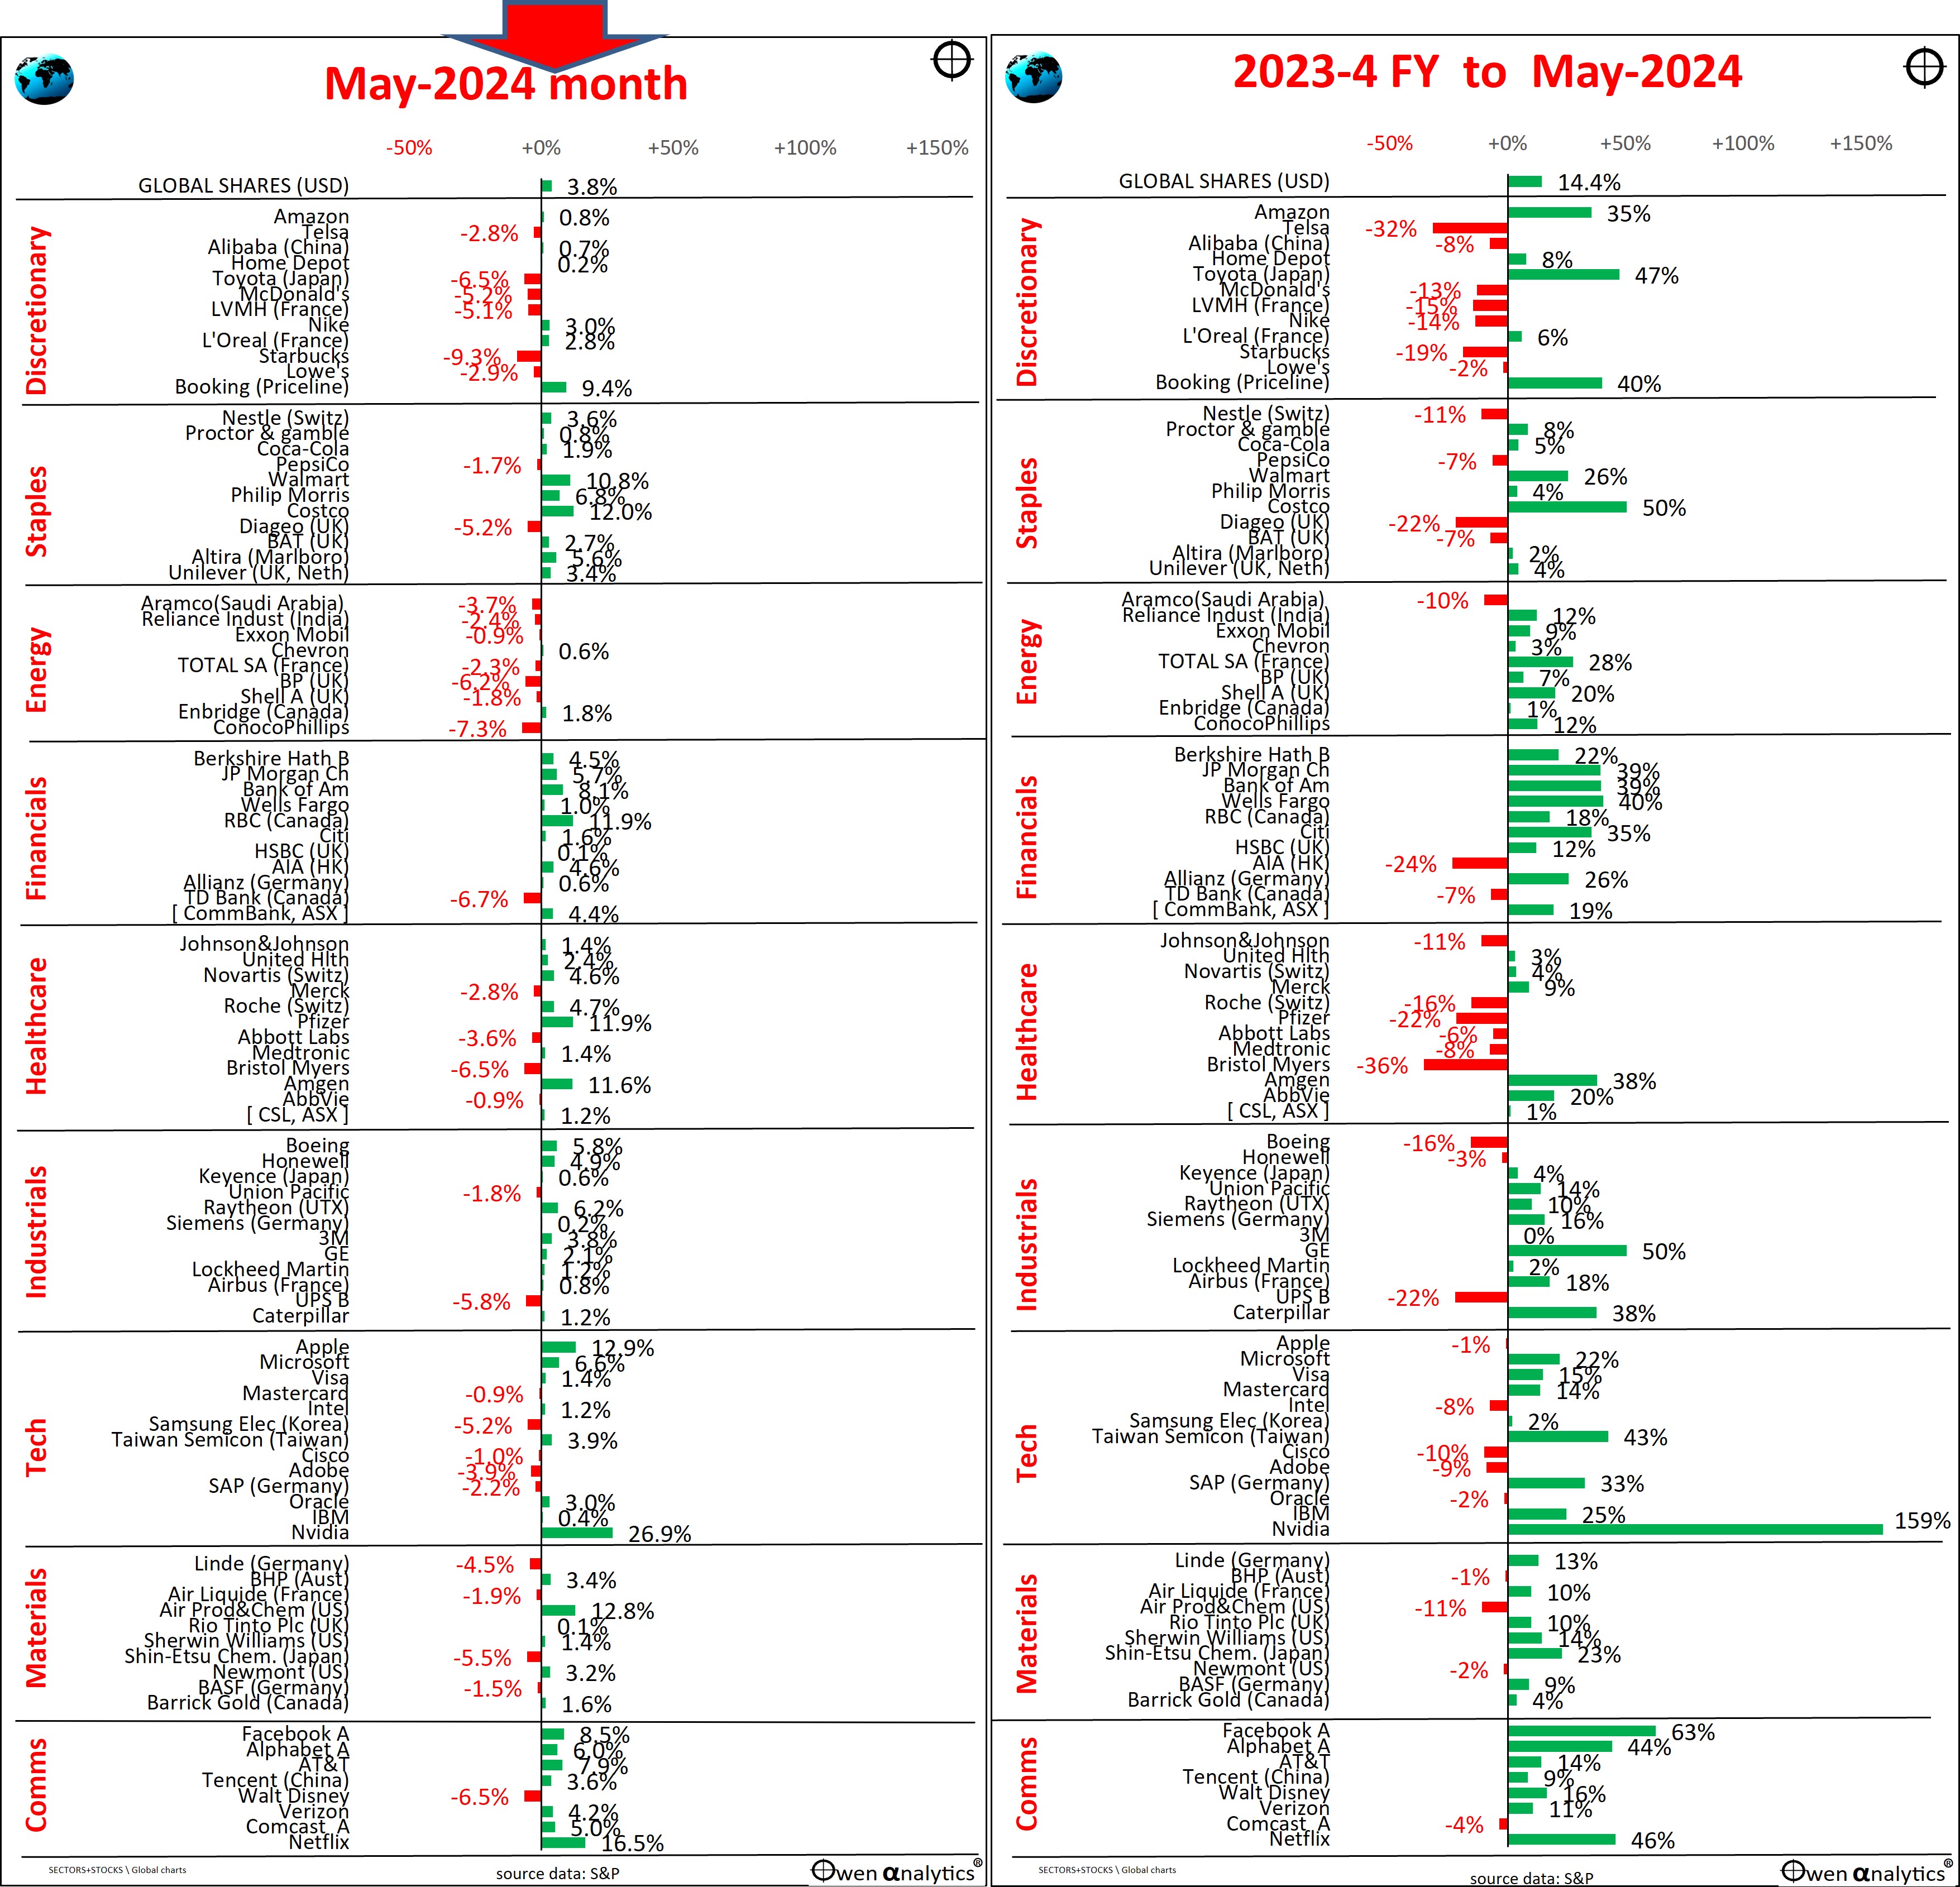
The right shows share price moves for our financial year to date (from start of July 2023). With only one month to go, the overall global share market is heading for another strong year – up around +14% in aggregate (repeating the +13% gain in 2022-3 FY), and once again significantly higher than the local Australian share market (next section).
The stand-out winners have been A.i. chip maker Nvidia and Meta/Facebook. How are your shares doing for the year? (My rather boring global share portfolio is up 18% with a month to go).
(The AUD has been flat against the USD for this financial year, so there has been no FX gain or loss to local shareholders, unlike last year when a weakening AUD delivered a +4% FX gain to Aussie shareholders in US companies).
I have written extensively that US share market is severely over-priced on a number of different measures - see for example:
US shares vastly over-priced and primed to fall – but what will be the trigger? (US ‘CAPE’ ratio update) (22 April 2024)

But that does not mean they are about to collapse immediately. Share markets can run into very expensive territory for many years before they crash - for example the US market during the whole of the 1990s, before the almighty 2001-2 'tech wreck'.
There will be a major collapse in time (there always is), but not until we have a major trigger.
Australian shares – up a fraction overall in May
The local share market was up a fraction in May, the sixth positive month in the past seven months. The left chart below shows that most of the major local stocks were actually down for the month, but the overall market aggregates were lifted by CBA (gaining for no apparent or logical reason), BHP (iron ore price up a fraction), Goodman, and Wisetech.
The right chart shows share price moves for the financial year to date. With only one month to go, the market is heading for a decent (around historical average) gain for the financial year, lower than the +10% gain last financial year (2022-3), and well below the overall global share market.
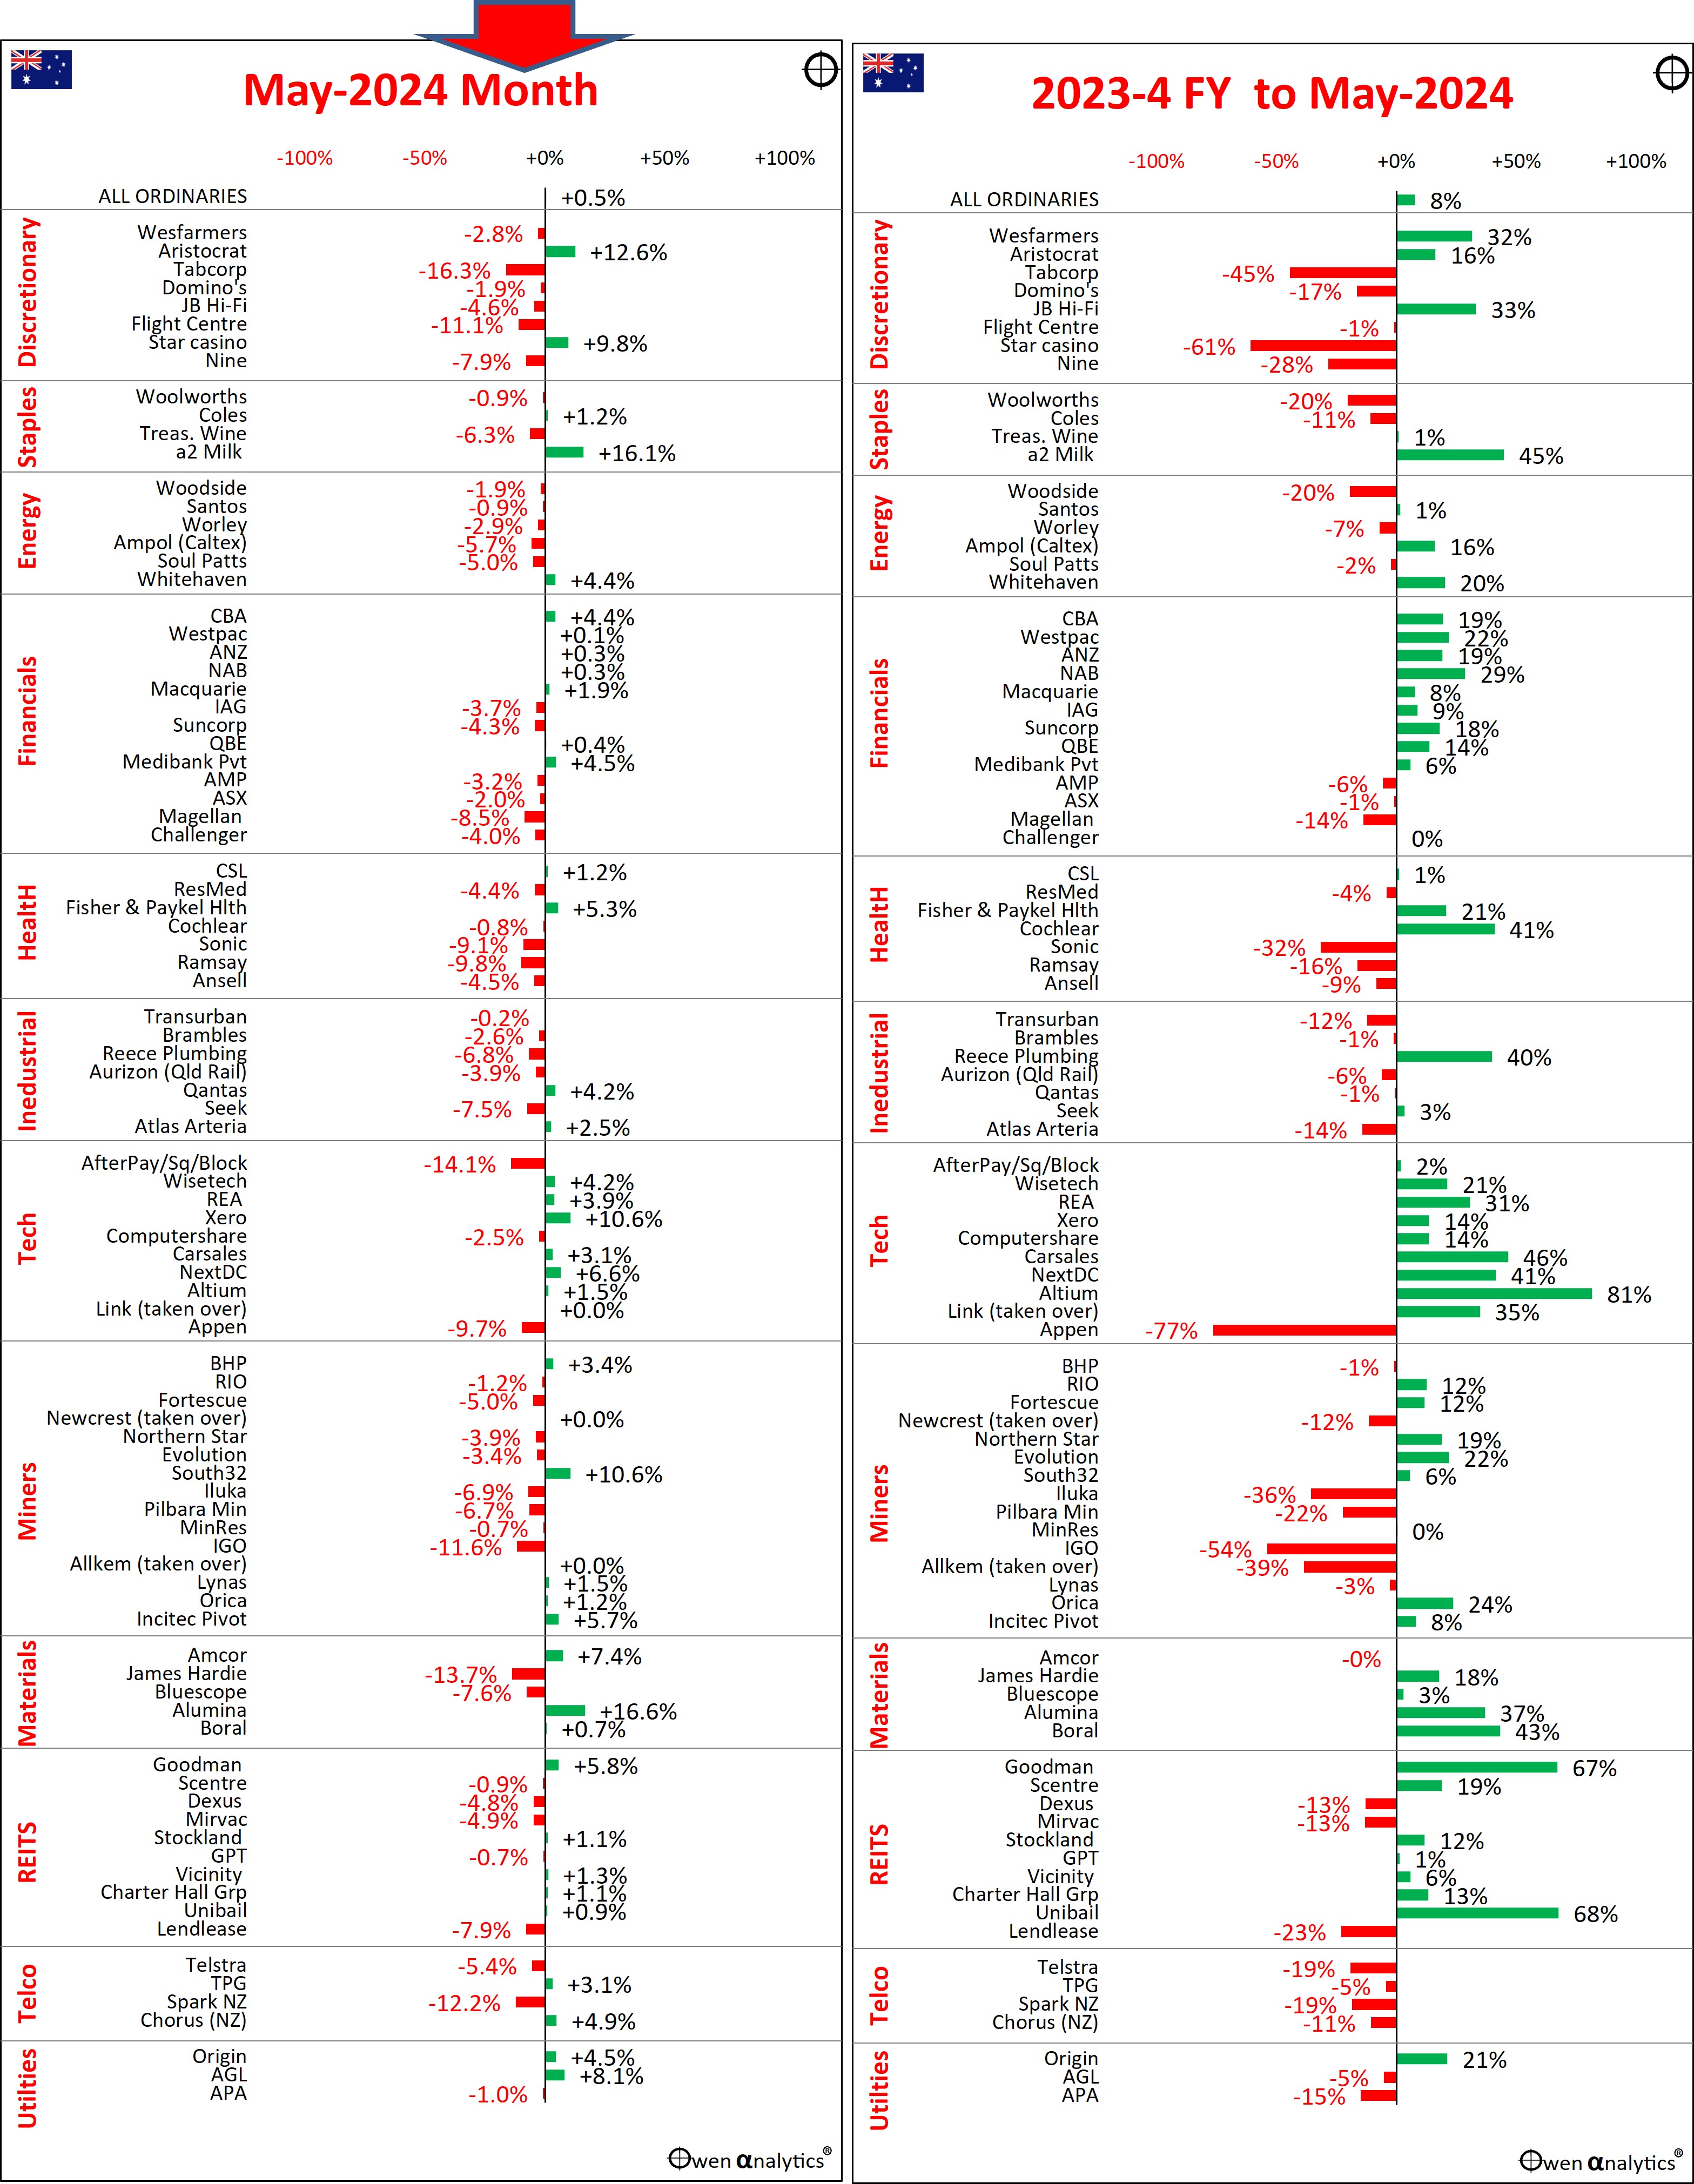
For the 2023-4 year, the winners have been the big-4 banks (recession avoided), tech stocks (aside from Block/Square/Afterpay, and Appen), and building materials stocks James Hardie, Boral, Alumina (bid by Alcoa).
Other stars for the year have been Goodman (logistics centres supporting online retailers), Wesfarmers (Bunnings, Kmart, Officeworks, lithium processing), JB Hi-Fi (smartest gadget retailer), a2Milk (China reopening), Cochlear (hearing implants), Altium (printed circuit board design software).
RIO and FMG were up on higher iron ore prices (but BHP was flat as it tries to figure out what business it is in), and gold miners rose on higher gold prices (we lost Newcrest to Newmont US during the year). The big losers for the year have been battery metal stocks, Telstra, and Appen (was an A.i. star until it wasn’t).
How are your Aussie shares doing for the year? (Mine are up by more than 20%, due to heavy historical holdings of bank shares).
Commodities – mostly a little higher in May
Iron ore was up 1% in May after encouraging signs of Chinese stimulus, but still down -15% so far in 2024. Coal was also up 1%, and flat for the year. Gas prices soared +30% in May, but also still flat for the year. Copper and nickel spiked in mid-May in a short squeeze, but fell back to be a fraction higher for the month. Lithium down 4% in May, but still ahead +9% in 2024. Oil down another 5% in May, but still ahead +7% in 2024.
Of special interest to Australia - iron ore, coal, oil, natural gas, nickel, and lithium – are all still well below their peak levels of a couple of years ago – due to weak global demand (weak EV sales, China’s property/construction/finance collapse, and a general global slowdown), and increases in supply. Only copper is creeping back toward peak levels.
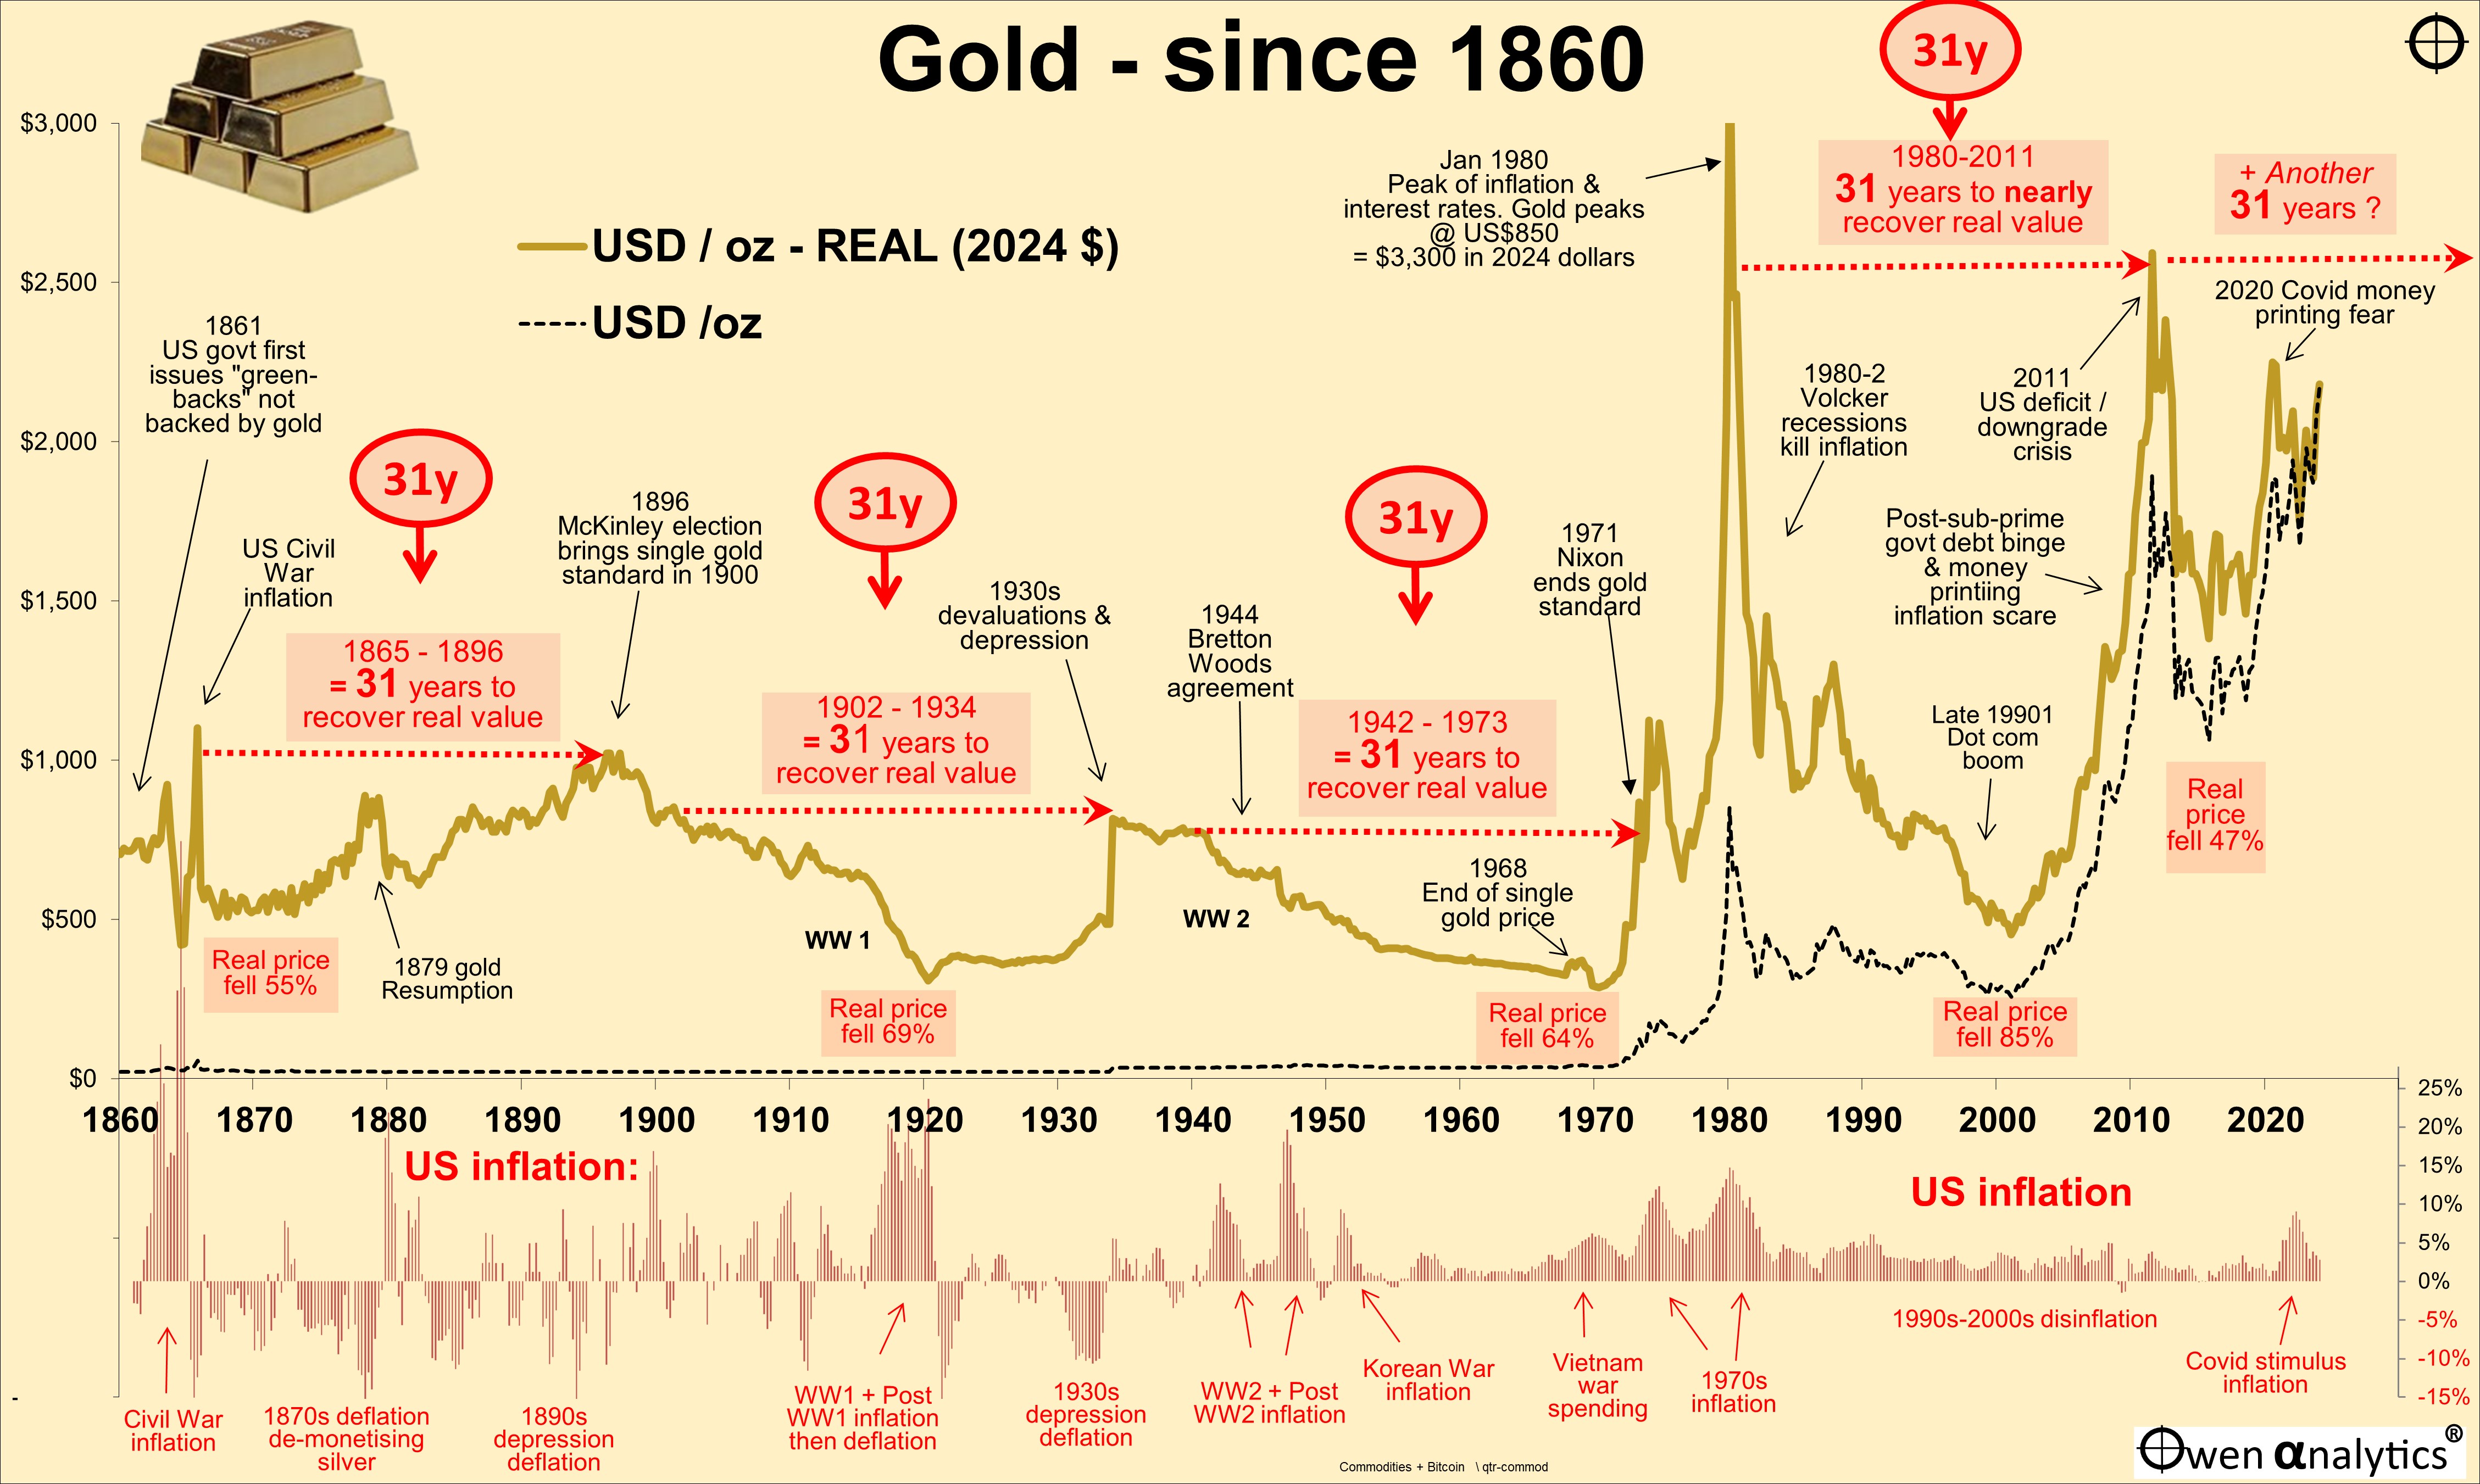
Gold was up another +2% in US dollars in May, and ahead +14% this year. Buying has been strong this year, mainly from Chinese nationals (diversifying away from the ailing property market), and central banks (mainly non-NATO governments diversifying away from the US dollar assets, to avoid a repeat of the US seizing Russia’s dollar assets after it invaded Ukraine). Also lifting general interest in gold are rising global tensions, and inflation remaining stubbornly above target.
See also: Gold: Curious case of the '31-year itch'? (15 Mar 2024)
Bonds
10-year treasury yields were more or less flat around the world in May – higher in Japan and Europe, lower in the US (with unemployment edging up) and Canada, and flat in Australia and the UK.
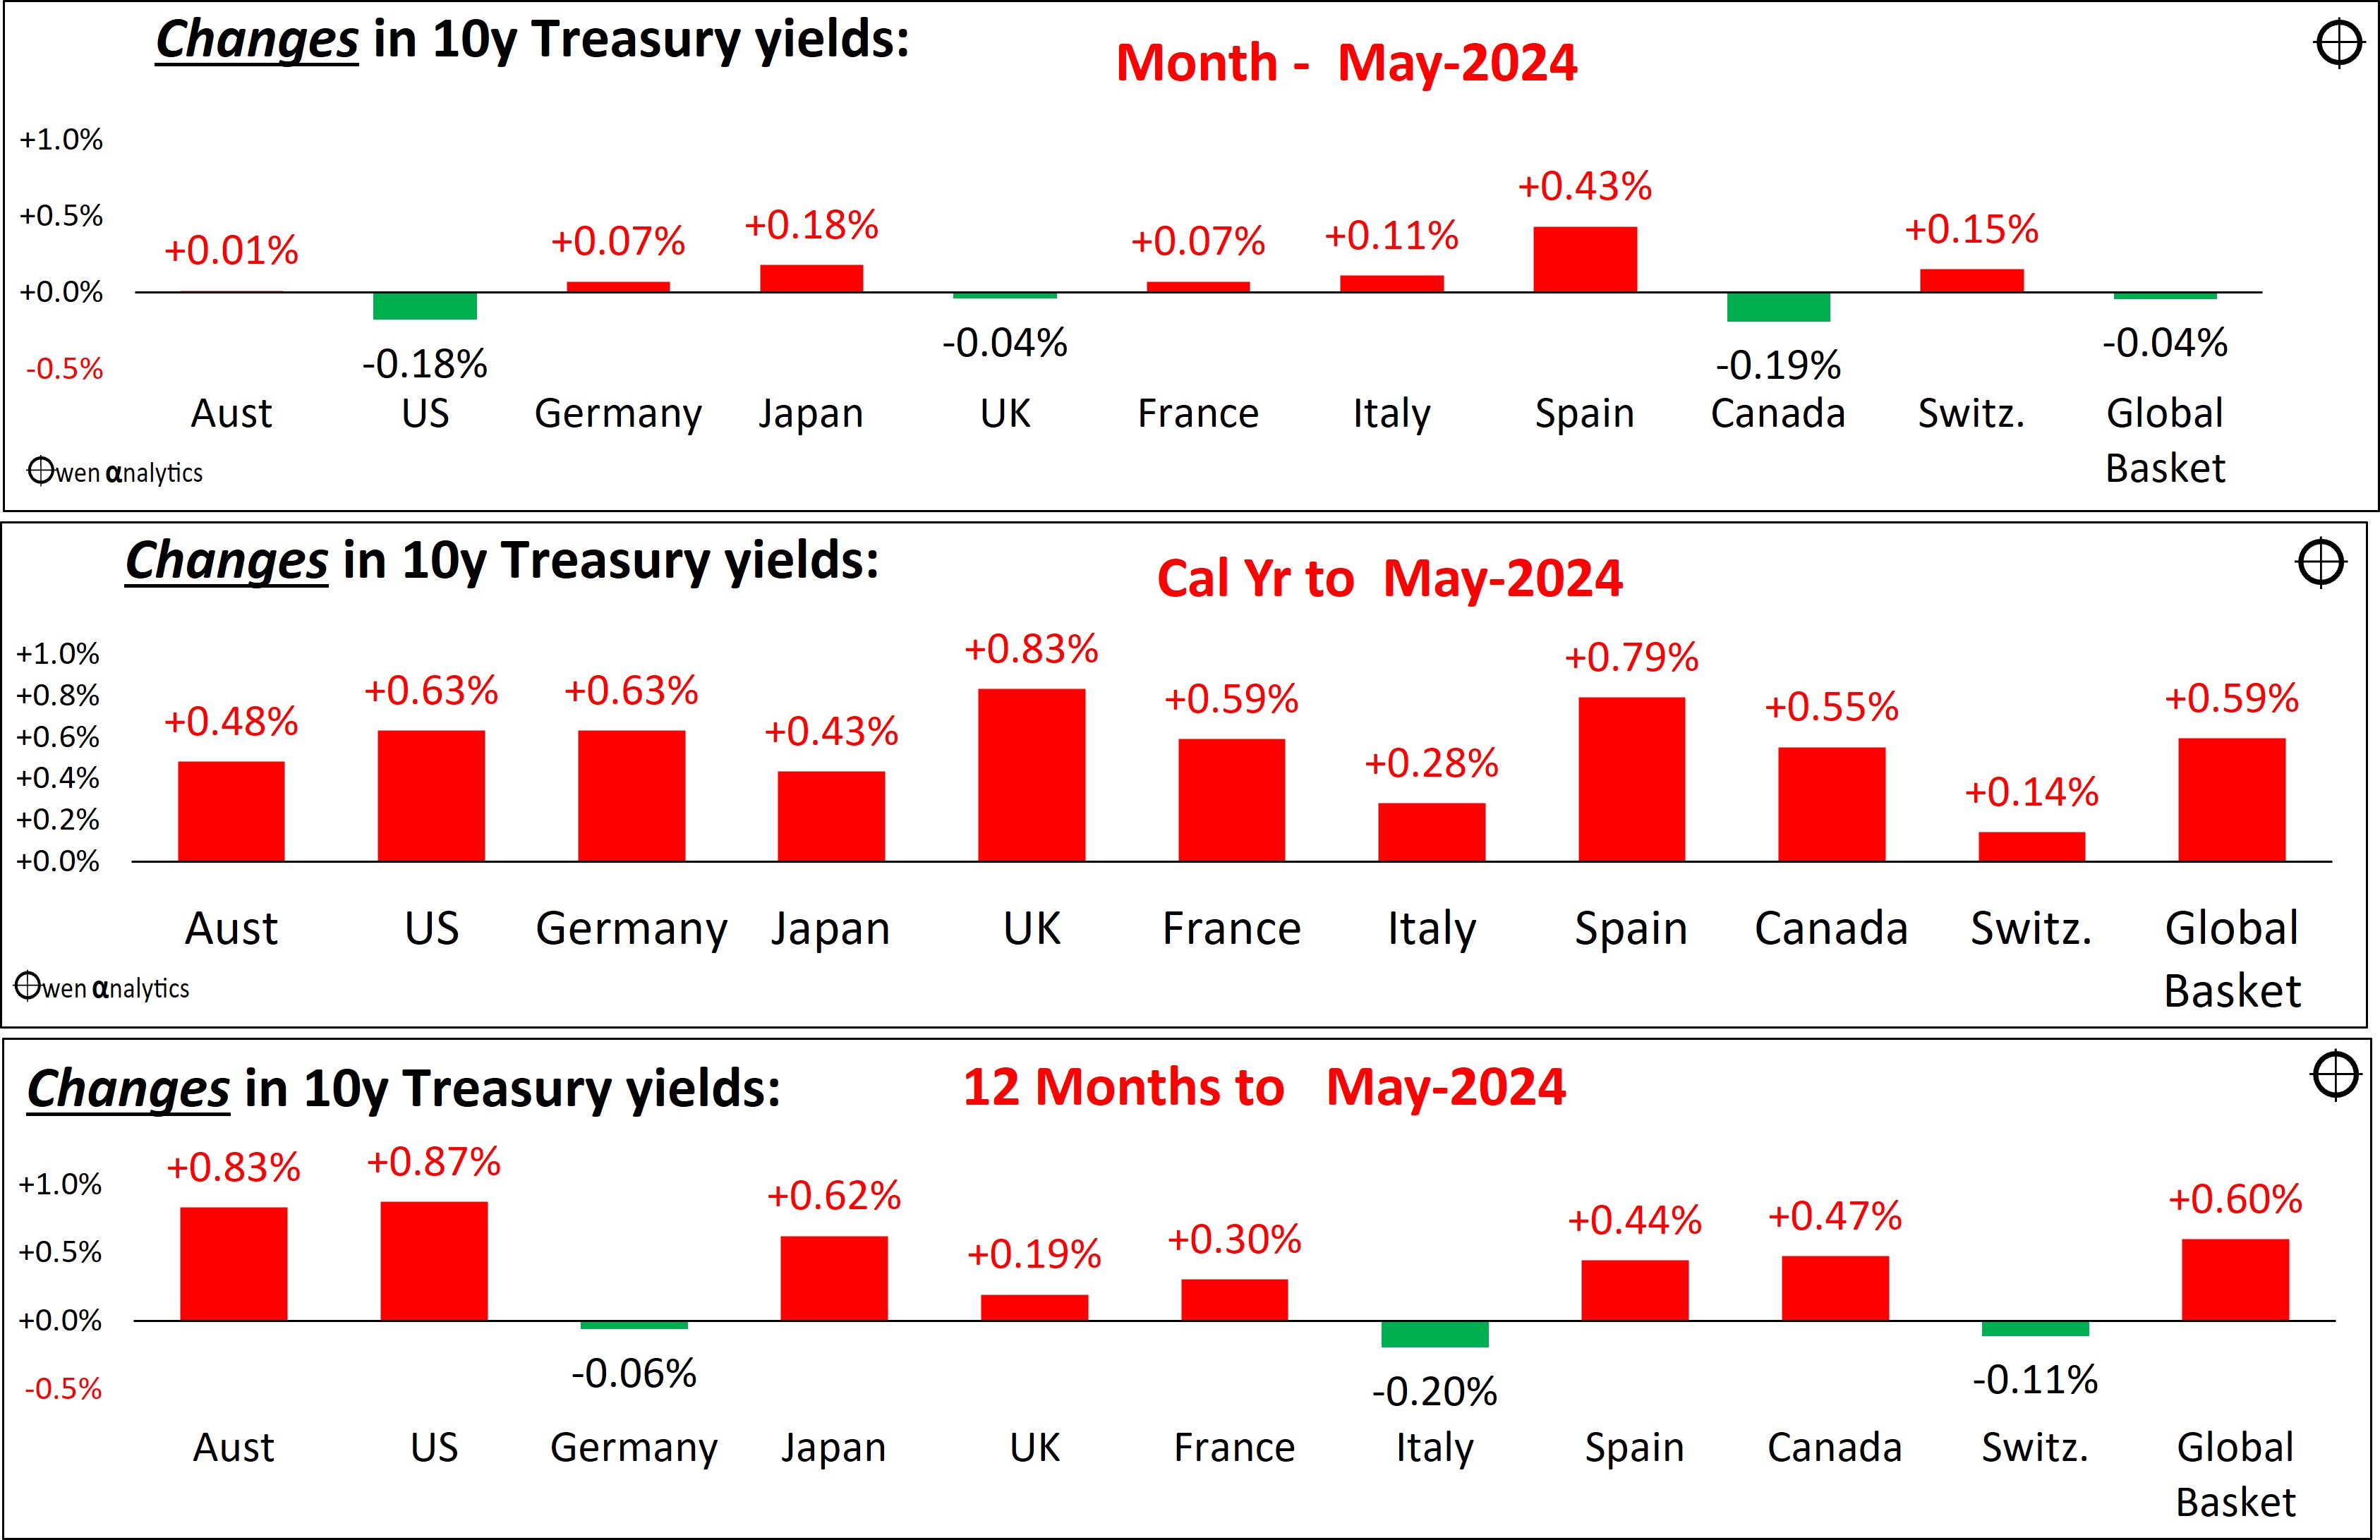
In the bottom chart, the red bars (increases in yields are red because they mean capital losses for bond holders) are pointing to the 2023-4 financial year probably turning out to the fourth year in a row of very poor/negative returns for hardy bond-holders. I have never understood why, but many investors clung onto (or jumped into) their so-called ‘safe’ government bonds in the hope of inflation magically returning to target, and/or a sharp global recession.
Neither of these occurred, as this report has been warning readers away from fixed rate bonds for the past three years. I have advocated defensive allocations in portfolios be primarily in high grade floating rate corporate bonds, which have beaten fixed rate bonds by big margins over the past four years.
However, government bonds do have a narrow and specific role in diversified portfolios as a very short-term defensive play leading into economic recessions and slowdowns, but NOT where inflation is high. The problem is that you need to get the timing right for both the entry and the exit, especially getting out of bonds in the middle of recessions before inflation rebound expectations return, which is usually very sudden.
Government bonds provide great positive returns early in recessions when inflation and inflation expectations collapse, but those gains are quickly given back as inflation expectations and bond yields rise from the middle of recessions. Timing is critical. If you get caught holding bonds in the middle of recessions, not only do you give back the gains you made on bonds in the first half of the recession, but you miss out on the share rebound, which generally starts in the middle of recessions.
Credit spreads on corporate bonds – flat and still very tight
Credit spreads remained almost flat in May. In all major regions and market segments (including Australia), credit spreads remain at very tight (thin) levels, providing bond holders with virtually no buffer for even the slightest hint of recession. (In recessions, spreads blow out, neutralising the positive effect of the collapse in treasury yields, so corporate bonds do not provide the same positive/defensive buffer in recessions as treasuries.)
The 2023-4 financial year will probably see returns from bond markets barely above zero.
Looking ahead
We have made it through this report without mentioning Trump! What happens on the Trump front is bound to dominate headlines everywhere – probably even over-shadowing inflation numbers and Fed pronouncements.
Putting politics aside, investors should remind themselves that Trump’s first term was tremendous for share markets in the US and around the world. We are in a different world now of course. Only time will tell what Trump might do if he gets in again, and also if he doesn’t.
I went to school in America (briefly, LA and Washington) in the 1970s, which was a very troubled time for America. The coming years will also be troubled, regardless of who wins in November. Stay tuned.
‘Till next time – happy investing!
Thank you for your time – please send me feedback and/or ideas for future editions!