We gotta talk about the ‘D’ word. Our ‘Demise’. (Ok, let’s face it – ‘Death’).
Where are you and your family on the Survival Probability Curve?
What are the prospects of you living to 100 or beyond?
How will you finance it?
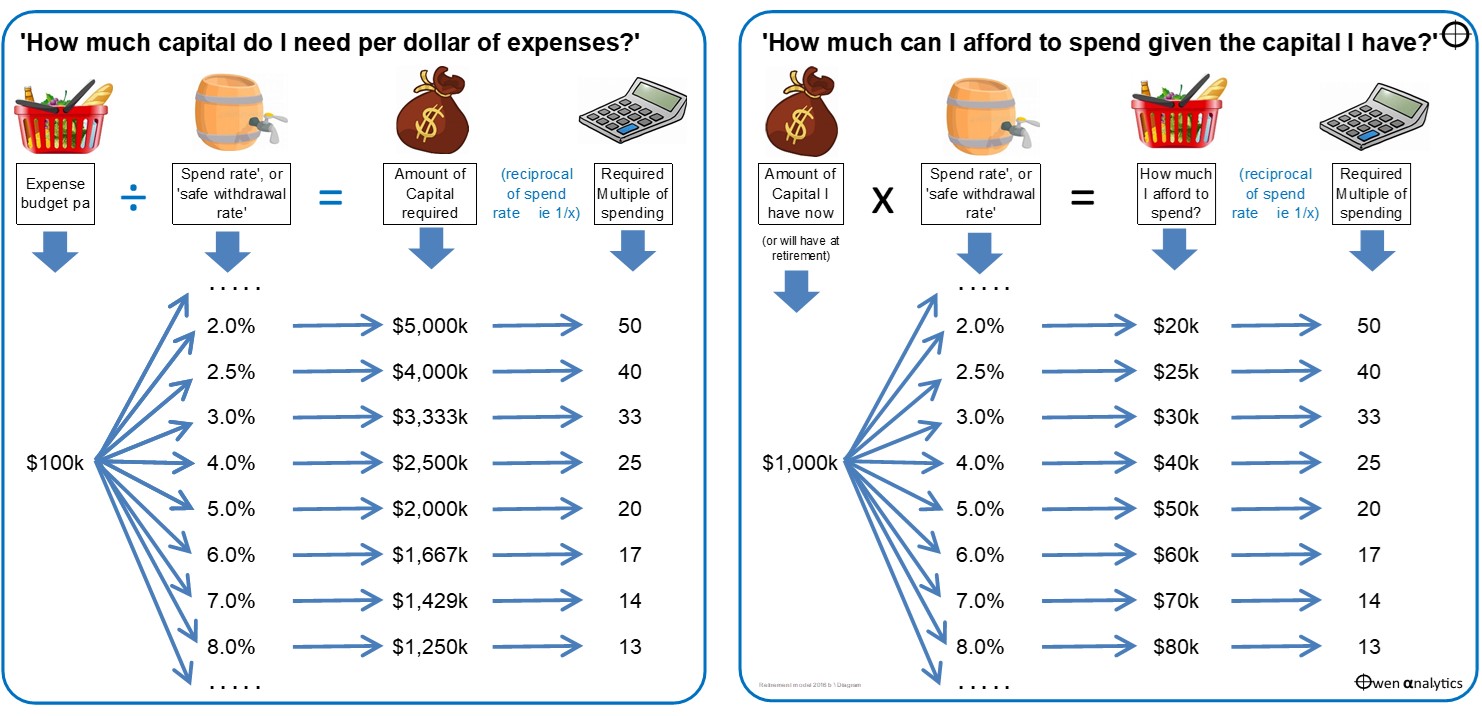
Today’s story looks at the first two of 17 key factors that determine the answers to the two big questions when planning retirement finances: ‘How much do I need?’, and ‘How much can I afford to spend?’ - in order to have confidence that you can maintain your living standards, not run out of money, and not have to rely on welfare.
The 17 factors are explained here:
'What's your Number? Part 2: 17 key factors’ driving ‘How much do I need’ & ‘How much can I spend?'
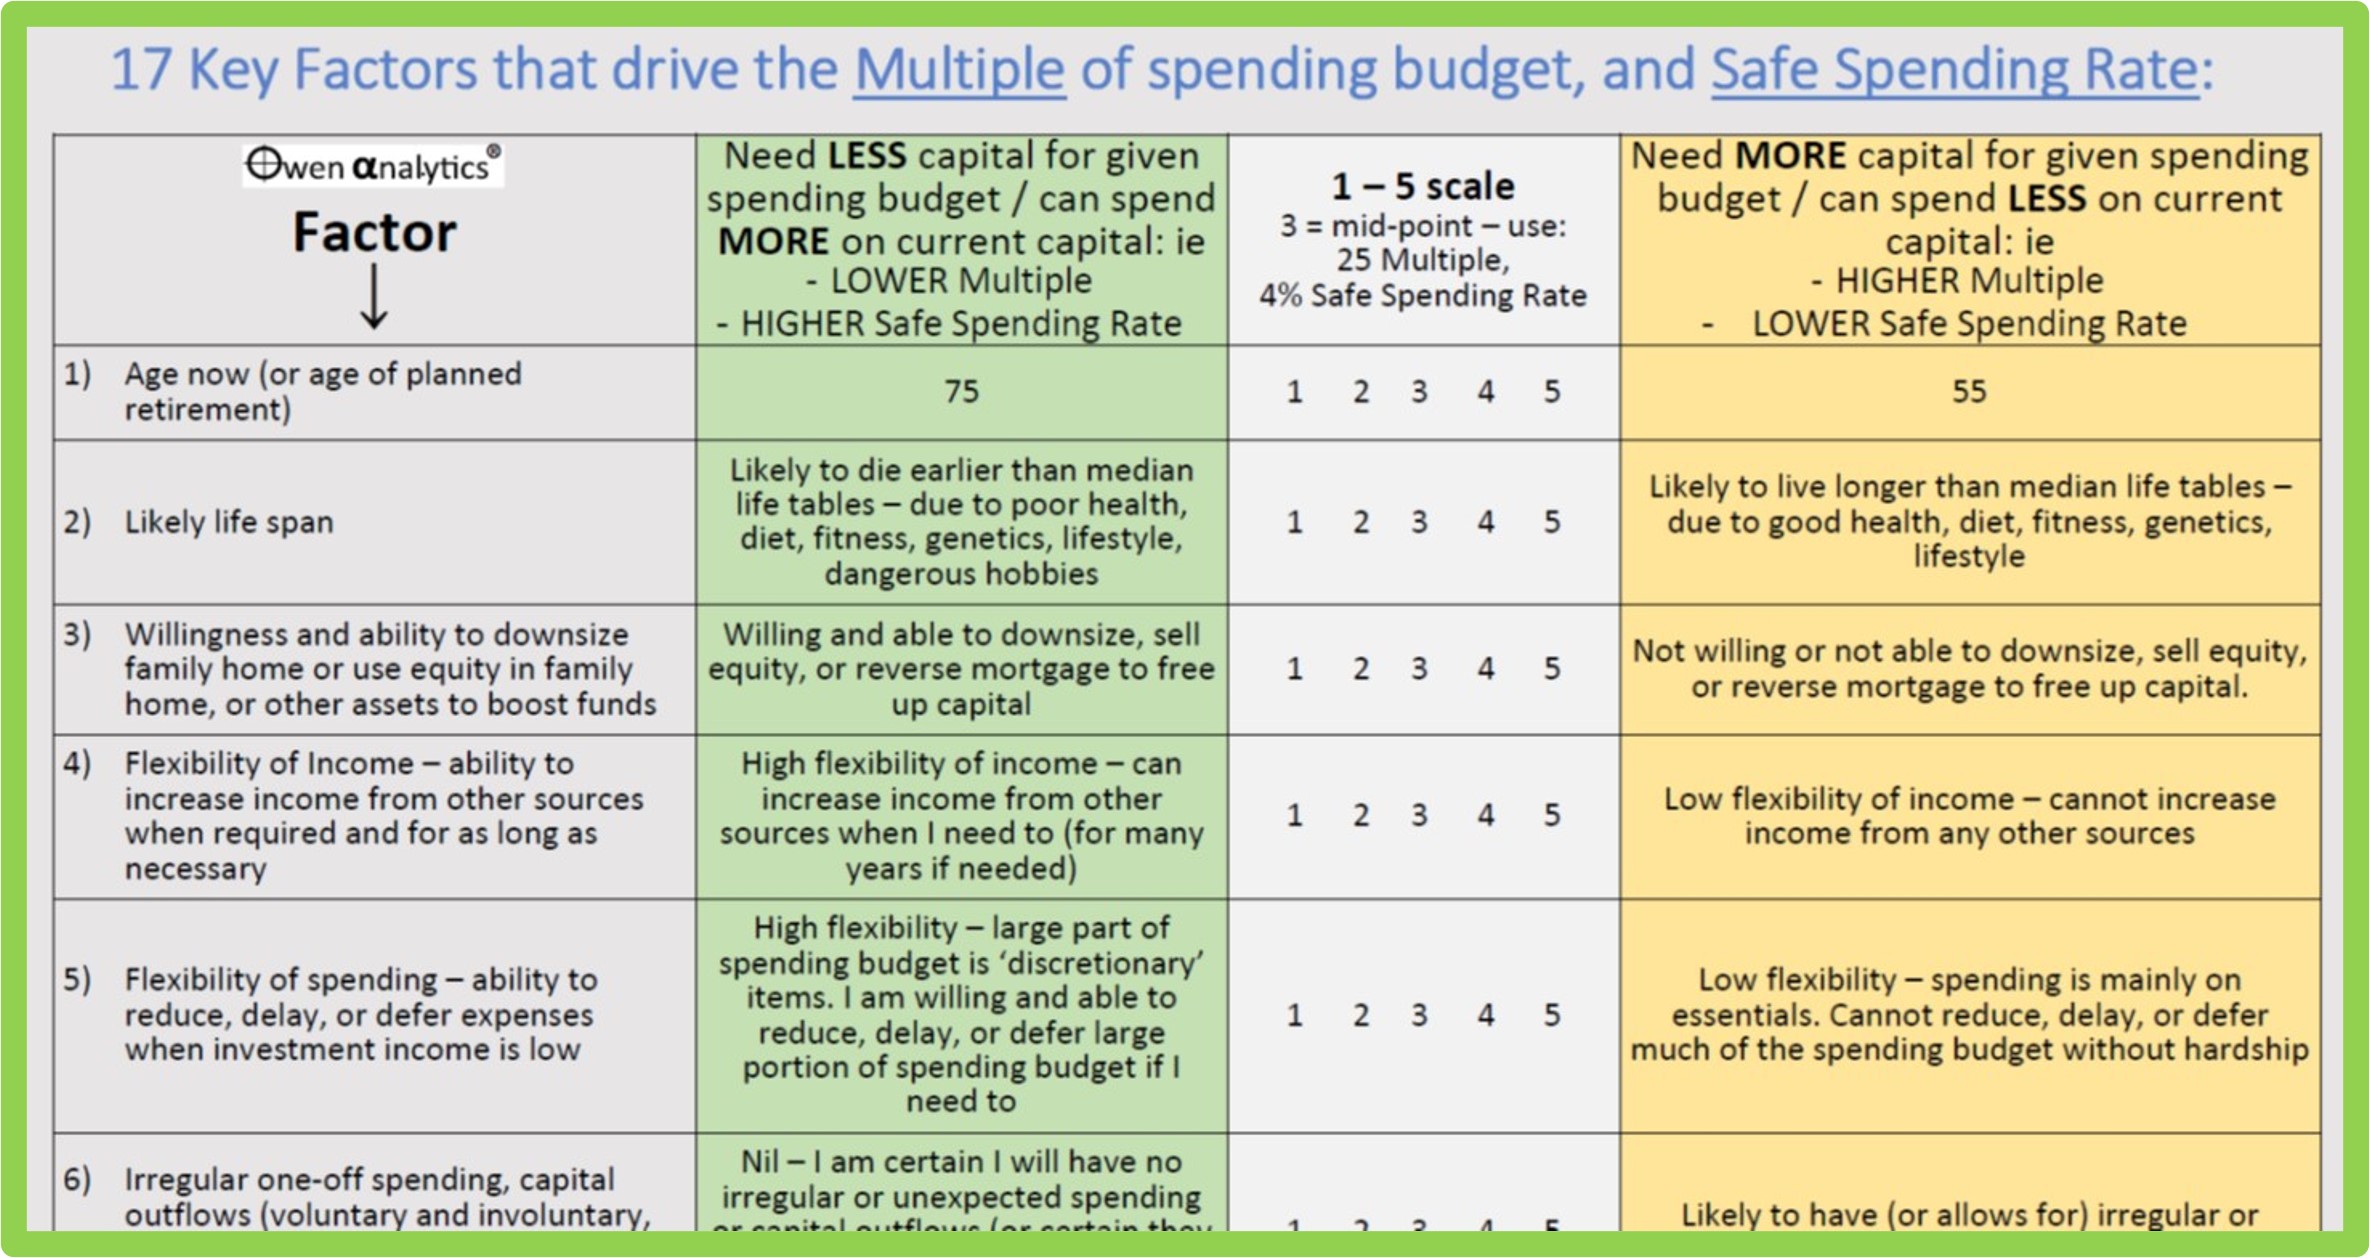
The first two factors covered today are: your current age, and your likely life span. In particular, we highlight the four big problems when relying on ‘life expectancy’ tables that are used throughout the financial advice and retirement industry.
The bottom line: be prepared for the real possibility of living a lot longer than you might have thought!
‘Median life expectancy’ tables
Most retirement planning calculators provided by government services, super funds, banks, and product issuers, are based on the assumption that you will run down your capital during your lifetime. (They also assume you will be relying on government welfare, as do two thirds of all retirees in Australia, when you run out of money).
The Australian Bureau of Statistics (ABS) publishes Australian life expectancy tables regularly. Here are the most recent life expectancy numbers for Australians (ABS report):
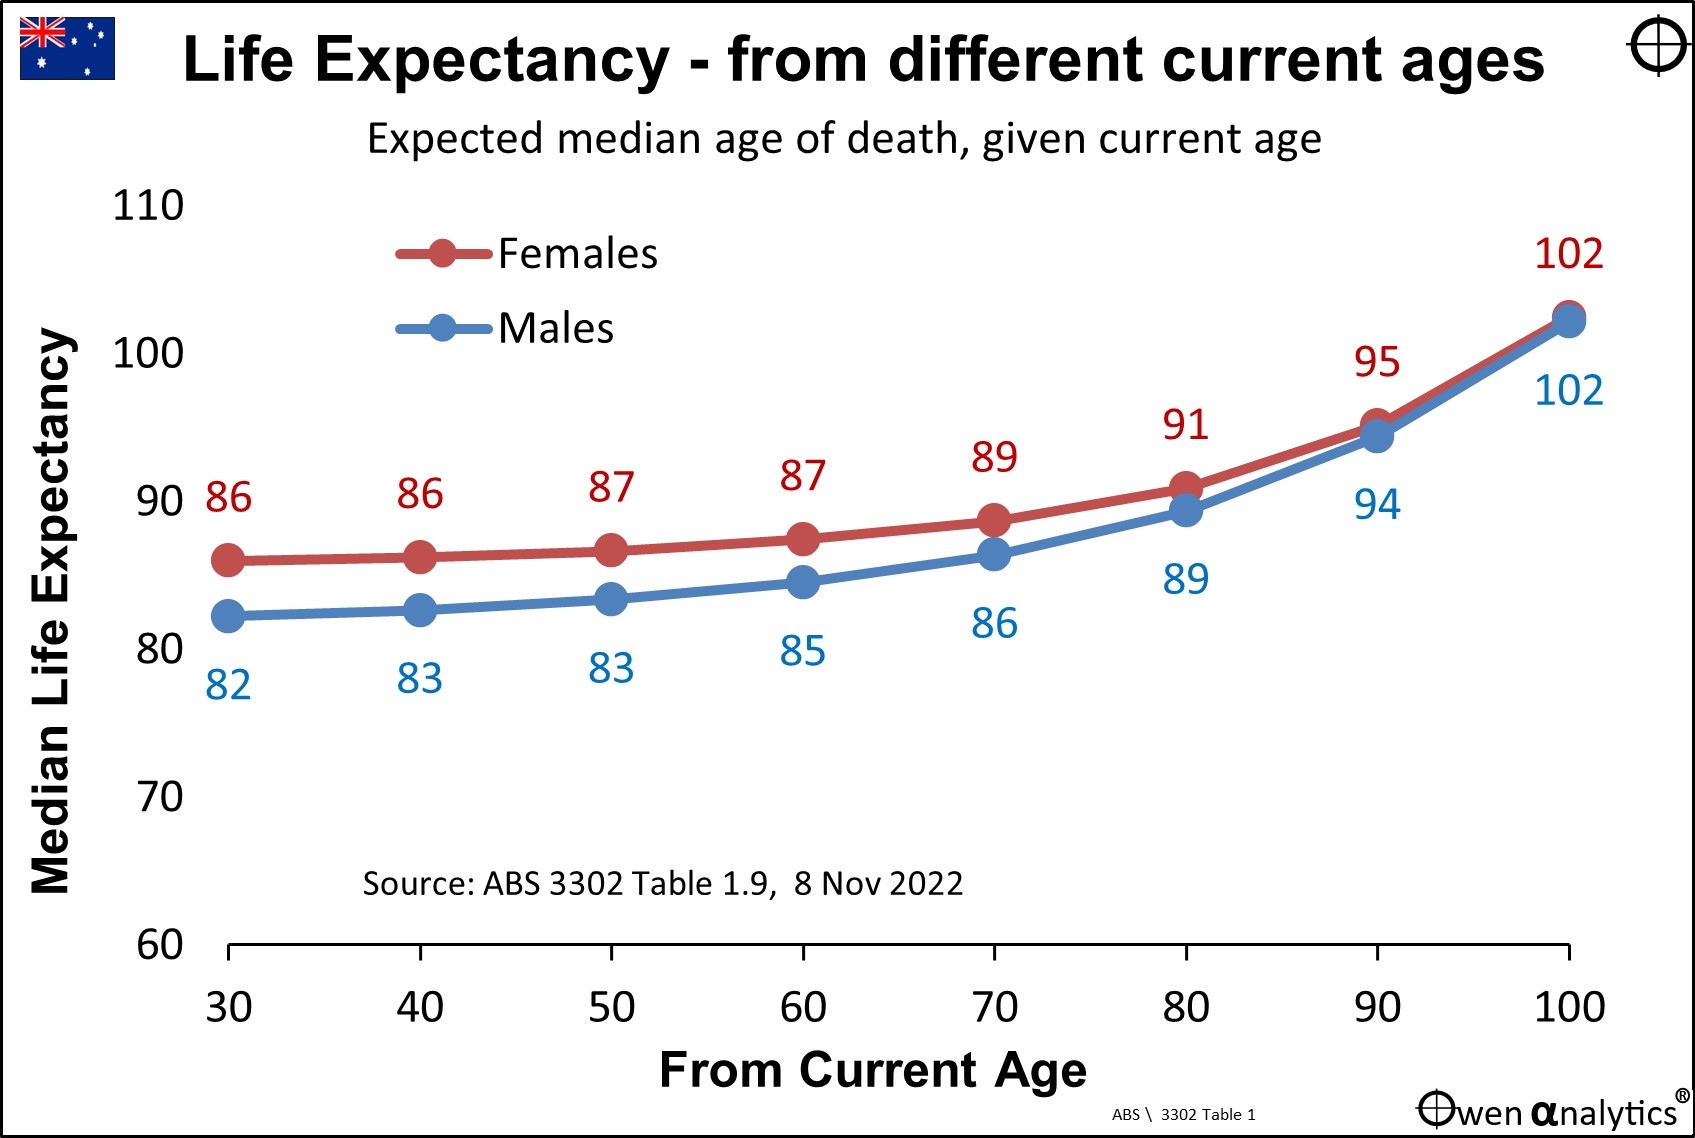
From this we can see, for example, that for people who are now 60, the life expectancy for males is 85 (ie 25 years of life left), and 87 for females (27 years left). This sounds depressing - I certainly hope to live a lot longer than that if I can!
There are at four big problems with relying on median life expectancy tables like these to estimate how much capital you will need in retirement, and how much you can afford to spend.
Problem 1 – there is at least a 50% chance you will live longer than the ‘median’
Statistical life tables show ‘median’ life expectancy. Every 60-year-old alive today will not suddenly die when they are 85 for males, or 87 for females. Some will die tomorrow (unfortunately), and some will live well past 100.
The term ‘median’ means ‘middle’. That means that half of all today’s 60-year-olds are projected to die before the median life expectancy, and half will live longer than the median life expectancy.
If you use the median life expectancy as the forecast term of your retirement fund, there is a 50% chance you will fall short, because there is a 50% chance you will live longer than the median life expectancy for your age group.
A 50% probably of failure of your retirement investment plan is far too high for comfort. It would be much safer and more comforting to plan for your funds to last say 15 or so years longer than the median life expectancy tables indicate. We all know, or know of, people who lived past 90 or 100. What if that is us? We can’t suddenly decide to ‘work longer, or ‘go back to work’ or ‘save more’!
Problem 2 – The older you get, the longer you are likely to live
Take another look at the first chart. We can see that the median life expectancy for 60-year-old females today is 87. But the median life expectancy for 70-year-old females today is 89, the median life expectancy for 80-year-old females today is 91, and the median life expectancy for 90-year-old females today is 95, and so on.
The longer you live, the longer you are likely to live. And these are just the medians. Half are expected to live longer than the medians. We take this further below.
Real possibility you or your partner might live to 100 or more
Whenever I talk to investors about financing their retirement, I always insist on both partners being present at every meeting (even if one of them has taken responsibility for ‘looking after the money’). I always say to them:
“One of you might live to 100, and [as I look to the male] it’s probably not going to be you!”
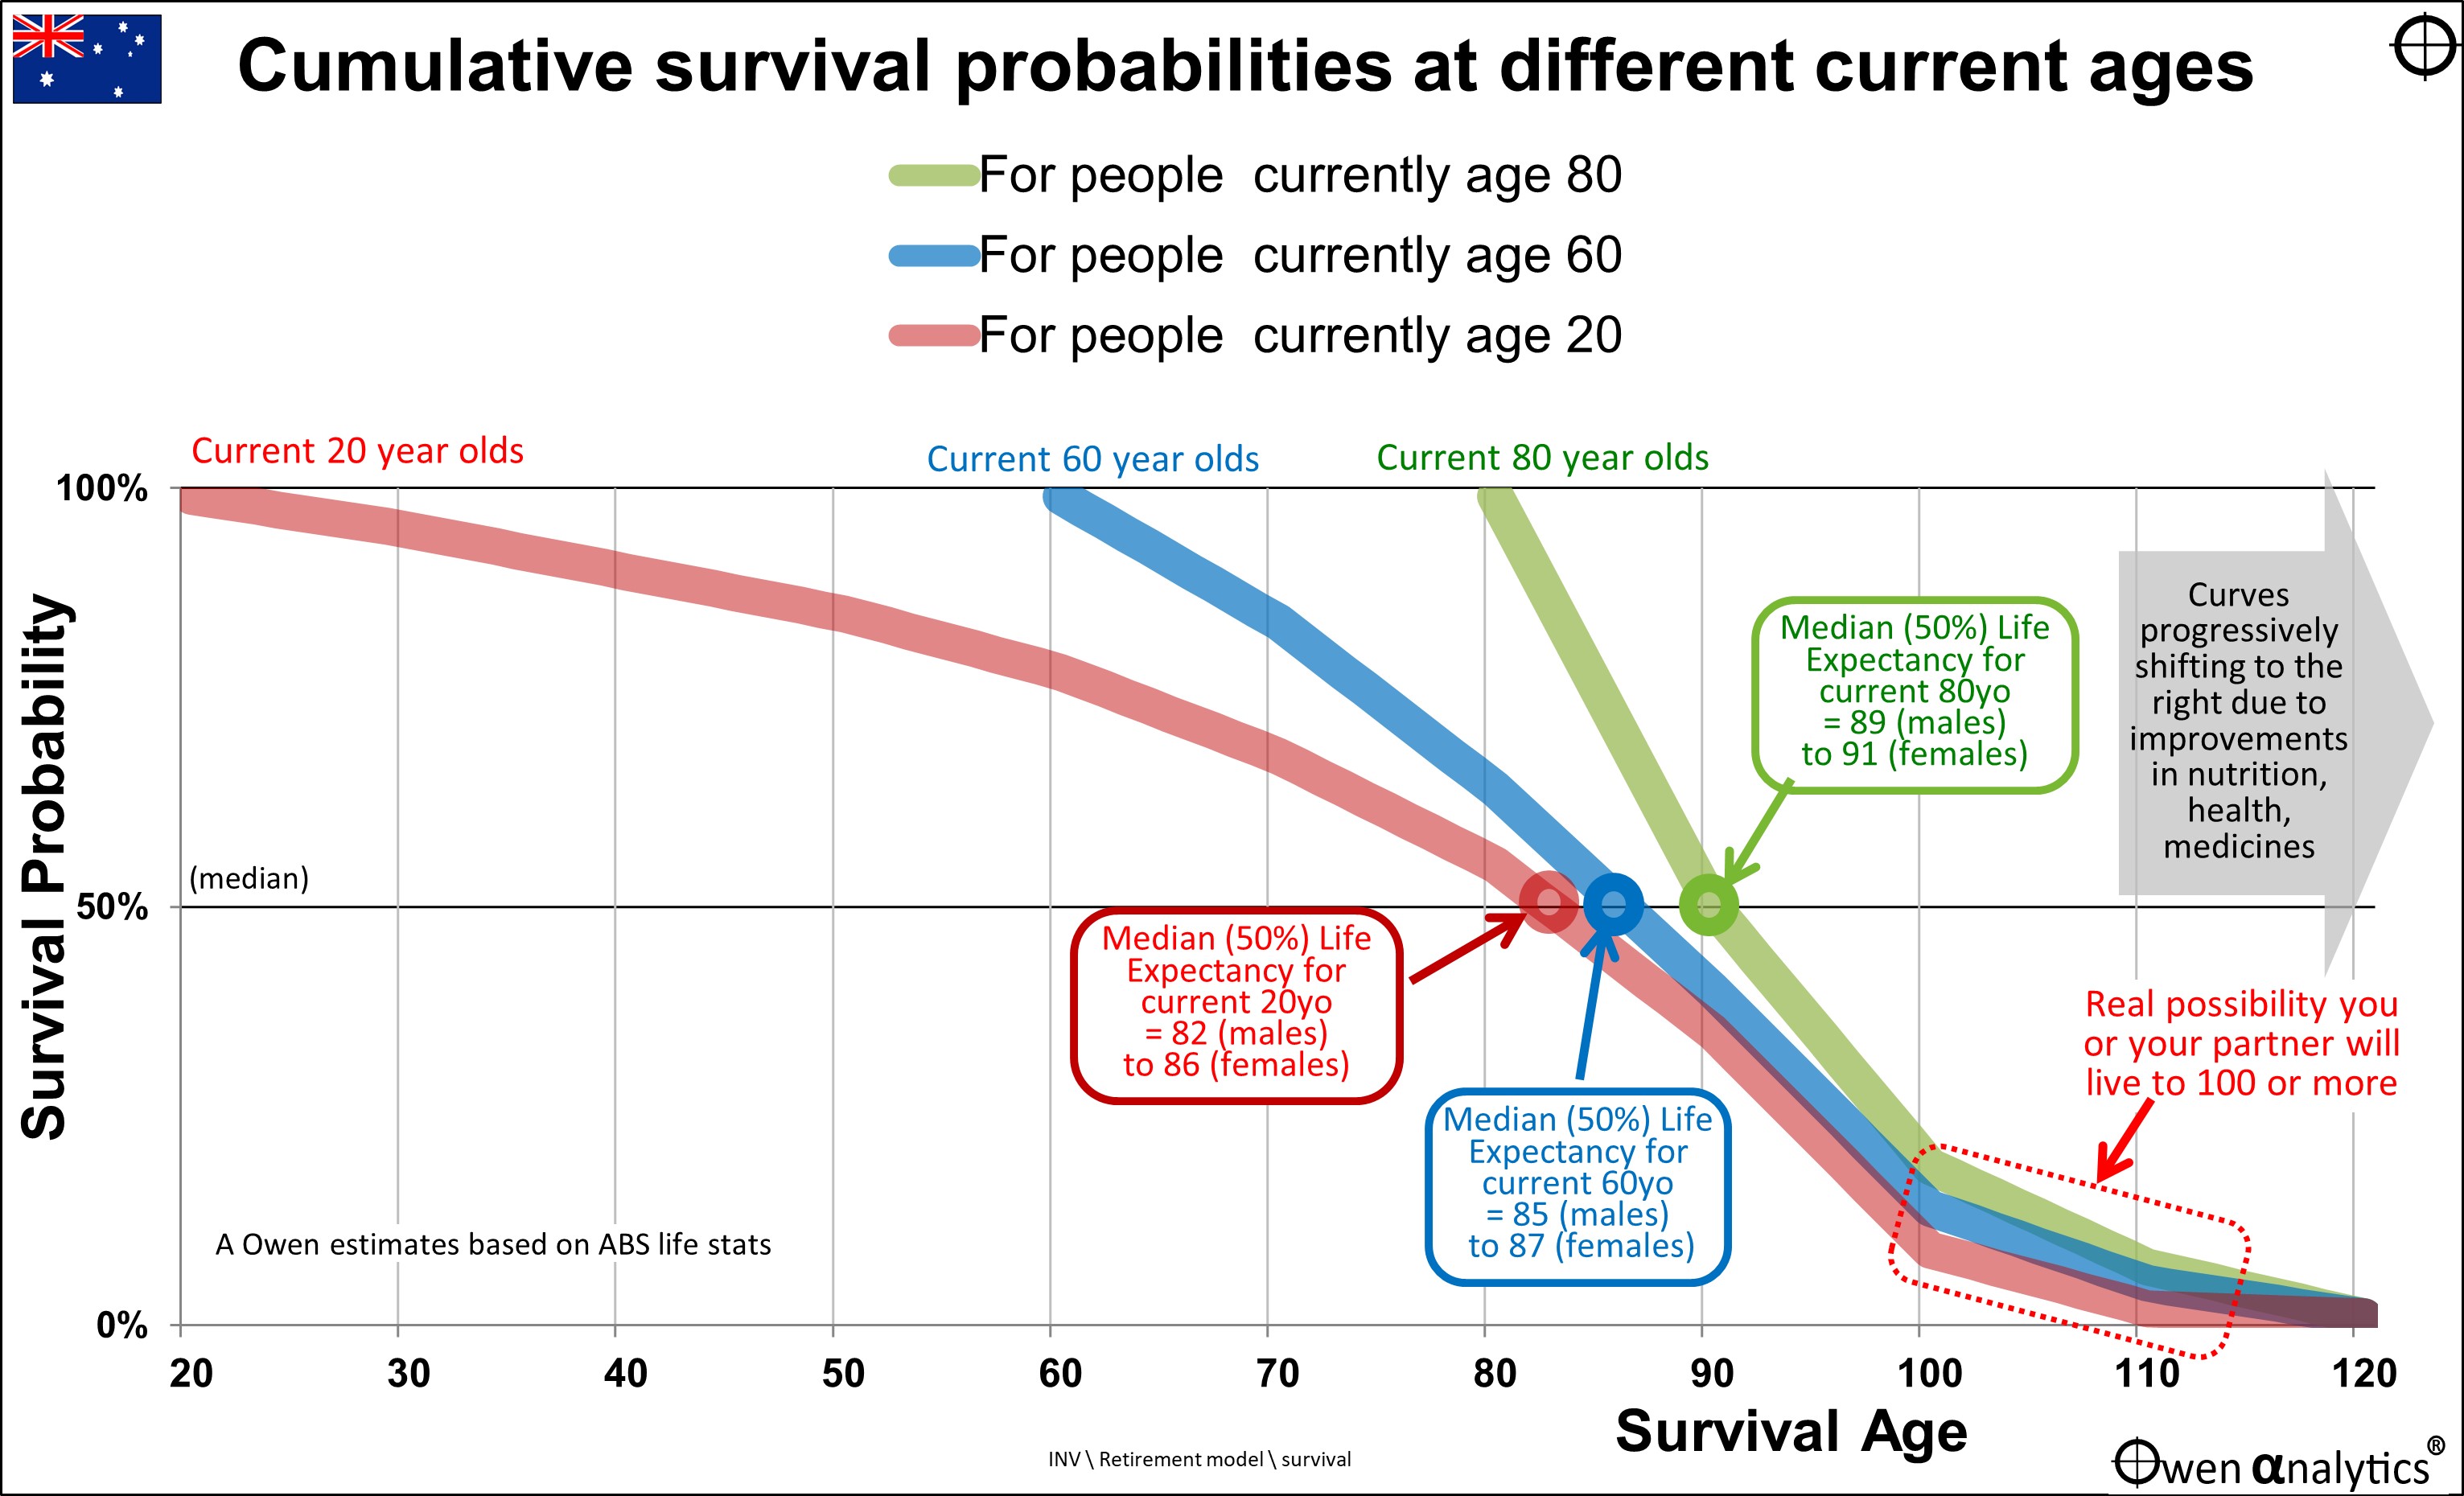
The first chart above is based on ‘medians’, but the next chart spreads life expectancy over the full gamut of possible outcomes.
It shows survival probabilities (vertical axis) and survival ages (horizontal axis) for three cohorts – current 20-year-olds (pink), current 60-year-olds (blue), and current 80-year-olds (green).
All three curves start out at the top at 100% because they are alive today, and there is a near-100% chance of surviving tomorrow. The curves decline over time – slowly at first – as people start to fall off the perch in untimely, early deaths.
All three curves decline over time, and they cross the 50% probability line (‘median’) at their current estimated median age of demise (death). These median ages are the same numbers from the first chart, except this second chart shows how today’s current 20-year-olds, 60-year-olds and 80-year-olds are likely to remain on the planet over time.
The three curves are deliberately depicted as broad lines to allow for the differences in life expectancy for males and females (and all of the various gender categories in between!)
For example, looking at the 60-year-olds (blue line) alive today, approximately 84% are likely to live to age 70, 64% are likely to live to age 80, 50% are likely to live to the median age of 85 (a mix of male/female/other).
Looking beyond the median age of demise (ie below the 50% line), 40% of today’s 60-year-olds are likely to live to age 90, around 14% are likely to live to age 100, and the rest are likely to live beyond 100.
The area in the red box in the lower right of the chart is to highlight the fact that in any couple, there is a real possibility that one of them will live to 100 and beyond.
Problem 3 – life expectancy has been steadily increasing throughout history, and this will probably continue
The life tables calculated by actuaries reflect current experience, current conditions, current technology and current medical knowledge. The problem is that human life expectancy has been rising steadily over time with improvements in medicines, hygiene, nutrition, health care, vaccines, technology, and many other factors.
There is every reason to believe that every decade that passes will further increase expected life spans, especially in ‘rich’ countries like Australia.
This means that the probability curves in both of today’s charts have been shifting steadily to the right (longer lifetimes) over time, and will probably keep shifting to the right in future. What you consider now as a remote possibility of living to 100, will become more and more likely over time.
Problem 4 – your own individual factors - health, fitness, lifestyle, diet, genetics, etc – may mean you live even longer
We can’t change our genetics, but we can try to remain as fit and healthy as possible for as long as possible. That is fine, but it will increase your chances of running out of money if you just use the standard calculators and life tables in planning for how much capital you need, and how much you can afford to spend.
If you consider your-self fitter and healthier than average for your age group, then it would be prudent to err further on the side of caution and plan to be on the high side of the ‘median’.
100 is not a bad age, and a nice round number to lock into your numbers to enhance confidence and peace of mind.
My parents
My father died a decade ago at age 80. He was born on a rubber plantation in Malaya (now Malaysia), and grew up on the bombed-out streets of war-torn, Japanese-occupied Singapore. He spent the next 30 years smoking five packets of cigarettes per day, and then a pipe at night (as a kid I remember stacking is pipe for the nightly puff). He ended up having a bunch of cancers (lung, prostate, bone, bone marrow), and had an excruciatingly painful last few years due to a twisted arthritic spinal cord. Was mentally very sharp to the end, but physically wrecked.
At birth, his life expectancy was probably around 50 at best (poor, rural third world country), so he ended up out-living that by probably three decades.
My mother is still battling on at 96 (birthday today 6 June). Mentally shot, but physically very durable. Has had numerous broken bones from countless falls (she literally got out of hospital last week (late May) after an operation on a broken femur – again!), has had cancers removed (thyroid, bowel). In hospital about every month or so for a variety of things, and has major operations once or twice per year. Mentally totally shot, with advanced vascular dementia from multiple minor strokes.
At her birth in 1928 in outback Australia, her life expectancy was 63 (Australian Year Book 1926, p.971), so she has also out-lived that by three decades so far, and she’s still going.
In both cases, their ‘survival curves’ shifted three decades to the right over their lifetimes. Mine and yours will probably do the same.
Me
In my own case, I was also born in a poor third world South East Asian country in the midst of colonial battles for independence and communist uprisings, so my life expectancy at birth would have been perhaps 50 or 60 at best.
Had I been born in Australia (where I have been lucky enough to have lived most of my life), my life expectancy at birth would have been 67 (Australian Year Book 1959, p.346). But having survived thus far, my life expectancy is now 85 (ABS 3302 Table 1), so my survival probability curve (even if I had been born in Australia) has already shifted two decades to the right, and I’m not done yet!
Homework!
What was your life expectancy at birth? (If you were born in Australia, life expectancy tables are included in most Year Books. You can download Australian Year Books going back to 1901 here: www.abs.gov.au/)
Having survived thus far, what is your life expectancy now? See ABS 3302 - https://www.abs.gov.au/statistics/people/population/life-expectancy/latest-release
How far has your own survival probability curve shifted to the right over your lifetime so far?
Be prepared for the real possibility of a much longer life than you might have thought!
Where are you and your family on the Survival Probability Curve?
You can plot yourself and your family on the Survival Probably Curve to get a rough picture of the future paths you are on.
Here is the second chart again – this time showing the positions of me and my family (including my father and younger brother who have passed away. Father’s circumstances outlined above. Brother died in a plane crash at age 52 – flying his own single-engine plane).
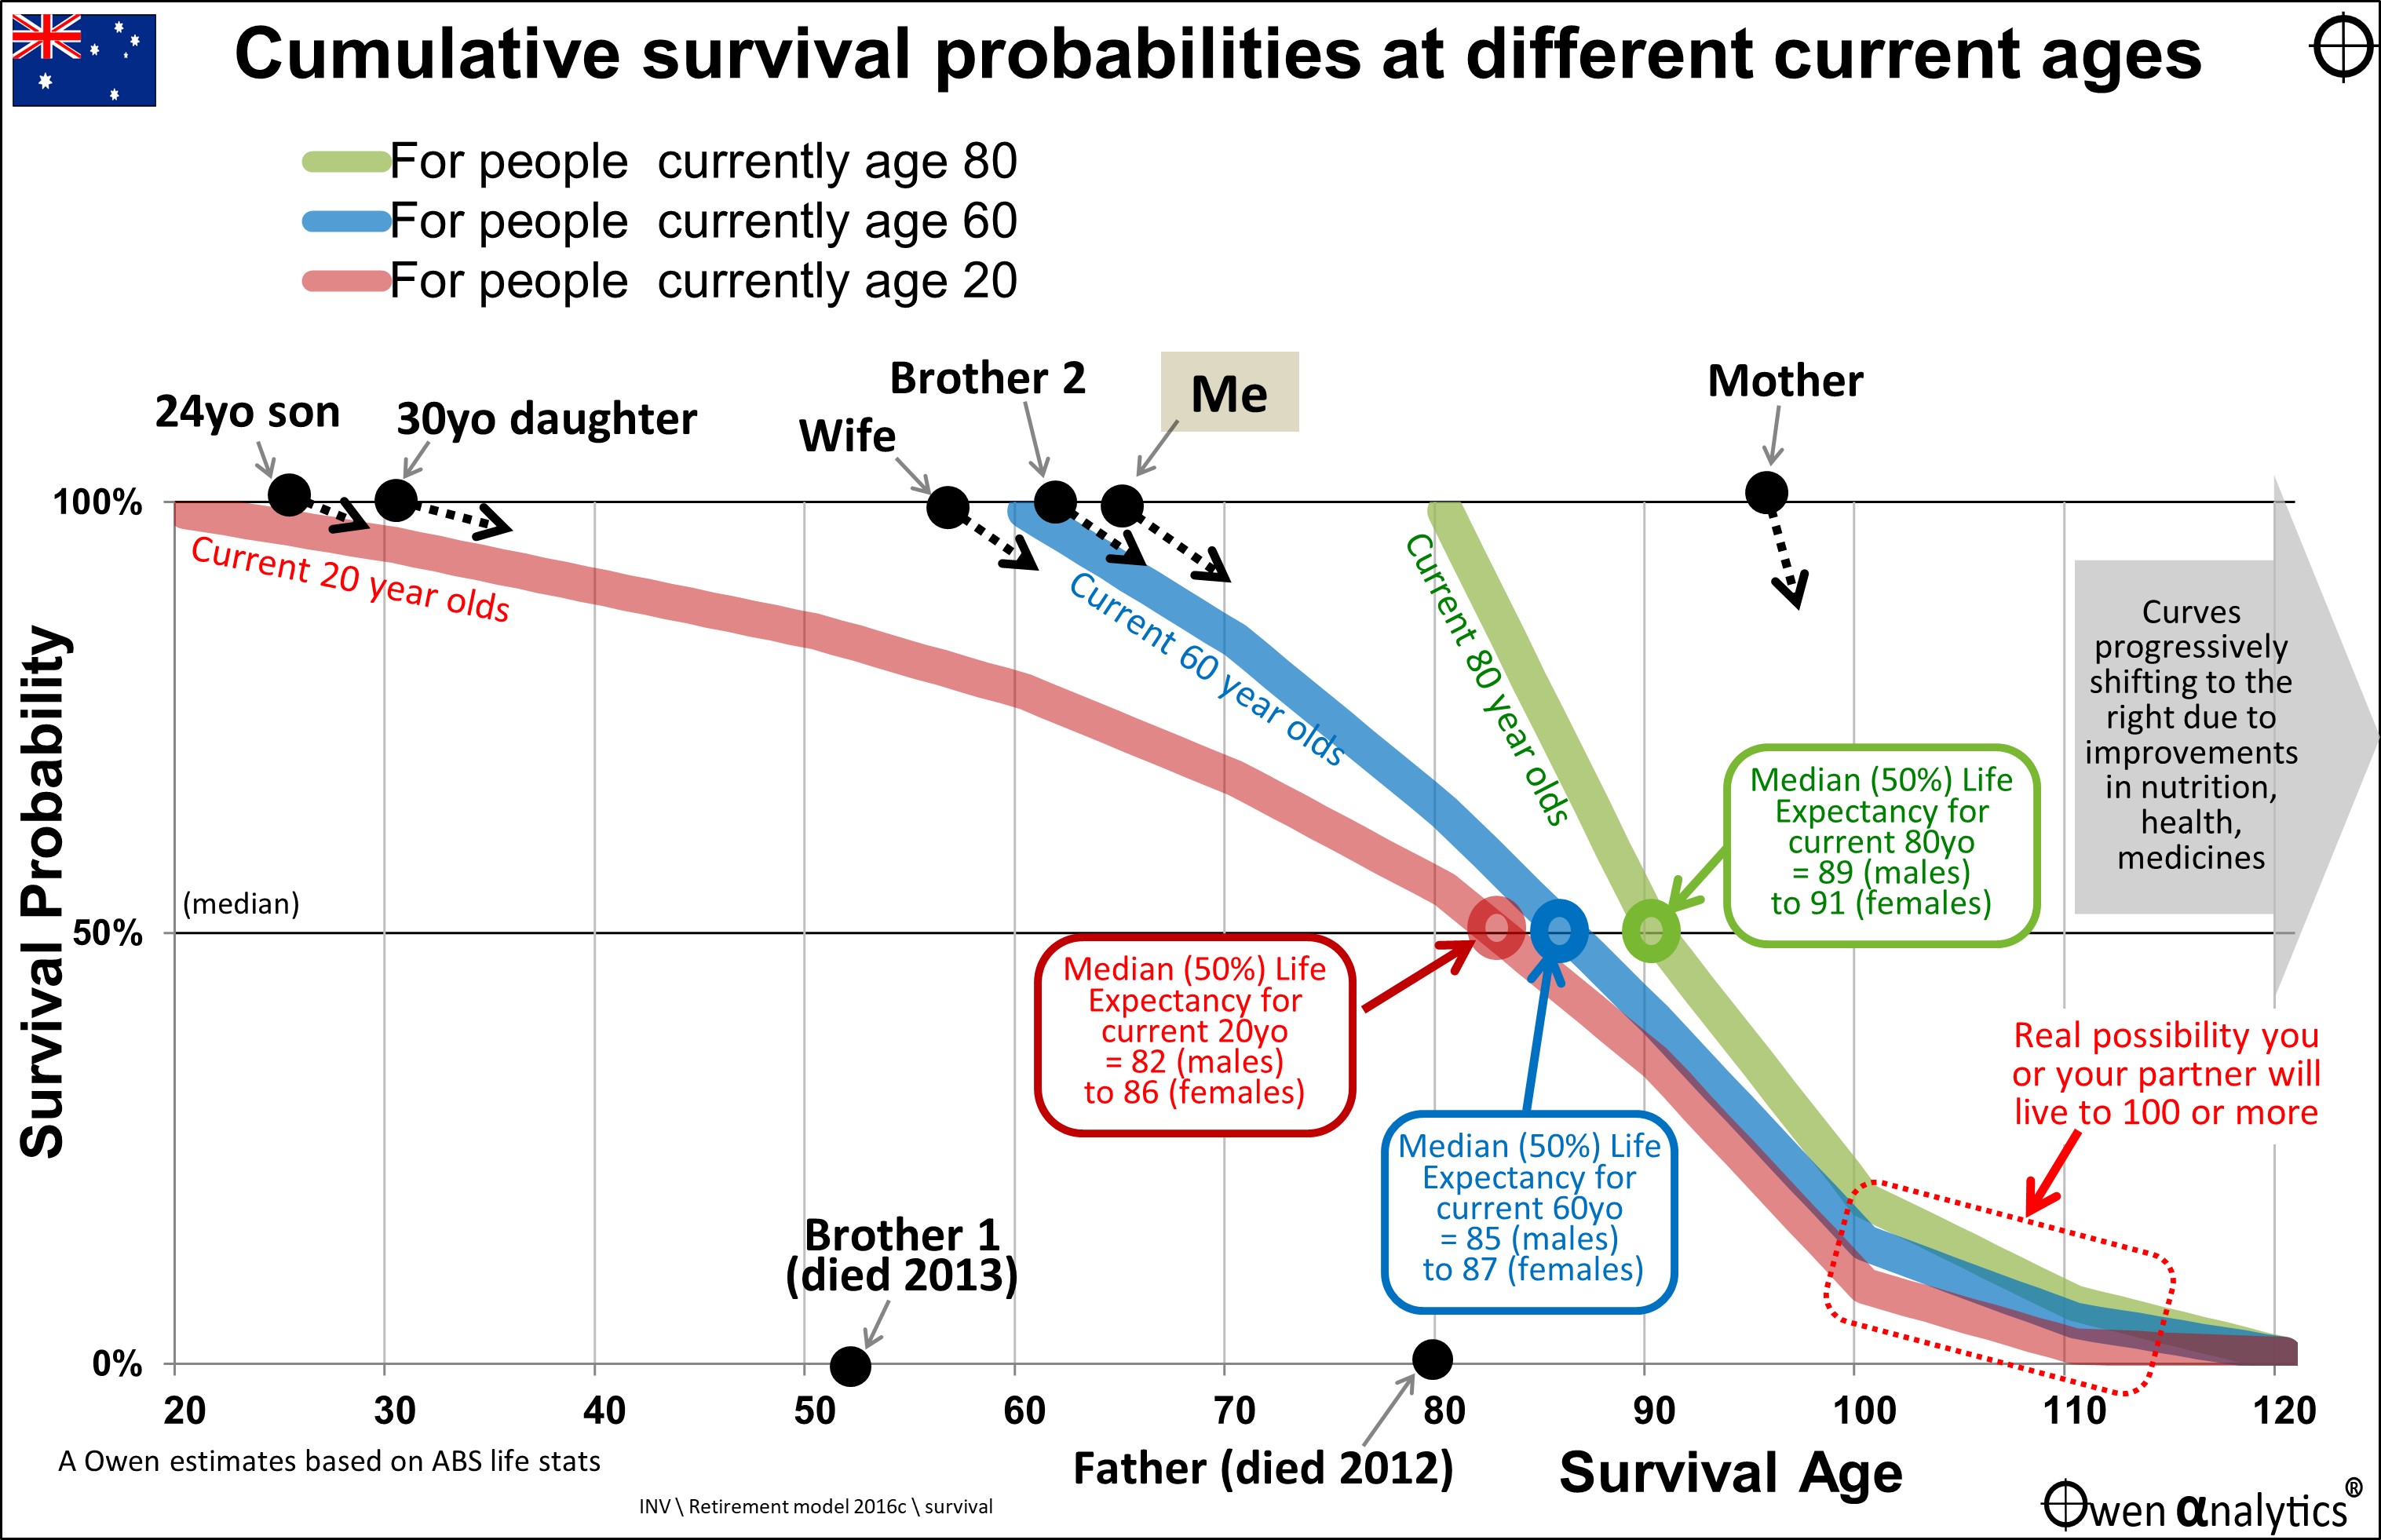
The arrows are all heading down, reflecting the ever-present risk of demise every day. But the good news is that every year you survive, you remain at the top 100% line, and shift one year to the right!
Where are you and your family on the Survival Probability Curve? Do you have better or worse genetics, fitness, health than other people your age?
What are the prospects of you living to 100 or beyond? How will you finance it?
‘Till next time – live long and prosper!
See also:
What's your Number? Part 1: 'How much do I need to retire?', 'How much can I afford to spend?'
'What's your Number? Part 2: 17 key factors’ driving ‘How much do I need’ & ‘How much can I spend?'
Thank you for your time – please send me feedback and/or ideas for future editions!