Here are 17 key drivers that determine 'How much do I need to retire', and 'How much can I afford to spend?'
How do they work, and how do they apply to you?
This handy guide will help you come up with your own Number that suits your needs and goals.
It is not intended to arrive at an exact number, as forecasting is never an exact science. It is intended to help readers understand the issues, assist in refining goals, trade-offs and priorities, and provide a starting point for discussions with family and professional advisers.
Let's get started. . .
In Part 1 - What's your Number? Part 1: 'How much do I need to retire?', 'How much can I afford to spend?' – I outlined the idea of everybody having a ‘Number’ to aim for, and I used some generic examples to illustrate the concept.
Today, Part 2 outlines 17 key factors that can make a big difference in estimating what each person’s own minimum required Multiple of Spending Budget, and their maximum Safe Spending Rate, given their individual circumstances.
For example, for the first factor – current age: taking two extreme examples - my 95-year-old mother needs a lot less capital (lower Multiple of her spending budget, and a higher Safe Spending Rate) than say a trust set up to support a 20-year-old disabled child for the rest of their lives, which may be many decades.
Quick re-cap on Part 1
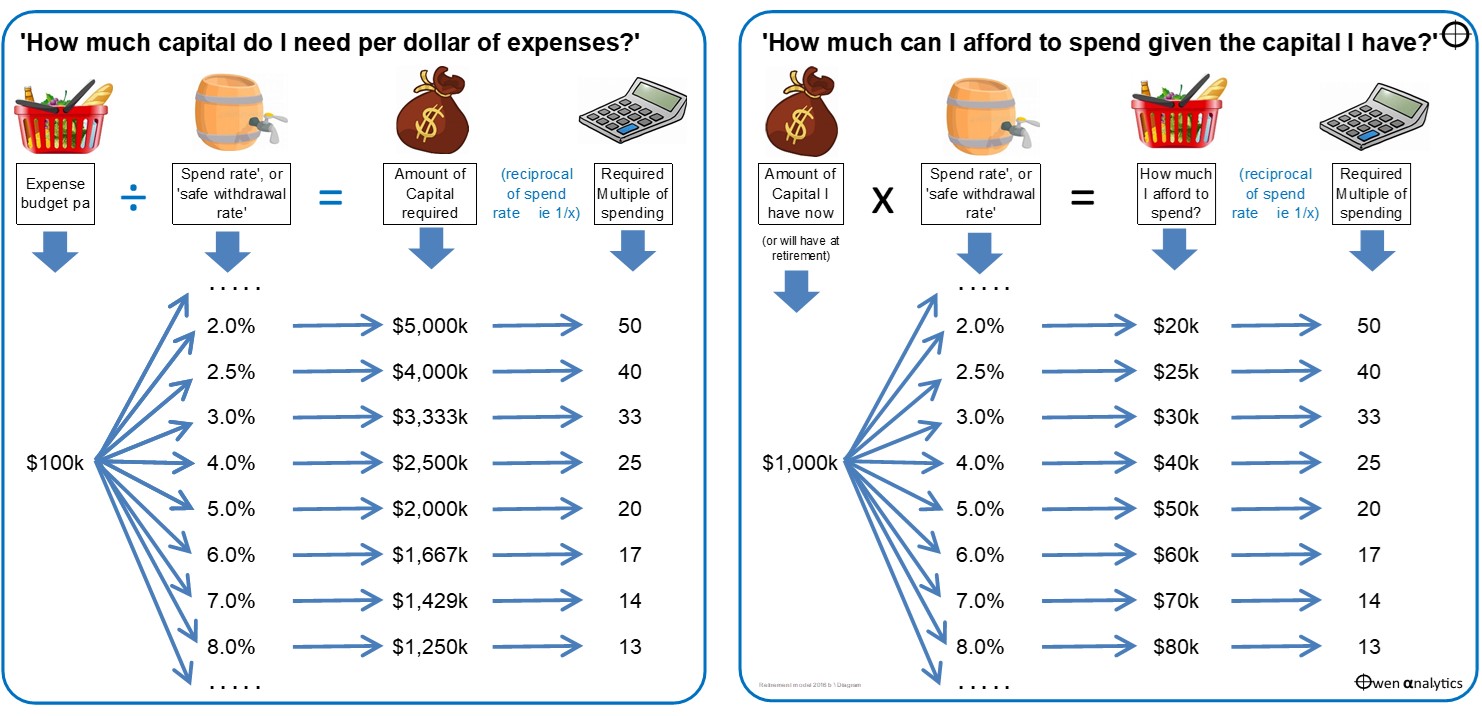
In Part 1, we looked at the two key questions:
- How much capital do I need to be able to finance a given spending budget (rising with inflation), with a good degree of confidence that I will not run out of money, ie that my money will last as long as I do, and with enough left over to satisfy my bequest goals (eg leave a financial legacy for my family and/or other causes). This is the minimum required Multiple of my spending budget,
and
- Given the amount of capital I have (or are aiming for at retirement), how much I can safely afford to spend each year with a good degree of confidence that I will not run out of money, and that my money will last as long as I do, with enough left over to satisfy my bequest goals. This is maximum ‘safe spending rate’ (or ‘safe withdrawal rate’). The Safe Spending Rate is merely the ‘reciprocal’ of the required Multiple. For example, if the minimum required multiple is 20, the maximum safe spending rate = 1/20 = 5%.
- Other related questions like - ‘How long will my retirement savings last?’, and ‘When can I afford to retire?’ are driven by the same numbers.
‘Retire? Me? Never!’
Even if, like me, you don’t want to actually ‘retire’, but want the freedom to be able to scale back work or take an indefinite break, or donate your time to charity, or if you are prevented from working by health or family circumstances, it is useful to have an idea of how much capital will you need, and how much you can safely afford to spend given the capital you have.
NB.
‘Capital’ includes not just ‘superannuation’ fund balances, but also includes other investment assets excluding the family home, minus ALL debts, including any mortgage on the family home. You should also deduct large initial one-off expenses – like the ‘big trip’, or the house extension, or the 1965 Mustang you’ve always promised yourself.
The ‘Spending Budget’ can also vary over time – eg more in the early ‘active’ years, less in the middle ‘quiet’ years, then rising in the final years as medical and aged care expenses rise.
Part 1 also provided two quick tests to help readers see how far along on the journey they are now.
Those quick tests used a required multiple of 25 times the spending budget (ie a 4% ‘Safe Spending Rate’ on capital) because I have found over many years, and through many kinds of market conditions, that this is roughly where most people end up.
But you and I are not ‘most people’!
The actual Multiple and Safe Spending Rate will be different for everyone – depending on their own circumstances, and it also depends on market conditions at the time.
Wide range of possible outcomes
Depending on each person’s individual circumstances, there can a wide range of outcomes. At one extreme, if you are happy to rely on the government age pension (currently around $28k per year for singles, and $22k each for couples), and if are sure that all of your other capital and income needs are going to be paid for by others, and/or by selling the family home, then your required capital base and multiple is Zero.
This is the most popular option in Australia. After more than 30 years of compulsory employer superannuation in Australia, the median superannuation balance of Australians aged between 60-64 is just $181k for males, and $139k for females. Up to half of all retirees use their super to pay off debts when they retire, and so two thirds of Aussie retirees just go on a government age pension!
One very popular ‘retirement calculator’ that is used by countless super funds on their websites is provided by the Association of Superannuation Funds of Australia (ASFA). On their numbers, a typical retired Australian couple aged 65-84 can enjoy a ‘comfortable’ retirement on an expense budget of $70k (December 2023 numbers), and they say this requires just $690k in capital.
That’s a spending rate of 10% (ie required capital is a multiple of 10 times spending budget). This, and almost all other online retirement calculators, assume you will be relying on the government age pension when your money runs out, and it assumes the government pension will remain in place in its current form and eligibility, and indexed, forever.
On the other hand, there are many cases where the minimum Multiple of spending budget is 30 or more, ie a maximum Safe Spending Rate of 3% or less.
Table of 17 key factors
Today’s table outlines 17 important factors that can make a big difference in estimating ‘How much do I need to retire?’ (minimum required Multiple of Sending Budget), and ‘How much can I afford to spend?’ (maximum Safe Spending Rate), for each person given their individual circumstances.
For each factor, readers can select where they are on a scale from 1 to 5, with a mid-point of 3. Some are relatively easy (eg factor 1: Current Age), but other can be quite difficult to assess.
Some factors appear straightforward (eg Factor 12: Importance of not ‘eating into capital’), but often requires a major re-think about goals and priorities once people realise how much more capital it requires in practice.
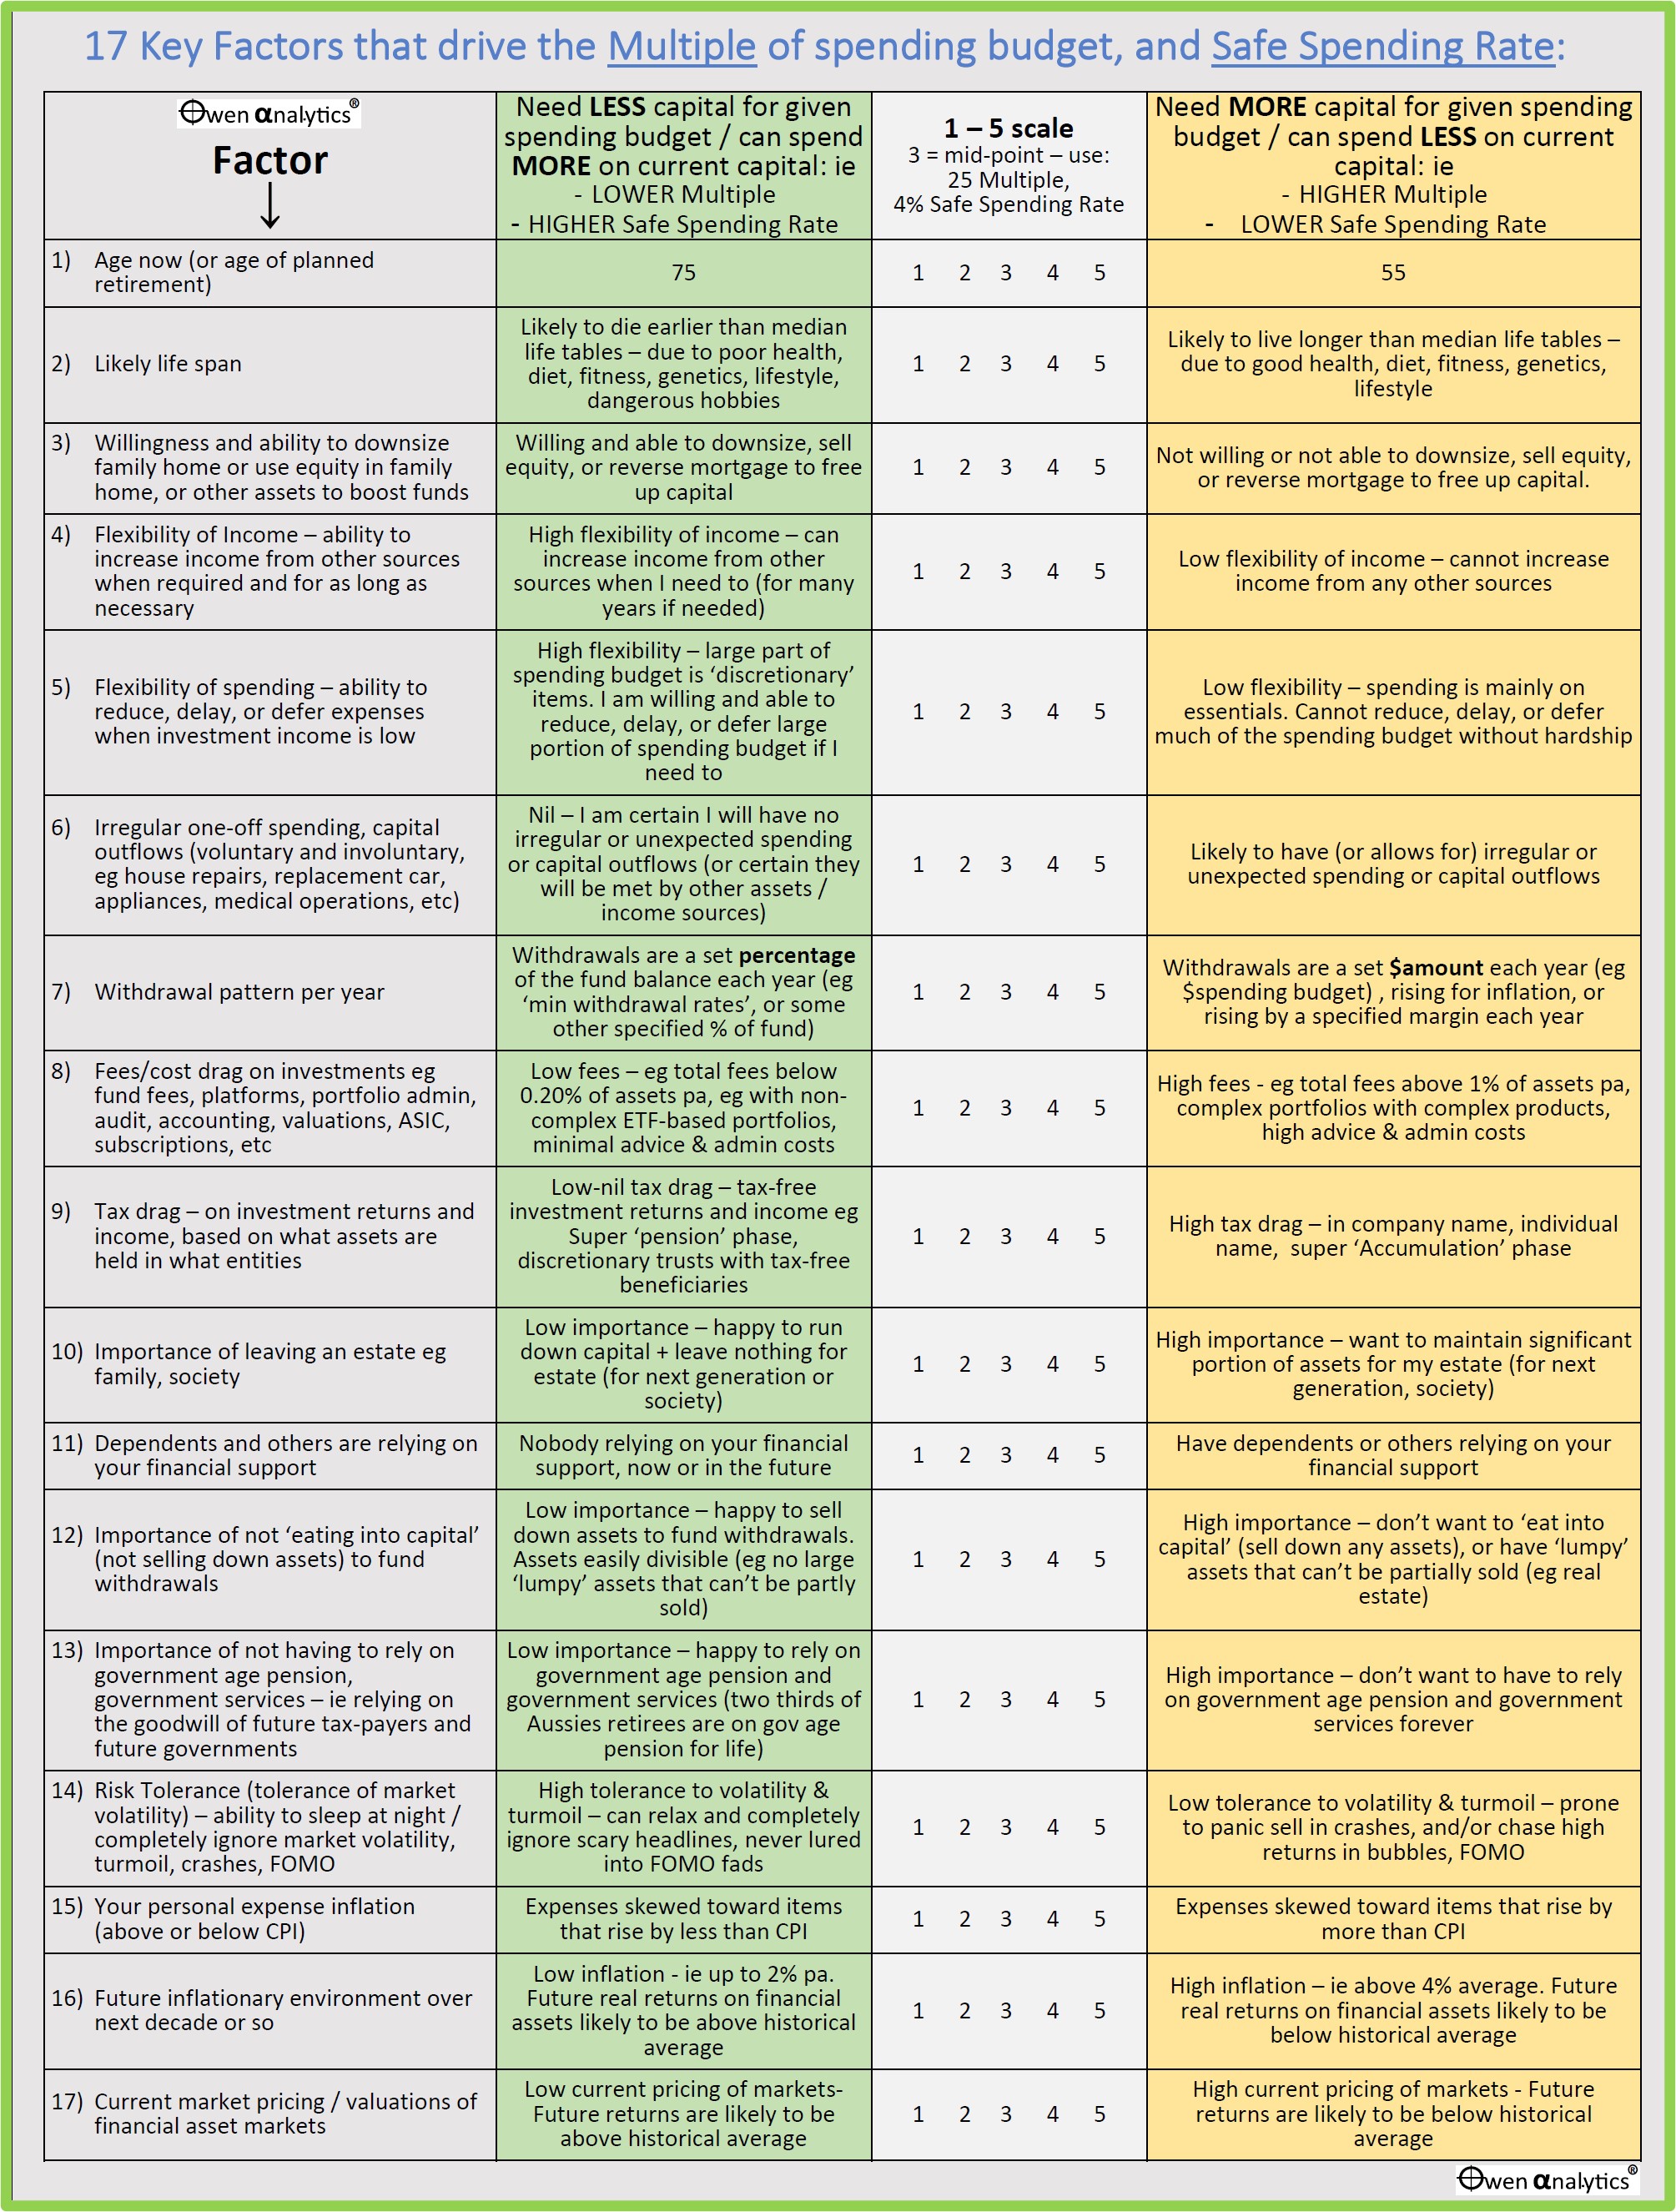
Green and Pink zones
The green column describes the conditions that would require a lower Multiple of the spending budget, and allows a higher Safe Spending Rate on capital. These apply to scores of 1 or 2 for the given factor.
The pink column describes the conditions that would require a higher Multiple of the spending budget, and a lower Safe Spending Rate on capital. These apply to scores of 4 or 5 for the given factor.
Mid-point ‘3’ on the scale
Our starting point or ‘base case’ with a mid-point score of ‘3’ is for a 65-year-old requiring a Multiple of spending budget of 25, ie a maximum Safe Spending Rate (or ‘safe withdrawal rate’) of 4% of capital.
Remember, this is just the starting point. Everybody will end up with a different Multiple and Safe Spending Rate depending on their scores on each factor (and everyone has a different Spending Budget to start with).
The aim of this exercise is not to arrive at an exact number for the Multiple and the Safe Spending Rate. There is no such thing as an exact number.
The aim is merely to outline the main factors that influence the outcome, and provide users with a broad sense of whether they are likely to need more or less capital given their spending budget. It is intended as a starting point for discussions with family and professional advisers.
Example - Factor 1: current age
Starting with the eastiest one - If you are currently 55 years old and you wish (or fear) never having to work for money ever again, you would circle ‘5’ for this factor. (Life expectancy is dealt with in Factor 2).
A score of 5 is on the Pink side of the table, indicating that your required minimum Multiple of your spending budget is probably going to be higher than 25 – ie your maximum Safe Spending Rate is probably going to be lower than 4% of capital. (Alternatively, you may need to re-assess your desired spending budget).
On the other hand, if you are currently 75 years old, you would circle ‘1’ for this factor.
This is on the Green side of the table, indicating that your required minimum Multiple of your spending budget is probably going to be lower than 25 – ie your maximum Safe Spending Rate is probably going to be higher than 4%.
How much higher or lower will depend very much on how you score on the other factors.
Factor 2: likely life span
Here you assess whether you are likely to live longer or shorter than actuarial life expectancy tables.
For example, if you are 65 years old now, you are projected to live to 85 (males) and 88 (females) according to official actuarial tables in Australia. We look at this in a separate story, but it worth noting here that if you think you are heathier, fitter, and more genetically blessed than average, you might give yourself a score of 4 or 5. In that case, your capital may need to last a lot longer than the life tables suggest.
It’s a cruel curse, but your minimum Multiple of spending budget will be higher, and your maximum Safe Spending Rate will be lower. On the other hand, your good health may allow you to work longer and build up your capital base. You’ll need it if you’re going to live to 110!
Some of the factors require more detailed explanation and require a lot more modelling to demonstrate the impact on capital needs and spending rates.
We will look at each of the main factors in separate stories in this series, to assist in in self-assessment, and to assist in discussions with your family and your adviser.
Two factors are already locked in
Two of the factors are related to the market environment and apply to everybody, regardless of their individual circumstances. These are:
Factor 16: Future inflation environment.
I would give this a score of 4 at the moment, and it applies to everybody. We are probably heading into an era of above average inflation for the next decade or so, and certainly higher average inflation than we have had over the recent couple of decades.
If this is the case, it will mean that it is highly likely that future real returns on financial assets (shares, bonds, real estate) are going to be below historical averages, and therefore the Multiples will be higher and the Safe Spending Rates will be lower.
See: The Low Inflation era of great returns is over. Investing just got a whole lot harder! (16 Apr 2024)

Factor 17: Current market pricing / valuations of financial asset markets
This is the second market-related factor that is already locked in for everybody, regardless of their individual circumstances.
High current levels of pricing of financial asset markets (shares, bonds, real estate) mean that future real returns are also likely to be below historical averages. Therefore, this is another reason that Multiples will be higher and the Safe Spending Rates will be lower.
See:
US shares vastly over-priced and primed to fall – but what will be the trigger? (US ‘CAPE’ ratio update) (22 April 2024)

Australian shares ‘Shiller/CAPE’ ratio: not over-priced like the US. Uncle Sam still calls the tune (11 Oct 2023)

How does current market over-pricing affect how much capital I need?
If share markets are currently priced at say 50% above their underlying, fundamental, ‘fair values’ (measured by pricing relative to profits, dividends, book values, and a host of other valuation techniques), it means that, when you look at your index fund balance of say $500k, you need to realise that it is not really 'worth' $500k.
The underlying sustainable fair value is actually more like $333k ($500k / 1.5), and the over-pricing will soon evaporate – it always does. In fact, when over-priced market booms collapse, as they always do, they always swing too far, into cheap territory, when you can buy assets below fair value if you have the nerve.
So it works both ways: in over-priced booms (like now), your fund statement over-states the actual underlying fundamental value of the assets you own, so if you are going to use the boom-time portfolio statements that over-state you actual net 'worth', you will need a higher multiple of your spending budget, and your Safe Spending Rate is going to be lower.
On the other hand, after a major market correction when assets fall below their fair values, your fund statements will under-state the actual underlying fundamental value of the assets you own, so you will need a lower multiple of your spending budget, and your Safe Spending Rate is going to be higher.
Learn to ignore current pricing and focus on the underlying assets
Booms tend to give people a false sense of wealth. In reality, they are not really richer at all. Prices are just temporarily high in the boom, that’s all. It is a skill to ignore temporary market over-pricing and just focus on underlying cash flows, profits and sustainable value of their investments.
Likewise, market crashes tend to give investors a false sense of ‘loss’. Unless they panic sell in a crash, they are not really poorer at all. Prices are temporarily low in a panic, that’s all. Their real wealth has not changed at all. It’s just the volatile and irrational market pricing that makes people think they are suddenly richer or poorer.
These two factors - inflation and market pricing - are difficult to illustrate without examples. These, and other factors, will be explained in more detail in separate stories.
Wrap-up
This quick guide is not intended to be a complete list of all the variables that determine how much you might need to finance a given spending budget, or how much you can afford to spend on a given level of capital. It is intended to point out the main factors involved, to illustrate the types of impacts they may have on your circumstances.
Nor is it intended to arrive at an exact number, as forecasting is never an exact science.
It is intended to help readers understand the issues, and provide a starting point for discussions with family and professional advisers.
This approach does not apply just to people retiring now, or aiming to build a capital base to retire in future. It also applies to people who may have retired years ago. They still need to look at what capital they have now, and look at their current spending rate on that capital, to assess whether it so going to allow them to continue their current lifestyle at the current rate. Or assess what sort of lifestyle (withdrawal rate) they can safely afford on their level of capital.
Once you have assessed yourself against the 15 factors (Factors 16 and 17 are already locked in), you can form an opinion about whether your overall score is likely to be higher or lower than the mid-point score of 3 on our 1-5 scale. Ie whether your multiple of spending budget is going to be higher or lower than our reference point of 25.
You can take your estimated Spending Budget and go back to our two back-of-the-envelope tests in Part 1 to see how you’re going on your journey to reach your required capital base.
What's your Number? Part 1: 'How much do I need to retire?', 'How much can I afford to spend?' –
You can also see how much you can safely afford to spend/withdraw given your current capital base.
I hope this helps you understand the issues and the journey ahead. At the very least, it should assist in thinking about your goals and priorities.
Look out for upcoming stories where I look into some of these factors in more detail.
‘Till next time – happy investing!
Thank you for your time – please send me feedback and/or ideas for future editions!