This week, Aussie retailer JB Hi-Fi (ASX:JBH) reported lower revenues, profits, and dividends – but its share price surged to a new record – above $60 for the first time ever. Why?
Here is my quick snapshot. It is not ‘advice’ – just (hopefully) useful information to help people form their own views and make their own decisions.
It is a case study on how retailers can succeed or fail when faced with challenges and opportunities. It is also an IPO that I passed up.
Share price performance
JB has certainly been a star performer over the past 20 years since its October 2023 float. Its share price has risen 40-fold, compared to the broad market index which has barely doubled.
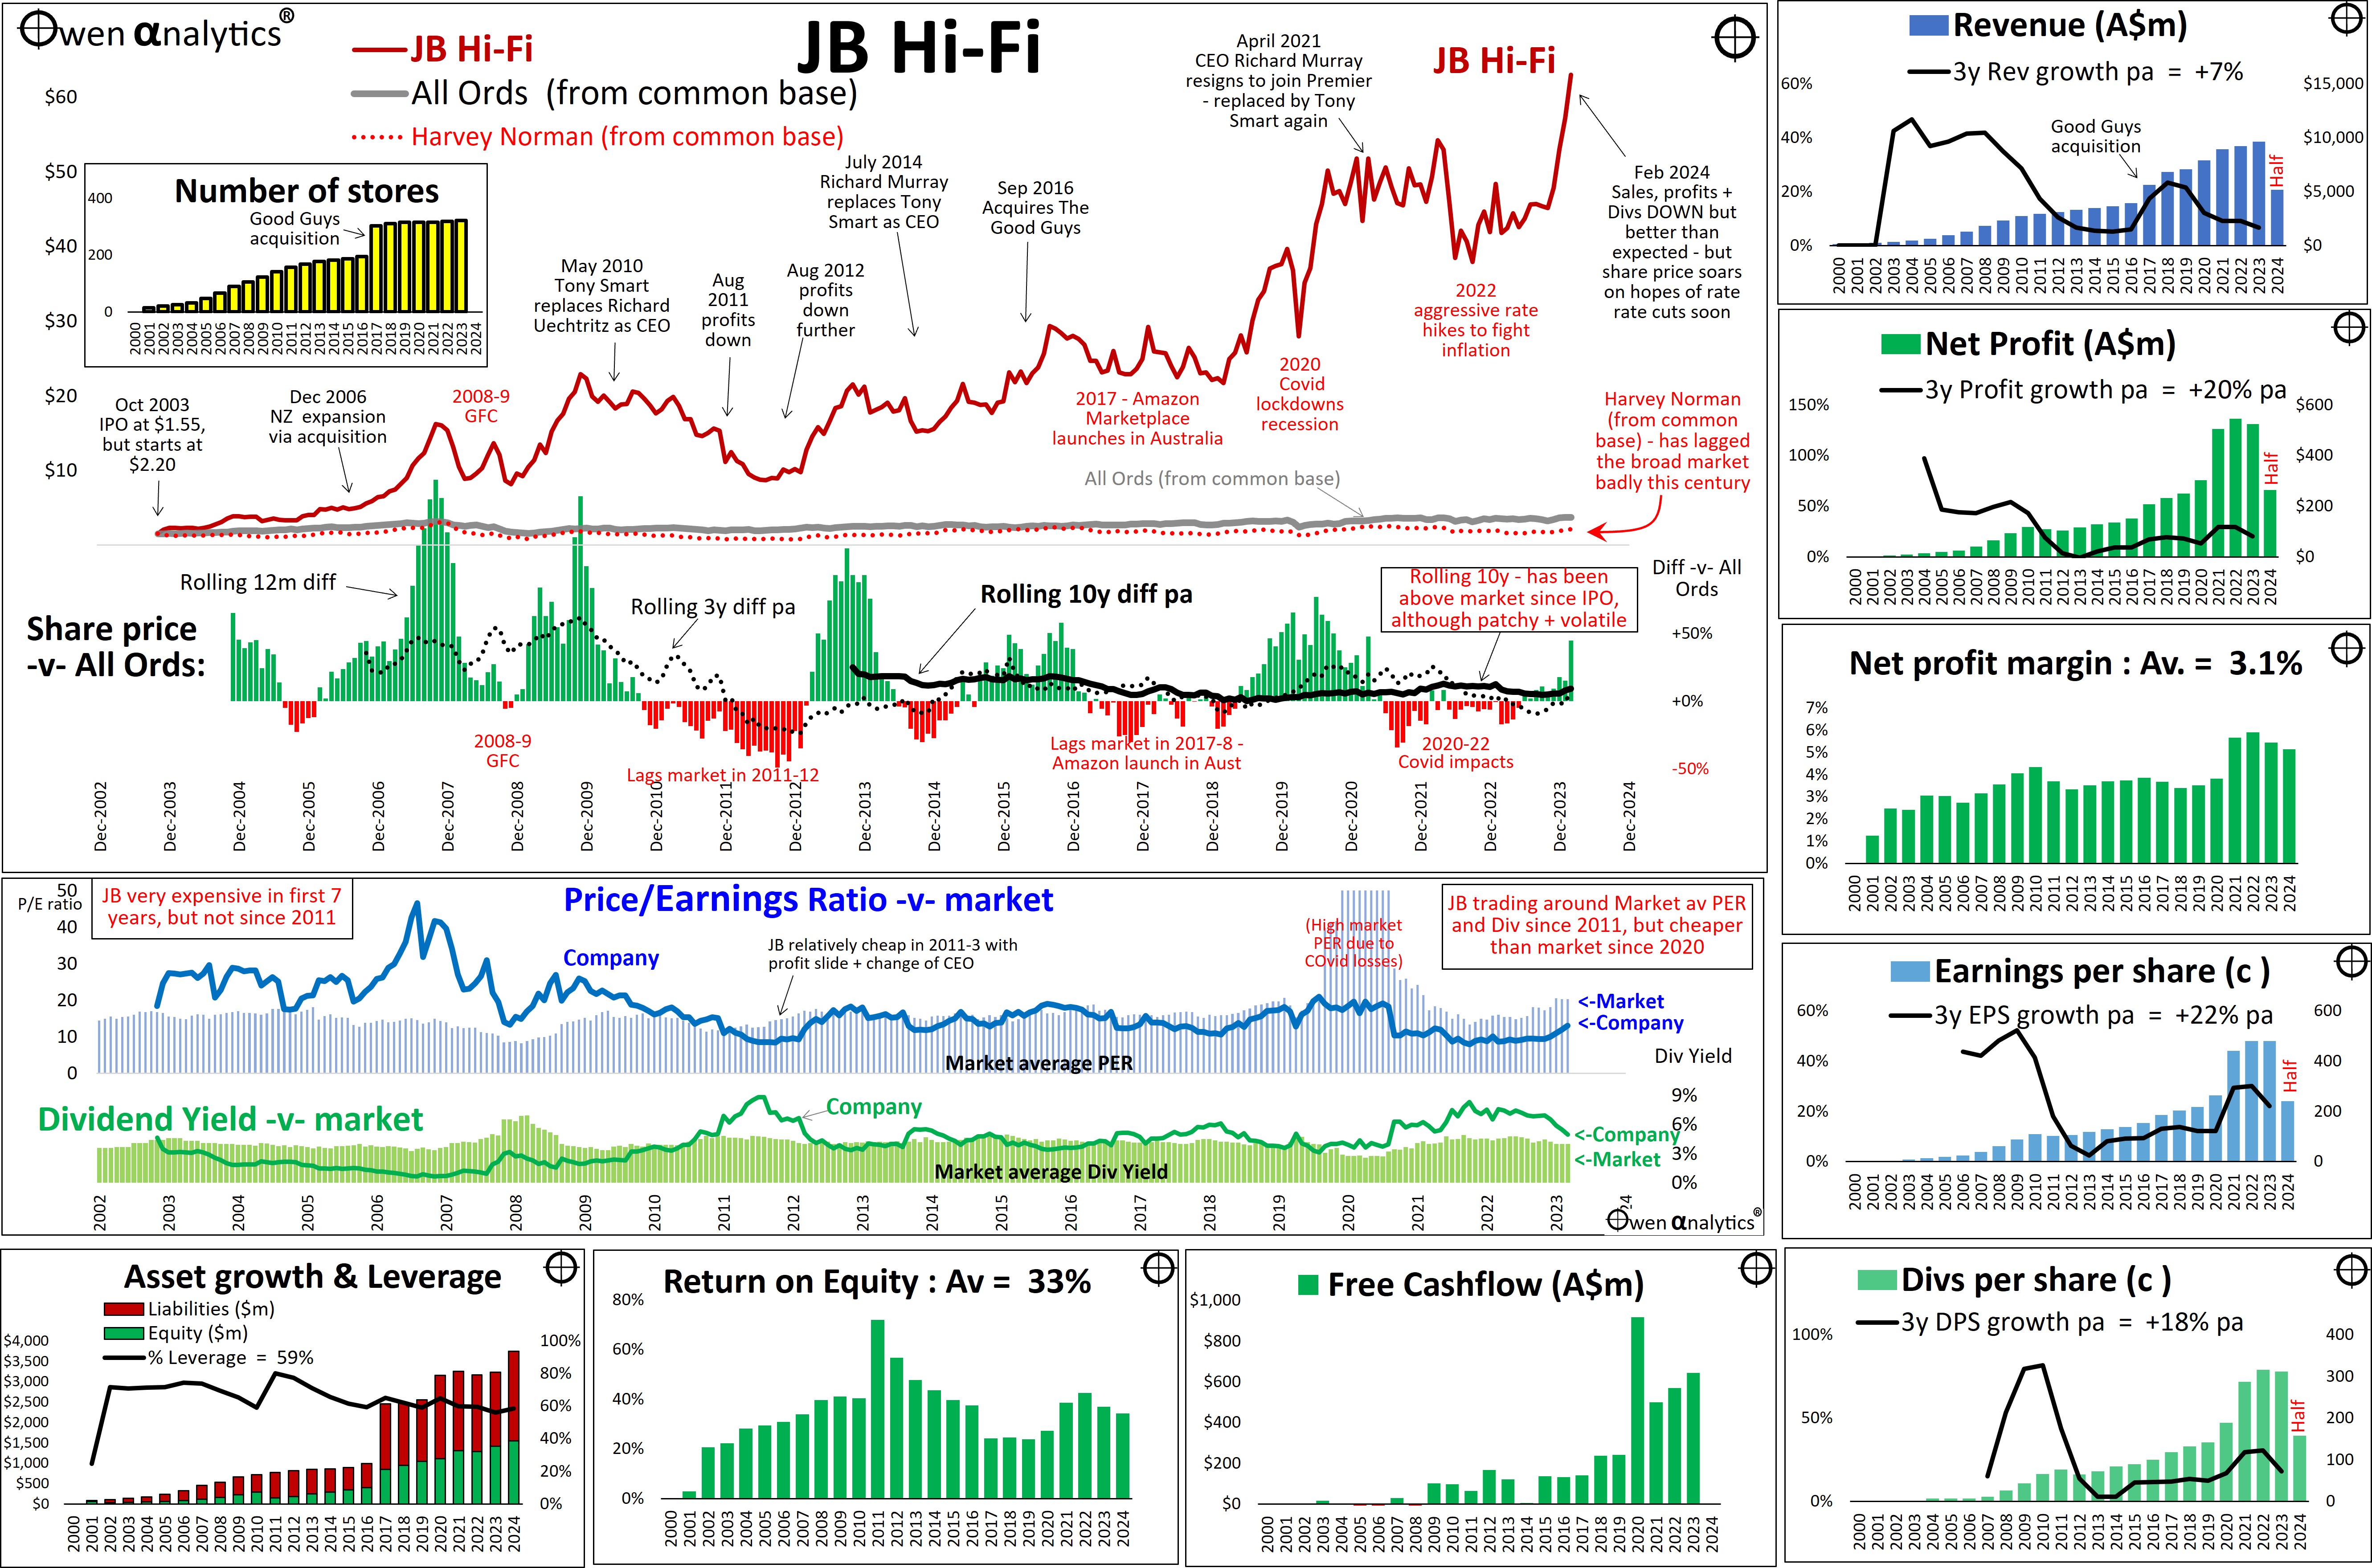
The main chart shows JB’s share price (maroon line), compared to the broad market (All Ords, grey line), which appears virtually flat compared to JB’s explosive price growth.
Also shown is Gerry Harvey’s Harvey Norman, which was the star retailer of the 1990s, but has languished behind the broad market this century (red dotted line).
The lower section of the main chart shows share price performance relative to the overall market index. There are three measures:
Rolling 1-year
The green/red bars show rolling 12 month price performance relative to the market – green for positive, red for negative.
The frequent patches of red indicate the volatile nature of retailing profitability – due to the combination of narrow profit margins and leverage (we cover these below).
Rolling 3-year
The black dotted line shows rolling three-year performance relative to the market. We use three-year periods to highlight factors that are likely to be more than just the usual economic cyclical effects.
There have been three periods of rolling three-year share price lags for JB (black dotted line below zero).
- The first was in 2011-2 during the dip in profits and dividends, and the CEO switch.
- The second was in 2017-8 when Amazon’s launch in Australia threatened all traditional retailers.
- The third was in 2022-3 after the Covid lockdowns and the aggressive interest rate hikes to attack inflation.
Rolling 10-year
The heavy black line in the lower section of the main price chart shows rolling ten-year performance relative to the market. This is my main test of a company’s share price for long term investors.
I can handle short-term and medium term under-performance, but I want to see it beat the market over successive rolling 10 year periods. This is a very tough test that very few companies pass, as it requires a company’s out-performance to continue despite changes in CEO, chair, and changes in market conditions, competition, etc.
(The black rolling 10-year line starts ten years after IPO, but clearly the share price beat the market handsomely during the first 10 years as well).
Here we can see that the black 10-year out-performance line has never been negative, which is a rare feat for any company.
Since IPO, the median rolling 10-year out-performance has been 9.0% pa. That is extraordinary out-performance.
The worst rolling 10-year performance was zero in the middle of 2019, but has been positive at all other times.
Over the most recent 10 years to today, the share price has beaten the market by an average of 9% pa. Even before the price surge since October 2023, its rolling 10-year performance was still a healthy 5% pa above the market.
Given that incredible share price performance, you would think it would be priced like a hot growth stock – but it isn’t.
Pricing – cheap or expensive?
The wide chart below the main chart shows pricing relative to the overall market – on two measures: price/earnings ratios (blue), and dividend yields (green).
For the first seven years as a listed company, JB was priced at very expensive levels (p/e ratio higher than the market, and dividend yield lower than the market). This was natural for a small company with rapidly growing revenues, profits, and dividends.
IPO shareholders (I was not one - see below) were rewarded with a 15-fold increase in the share price in those early years.
However, during the next nine years from 2011 to 2020 (Covid), the company traded on p/e ratios and dividend yields that were more or less the same as the overall market – ie the market lost faith in JB’s ability to keep growing profits and dividends at rates better than the overall market.
The market was wrong – as we see in a moment. In the middle of this period, JB was cheaper than the market in 2012-3, during the dip in profits and dividends, and the CEO switch.
Then Covid hit in 2020. The lockdowns changed everything – especially for bricks-and-mortar retailers like JB.
Consequently, since 2020, JB has been trading on p/e ratios significantly lower than the market, and on dividend yields significantly higher than the market – ie much cheaper than the broad market on both pricing measures.
The market is therefore saying that JB and other retailers are locked into an unstoppable, long-term, structural decline – presumably driven by Amazon and A.I.
Fundamentals
We started by looking at the share price because that is what most investors, and media commentators do. However, for serious investors, the share price is the last thing to look at.
The starting point is the company’s fundamentals.
Surrounding the main charts are my usual set of charts on the comany's numbers, which are the starting point for fundamental analysis.
We can see that Revenues, Profits, Earnings per share, and Dividends per shares are all still growing relatively strongly, albeit at growth rates lower than the early years.
The two stand-outs are: Profit Margins and Returns on Equity. Both have remained remarkably strong for high-volume bricks-and-mortar retailers, especially since Covid. Profit margins have even increased further since Covid, and return on equity remains above 30%.
JB has probably the highest profitability per square meter of floor space of any retailer in the world. Retailers come from all over the globe to see JB in action. There is no secret IP (intellectual property) or magic ingredient. It is there for all competitors to observe and copy – but nobody has been able to get close.
Their secret is not scale – JB started off very small and have not changed their formula now they are large.
Leverage (total liabilities to total assets) has remained around 50-60% since the early years.
(For an initial snapshot I just use total liabilities to total assets to start with. In practice, in the vast majority of cases, what a company claims to be total assets on their balance sheets is usually less than actual assets of value. Likewise, what a company admits to as liabilities usually understates their actual liabilities. Closer examination is always required. Here we just start with the headline assets and liabilities in the published balance sheets).
JB's headline leverage ratios are rather high for a low margin industry like retailing, but very manageable given JB’s high ROE, relatively low Capex spend (around 25% of cash flows), and their aversion to big-ticket acquisition-based growth.
JB's IPO – rare exception to the IPO rule
There were three red flags that warned many investors, including me, off the JB float.
The three red flags were: private equity, cash-out, and Macquarie.
When assessing the merits of a float, two of the key questions are: 1) who is selling?, and 2) where is the money going? Is the money raised from new shareholders going into the business, or is it being pocketed by shareholders who are cashing out?
On the first question, if it is a ‘private equity’ firm selling, then a red flag goes up. Private equity firms are notorious for tarting up quick-flip IPOs by cooking the books to make the numbers look good in order to maximise the IPO price and maximise their profits. The usual private equity pattern is to buy struggling companies cheaply, load them up with debt, cut costs, use accounting tricks to accelerate revenues, hide or capitalise expenses, fiddle with inventory numbers, drain reserves, and use a host of other tricks to make the numbers look good for a quick sale to gullible investors.
On the second question – ‘follow the money’. If money raised in the float is going to outgoing shareholders rather than invested in the businesses, it is another red flag. If the company is as good as they say it is, why are they selling out now? They know the company inside out, and they want to get out, so why would I want to buy it from them? Why don't they want to retain their shares to get the upside they are crowing about?
JB Hi-Fi is a rare success story from a float by private equity who sold their entire stake and pocketed all the money raised in the float. The company has been a great success ever since, with only a few minor hiccups along the way, albeit with a very volatile share price.
Pre-IPO
JB had a 25 year history prior to the float, and was profitable.
It was started in 1974 by John Barbuto – the original ‘JB’, as a discount hi-fi retailer in suburban Melbourne. He sold it in 1983 to three locals who built it into to a chain of ten stores in Sydney and Melbourne, with revenues of $150m.
In 2000 they sold out to a private equity firm, Next Capital. Next was founded by Patrick Elliott, who had worked in the private equity division of Macquarie Bank – another red flag! The combination of ‘Macquarie Bank’ and ‘private equity’ would usually be the kiss of death for any deal involving innocent shareholders, but this one was different – for several reasons.
Elliott hired new management in 2000 by bringing in Richard Uechtritz and Terry Smart, financing them into a ‘Management Buy-In’ where they received shares and options.
Uechtritz had previously founded a couple of niche retail start-ups - Rabbit Photo and Smith Kodak Express, with Smart as his offsider. They bought in Richard Murray (an accountant from Deloitte – another red flag) for the float in 2003. This core team has been running JB ever since.
2003 IPO
The float raised $150m at $1.55 per share. Unlike other private equity IPOs, JB was not priced at an outlandish, over-hyped valuation, so the price jumped immediately to $2.20. It had a long history of profit growth and was priced on a reasonable price/earnings ratio of 18 and a healthy dividend yield of 4.6%.
Next Capital cashed out for a tidy profit. The company didn’t need the cash – it was already profitable, it didn’t have massive debts it needed to pay down, and it didn’t have grand plans for aggressive acquisitions or global domination.
The float had to be conservatively priced because it was a tiny retailer taking on incumbent star retailer of the 1990s: Gerry Harvey’s Harvey Norman. More about Harvey Norman later. The market also had fresh memories of two recent troubled floats of music retailers Chaos and Sanity music.
Key people
One key to JB’s success has been the fact that the three original managers have led the company since the float. Uechtritz was CEO from 2000, and he handed over to Smart in 2010, who handed over to Murray in 2014.
Both Uechtritz and Smart remained on the board ever since as non-executive directors after their turn as CEO. This is most unusual, but has worked to ensure continuity of the vision, culture, and strategy. In April 2021, Murray suddenly jumped ship from JB to Solly Lew’s Premier, and Smart returned as CEO.
The company has also had a very stable and motivated board. Not only have the former CEOs remained on the board, the position of chairman has also been stable – first with Elliott, then Greg Richards (stockbroker) from 2012, and Stephen Goddard (great experience running Officeworks) since 2020.
(Officeworks and JB were two of the biggest winners from the 'work-from-home' revolution, as people rushed to build home-offices with office furniture and equipment).
Agile, not myopic
JB management were also insightful and nimble. Having come from retail photo labs, they knew how quickly an industry could change and die.
They have succeeded against Amazon onslaught, and during the 2020 covid lockdown crisis they were very quick to ramp up JB’s online presence for the home-office boom.
Steady growth, not the usual mad rush overseas
Another key to JB’s success has been that it has favoured steady internal growth rather than aggressive acquisitions. The primary strategy has been internal growth, focusing on low prices, high volume, high stock turn, low operating costs, and empowering store managers to negotiate to match competitors to win sales.
There has been only one large acquisition –‘The Good Guys’ in 2016 for $870m. This was a major move into home appliances and it immediately leapfrogged JB ahead of the aging Harvey Norman in market share.
Aside from a relatively small acquisition in NZ in 2006, they have also avoided the temptation to venture further afield overseas, which has been the perennial graveyard for Australian companies with grand visions of global empires.
The future?
There are challenges ahead. Being limited to Australia/NZ JB needs to grow by venturing into new countries and/or new segments. It has been smart to avoid the former, and it did the latter successfully with the move into home appliances with The Good Guys acquisition.
Aside from internal management decisions in fighting off competition, the main external driver of growth is domestic population growth (Australia and NZ) which, fortunately, have been among the highest in the world, and likely to continue into the future.
Even at $63, the market is assuming JB’s above-market revenue growth, margins, and returns on equity will all decline back to market averages at best – ie the magic has gone and JB is destined for the dustbin of history like other once-great retailers, like Harvey Norman and Myer.
Myer, the retailing former giant, was once Australia’s largest listed company, but is now worth less than one tenth of JB, and barely scrapes into the top 500.
You decide!