Franking credits on dividends on Australian shares can add more than 1% per year to returns for Australian shareholders. But many professionals don’t include the value of franking credits in their clients’ returns – either historical, or forecast.
Ignoring franking credits can distort an investor’s position, prospects, and portfolio planning.
It’s raining dividends
It is dividend season here in Australia, following the August reporting season for June financial year results. Investors will receive more than $20b in dividends this week (half is from just two companies – ore miners BHP and FMG).
It is also tax time in Australia, so it is a good time to highlight the tax benefits franking credits.
The local S&P/ASX200 price index returned a modest 4.6% in the 12 months to the end of August, but the addition of dividends brings the total return to 9.6%, well behind the rest of the ‘developed’ world.
However, franking credits added a further 1.6%, bringing the returns for Australian shareholders to a more respectable 11.3%. (Franking credits on dividends from Australian companies are only available to Australian shareholders).
The Australian share market has for decades had the highest dividend yield of any market in the ‘developed’ world. The reason is not what you may think (it goes way further back than franking), but that’s another story for another day.
Value of franking credits to Australian shareholders
The benefit of franking credits to Australian shareholders have been significant.
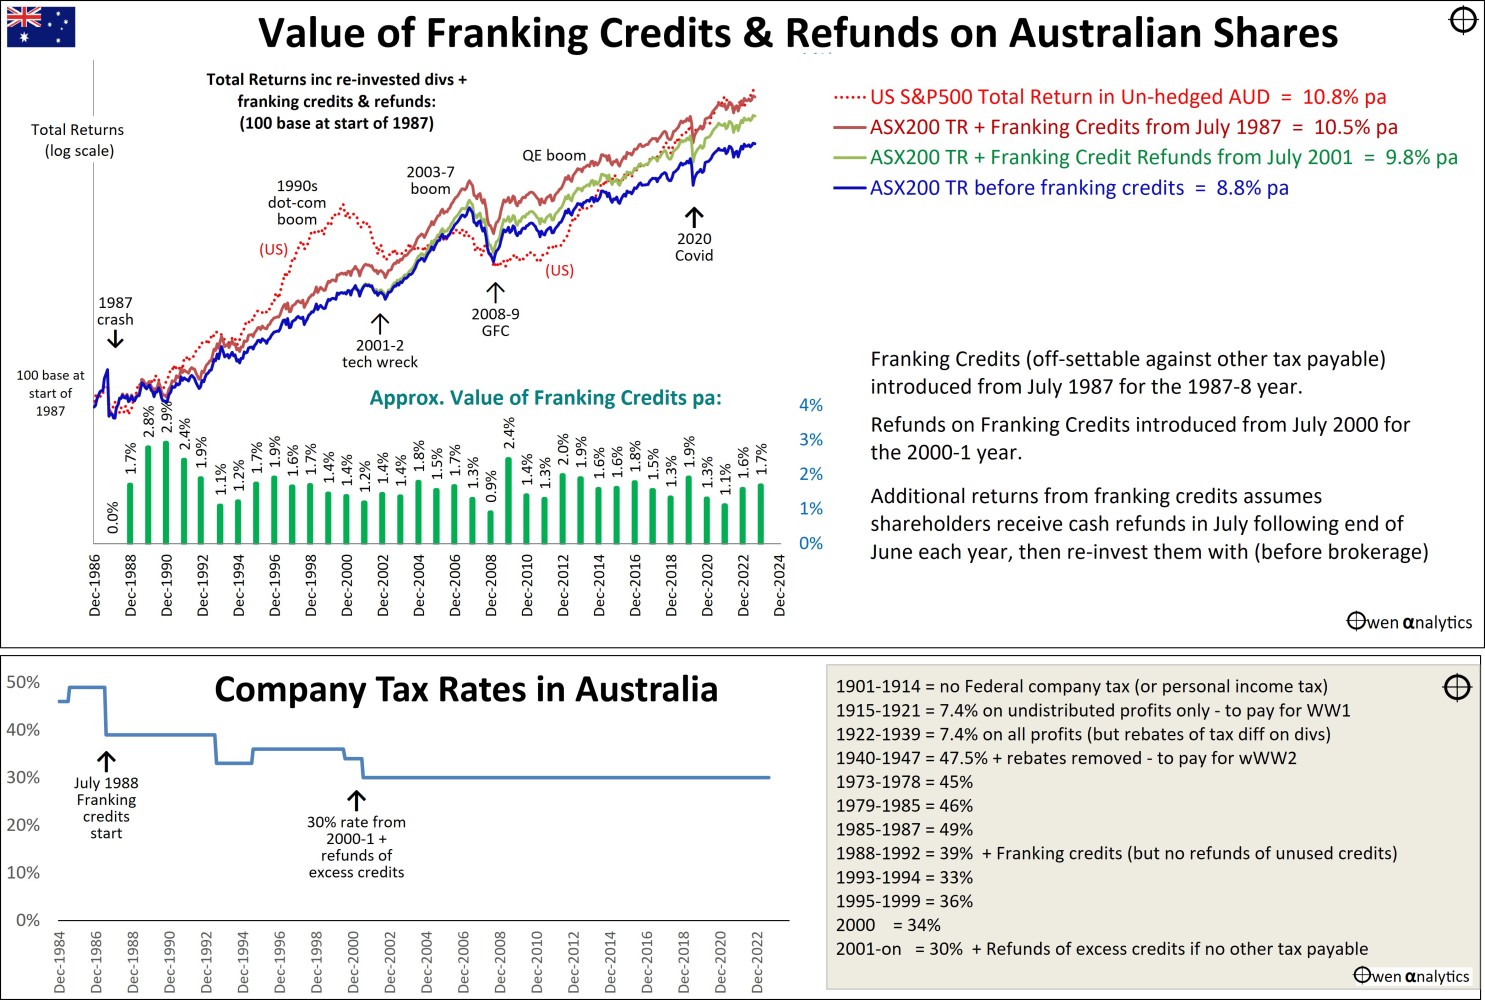
The chart below shows the total cumulative returns for the S&P/ASX200 index since the start of the franking credit system in July 1987.
- The blue line shows total returns including cash dividends plus share prices gains/losses, but before the benefit of any franking credits or refunds. Foreign holders of Australian shares get this return (less fees, etc).
- The green line includes the benefits for non-tax paying shareholders that have claimed refunds of excess credits since 2001, This has added around 1% pa to returns from the broad market. Being non-taxpayers, they were not able to benefit from franking credits before 2001.
- The red line shows the returns for tax-paying shareholders who claimed franking credits to reduce tax on their other income since 1987/8, plus refunds of unused credits since 2001.
This has boosted returns by an average of 1.6% pa over since 1987. Foreigners don’t get this benefit, only Australian shareholders.
It’s a free kick for Australian investors, and partly explains the heavy ‘home bias’ locals have toward Aussie shares.
value of franking credits on Australian shares - since 1987 chart #frankingcredits #australianshares #dividends #shares
Corporate tax rates have declined
The value of franking credits has varied over time. The tax benefit has trended down since the 1980s as corporate tax rates have reduced – from 39% to 30%
(We cover the history of corporate tax rates below, as it affects our forecast returns).
Dividend payout rates have risen
Partially offsetting this decline in corporate tax rates has been the fact that dividend payout rates across the ASX market have risen from 60% to near 80% over the period.
This increases dividends (in the short term anyway), and also increases the benefit of franking credits.
The value of franking credits also declines in low dividend years, like 2020 and 2021 in the wake of the 2020 Covid recession, when aggregate profits and dividends suffered big cuts. These were restored in 2022 and 2023.
But still lags the US market
For context, I have also added the total returns from the broad US market (S&P500 index) in un-hedged Australian dollars over the same period.
This shows that, even if we include full claiming and full re-investment of all franking credits since 1987/8, the Australian market has still lagged the US market by more than half of a percent per year over the whole period.
This is a significant difference, but this margin will disappear when the current US tech/AI boom deflates.
What is franking anyway?
Australian shareholders who receive dividends from Australian companies also receive a tax credit for the corporate income tax that has already been paid by the company that paid the dividend.
This prevents the company’s profits from being ‘taxed twice’ in Australia – first in the hands of the company, and second in the hands of the shareholder receiving dividends from the same profits.
How it evolved – not what most people think
Most people think the Hawke/Keating government invented company tax credits against personal income taxes when they introduced the ‘dividend imputation’ system from July 1987, but it goes back a lot further than that.
At Federation of the States to form the Commonwealth in 1901, Australia started out with no income taxes (corporate or personal) – and, more importantly, no Canberra!
The solution, therefore, is simple: no Canberra – no taxes!
WW1 taxes
Alas, this nirvana was not to last. A wee thing called World War One came along.
In 1915, to pay for the War effort, the Federal government (which sat in Melbourne before shifting to Canberra in 1927), introduced personal income taxes (with a top marginal rate of 25%), and also introduced a corporate tax rate of 7.4%.
This 7.4% tax was only paid on the portion of company profits that were not distributed to shareholders as dividends. Profits distributed as dividends were not taxed in the company’s hands, but the dividends were taxed in the hands of the taxpayer.
So, company dividends were only taxed once - in the hands of shareholders. No double taxation of dividends.
In 1922, the 7.4% corporate tax rate was extended to the entire company profit, but to prevent double taxation, shareholders receiving dividends also received a rebate for the corporate tax already paid, against their personal tax payable.
Still no double taxation of company profits, and this lasted until 1939, when another World War came along.
WW2 taxes
To pay for the Second World War, the dividend tax rebate was removed from 1940 to 1947, and the corporate tax rate was jacked up from 7.4% to 47.5%. Ouch!
From 1973, the corporate tax rate was cut to 45%, but then raised to 46% from 1979, then raised again to 49% from 1985 – by the Hawke/Keating government.
Then finally, from July 1987 for the 1987-8 year, they cut the corporate tax rate to 39% and brought back tax credits for shareholders for the company tax already paid on their dividends.
This once again removed the double taxation of dividends, restoring the position prior to 1940, when dividends were only taxed once. The Hawke/Keating credits were only available to reduce other income tax payable – you could not get a cash refund of any unused franking credits, so the system was no value to dividend recipients who paid no tax.
The Howard/Costello government went further in 2001 when they introduced cash refunds of any excess franking credits where shareholders had no other income tax they could offset. This extended the benefit to people who were not paying tax – mainly retirees and charities.
Including the value of franking credits in historical returns
Many advisers don’t include the value of franking credits in clients’ performance returns, which distorts their true returns. Perhaps the reason is that franking credits do not appear on broker statement or ‘platform’ reports.
Ignoring franking credits materially under-states historical returns.
Forecasting returns
More concerning is that many advisers also ignore the value of franking credits when forecasting returns. This can materially distort the portfolio planning process.
When I ask why, the usual answer is that franking credits are hard to forecast. Maybe, but they are no harder to forecast than price returns or dividends, which you need to do to forecast portfolio returns to achieve long-term financial goals.
Another reason given is that it is hard to track actual returns against a plan when the client statements and platform reports don’t include franking.
A further reason is that franking credits are really a tax issue, just like deductible expenses, which are different for each client, and dealt with separately by their accountant.
Often they say - 'We don't really know if the investor reinvested the franking credit refund, so we assume they didn't'. But that same logic applies to dividends as well, but you include dividends in returns!
You forecast franking credits for Hybrids, why not for shares?
Everybody – investors, advisers, issuers, regulators, brokers, media, etc – always forecast the value of franking credits in ‘hybrids’ by automatically including future franking credits in the return.
It would be ludicrous not to because the franking credits are included in the pricing and are an essential component of returns.
Nobody would ever buy a hybrid if it were not for the franking credits.
Nobody ever quotes, refers to, or even knows, the cash return on a hybrid, without the franking credit.
It should be the same for shares because franking credits are just as important and relevant for returns on shares.
Forecast returns need to include franking credits
There are four main factors to consider when estimating the value of franking credits in our return forecasts:
- Average dividend yield. I usually assume a long-term average of 4.0% for the local market, as it has been remarkably consistent over many decades through many different kinds of inflationary conditions. However, the forecast can vary depending on the current market pricing. The current market dividend yield (4.1%) is around the long-term average level, so a 4% average yield is reasonable.
- Future corporate tax rates - currently 30% in Australia, but I generally assume that this will come down over the next 10 years to say 25%, to follow global competition.
- The average level of franking across the market. This has ranged from 70% to 96%, but has averaged around 80% (ie 80% of dividends are from Australian sourced profits on which Australian corporate tax is paid. The rest is foreign sourced profits). There is no current reason this is likely to change substantially in the near future.
The mix of shares in the Australian shares part of the long-term portfolio. Here we have assumed the client holds a broad basket of shares – eg with passive index funds, or a diversified mix of active funds. This could be different of course for other types of portfolios – eg bank shares, speculative miners, etc, so this would change the assumptions.
The value of Franking Credits =
= Div Yield x %Franked x (Corp Tax Rate/(1- Corp Tax Rate))
So, if our long-term return outlooks are:
- forecast average dividend yield = 4% pa
- forecast average level of franking = 80%
- forecast average corporate tax rate = 27.5% (I assume a shift from 30% to 25% during the next 10 years)
then the franking credit/refunds would add 1.2% pa to average returns from the broad Australian share market in the hands of Australian shareholders.
Is this a big deal?
We’re only talking about another 1% in returns – does that really matter?
You bet!
With the impact of compounding over time, 1% higher returns per year compounds into 22% higher wealth and income over 20 years, and 35% higher wealth and income over 30 years.
Will the franking credit system continue?
We also must form a view on whether the system is likely to continue.
Although there is certainly fiscal and political pressure to rein in what many people regard as ‘middle class welfare’ and ‘tax breaks for the rich’, the sheer power of the ‘grey vote’ (and also tax-free charities) is likely to keep the current system in place largely un-touched for a while yet.
We have seen the power of the grey vote over the past year when my old friend Geoff Wilson successfully led a revolt against a proposal to reduce the availability of franking credit refunds to zero tax-paying retirees.
The current Labor government has now gone for a ‘smaller target’ – the tax on unrealized gains on super funds above $3m. That is yet to get up, but who knows what is next.
However, unless we solve:
(1) Australia’s housing problem,
(2) Australia’s productivity problem,
The inter-generational divide and wealth inequality will probably increase pressure for winding back some of the current tax benefits.
But we’ll leave the problems of housing and productivity for another day!
I thank you for your time. Please let me know your thoughts.