It's tax return time in Australia. As we fill in our tax returns and pay our taxes, we often wonder – Am I paying too much tax? Am I paying my 'fair share?' What is a 'fair share,' anyway?
"We're all in this together – all pulling our weight and paying our taxes – aren't we?"
Well, actually - no.
42% of adults in Australia pay NO income tax!
Next time you are in a crowded place - a busy street, train, bus, or sporting event – take a look around. 42% of all adults in Australia pay no income tax! Zero, zilch, nada. 42% are tax-free!
How can this be right? Who is paying for all the government services they use? The hospitals, schools, roads, police, defense, and everything else?
The Income Tax Pyramid
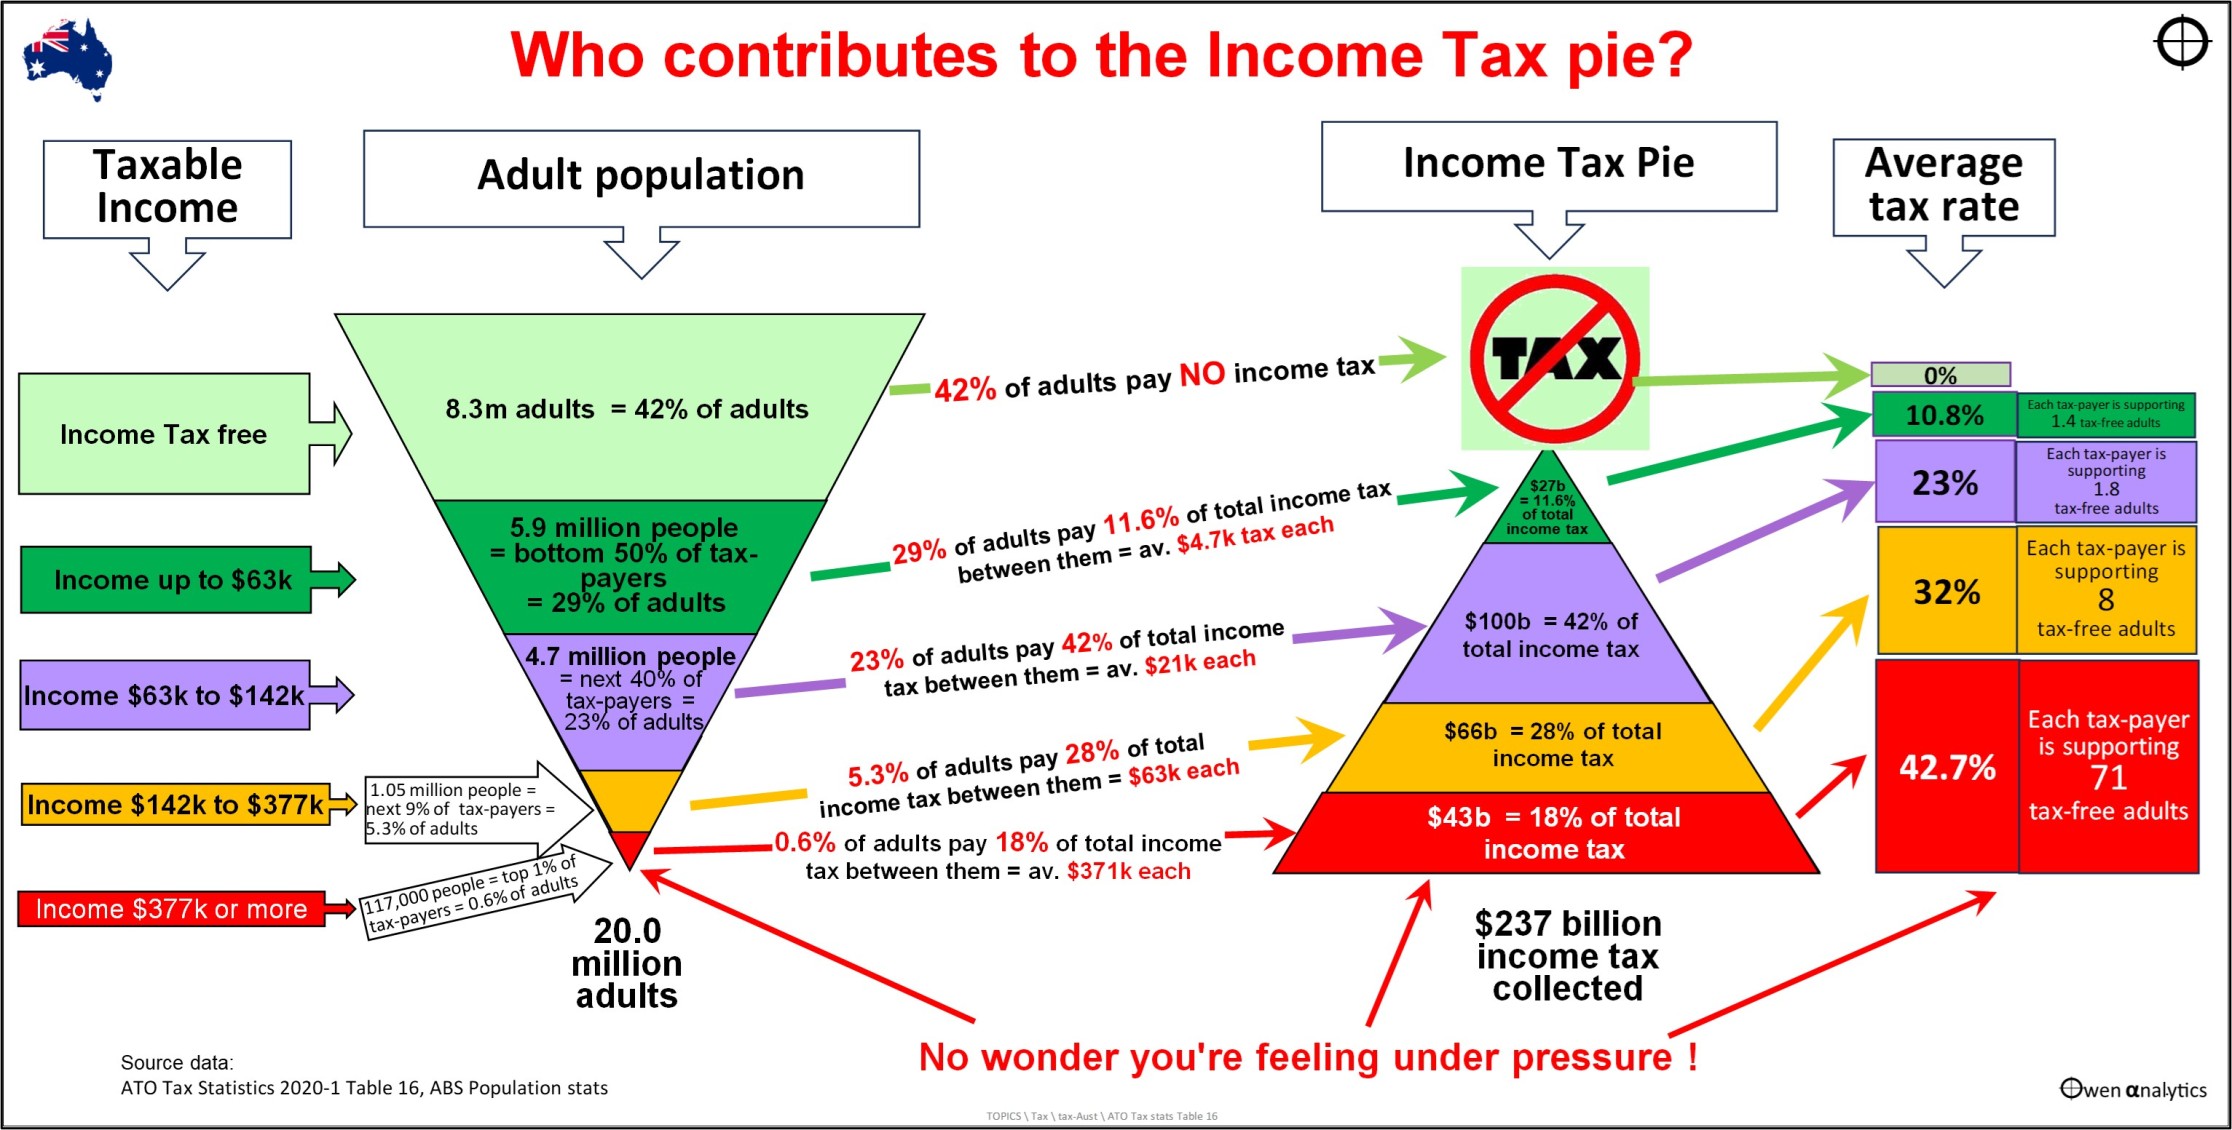
This chart shows two tax pyramids. The left pyramid is inverted – showing who pays the tax. The right pyramid shows the total income tax pie.

Income Tax Pyramid in Australia - who pays tax and how much tax they pay
(These are the latest figures from the ATO. They relate to the 2020-1 tax year, but the breakup of who pays what proportion of tax changes very little from year to year.)
In addition to income taxes, Australians do pay other types of taxes, like GST on around half of all retail purchases, and corporate taxes, but Australia ranks top of the table of global peers (second only to Denmark) on our reliance on personal income taxes for our overall tax revenue.
"The super-rich can afford it!"
The top 1% of taxpayers in Australia contribute 18% of all income tax, and for each of these taxpayers, there are 71 adults paying no income tax at all.
Nearly half of all income tax is paid by just 10% of adults.
People may say: 'That's ok – they are the super-rich! They can afford it! That's their job to support the rest of us!'
The problem is that the top 10% of taxpayers who pay half of all income tax are NOT the 'super-rich.' It is just those earning a rather modest $142k or more. For each one of these taxpayers, there are seven adults paying no income tax.
This may be rather distressing for people earning say $150k. Sure, they are doing their bit by supporting those less fortunate with their taxes, but seven tax-free adults per taxpayer? That sounds like more than just the poor and unfortunate!
Top 1% of taxpayers pay 18% of all tax ('Execs & professionals')
Starting from the bottom (in red) - 117,000 taxpayers (the top 1% of taxpayers), contributed a combined $43 billion, or 18% of total income tax collected. These 117,000 taxpayers are those earning more than $377k each, and they paid an average of $371k each in income tax. These are mainly CEOs and execs of big companies, and professionals (mainly in medical and finance industries).
These 117,000 people were the top 1% of taxpayers, but they are only 0.6% of total adults. The ATO naturally measures and reports on the number of taxpayers (11.7 million), but they ignore the fact that there are 20.0 million adults in Australia (here we define an 'adult' as being 18 years or older).
Next 9% of taxpayers ('middle managers') pay 28% of all tax
One step up from the bottom of the pyramid are the next 9% of top taxpayers (orange) – 1.05 million people earning between $142k and $377k (the 'middle managers' and mid-sized business owners). These 9% of taxpayers make up 5.3% of adults and they paid an average of $63k each, for a total of $66b, or 28% of tax collected.
Next 40% of taxpayers ('middle class') pay 28% of all tax
The next 40% of taxpayers (purple) – 4.7 million people earning between $63k and $142k. We'll call these the 'middle class'. These 40% of taxpayers make up 23% of adults and they paid an average of $21k each, for a total of $100b, or 42% of total income tax collected.
The 'workers' pay 12% of all tax
Finally, we have the bottom 50% of taxpayers (dark green) – 5.9 million people earning up to $63k. These are the 'workers.' These 50% of taxpayers make up 29% of adults and they paid an average of $4.7k each, for a total of $27b, or 11.6% of total tax.
The 'tax-free' 8.3 million
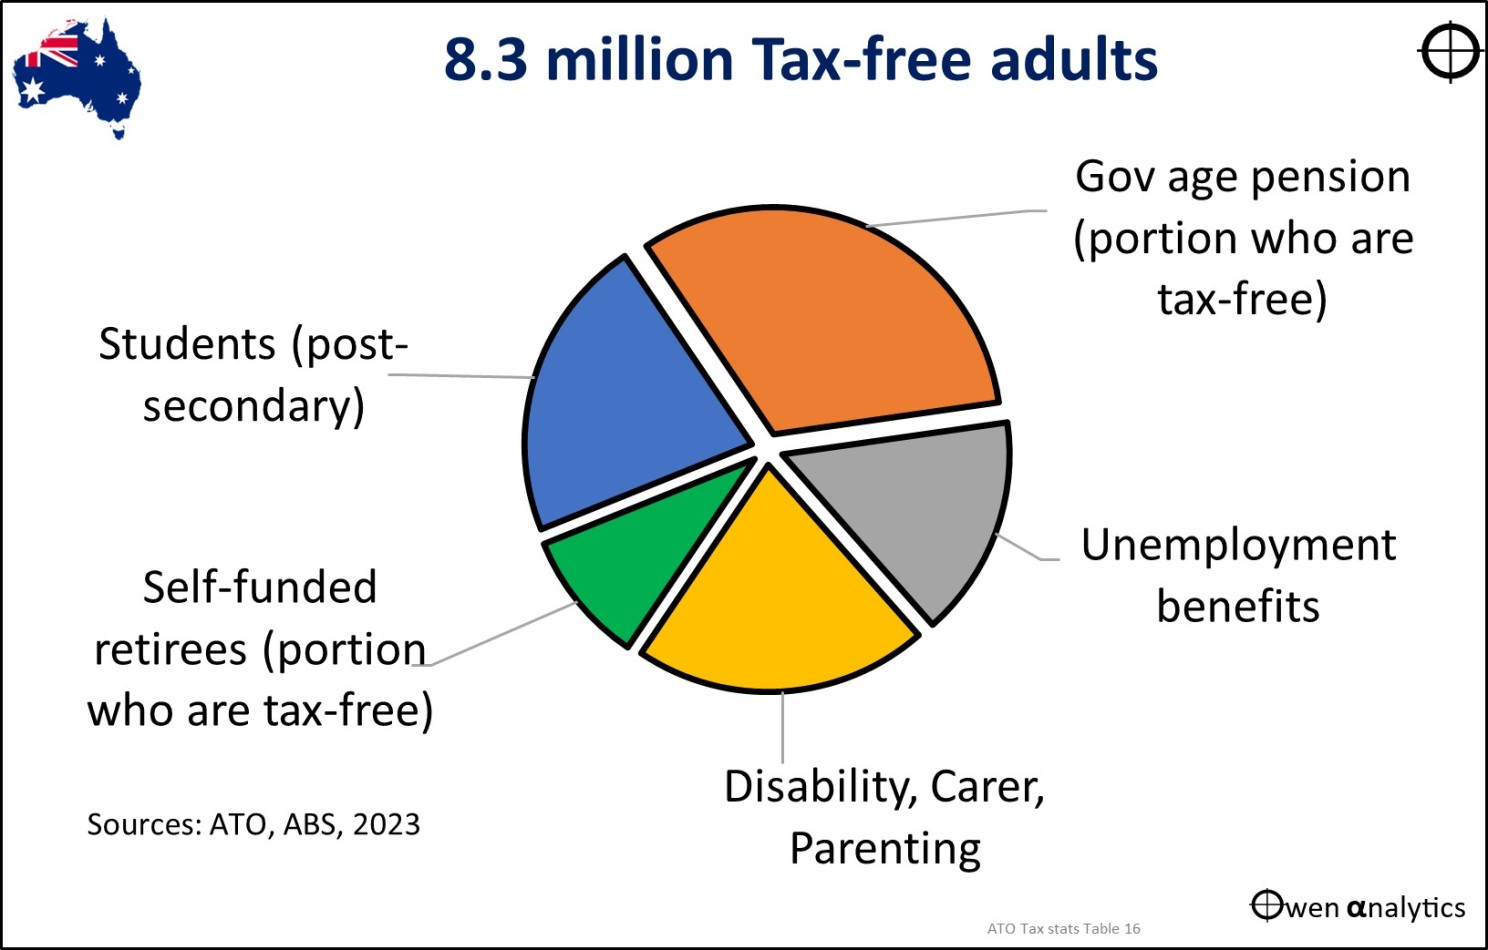
At the top of the pyramid, we have the 8.3 million adults who paid no tax. Who are they?

Two-thirds of them (5.4 million people) are on government support. Of these, 3.4 million are on support payments other than the age pension. This is mainly people on unemployment, disability, carer, and parenting payments.
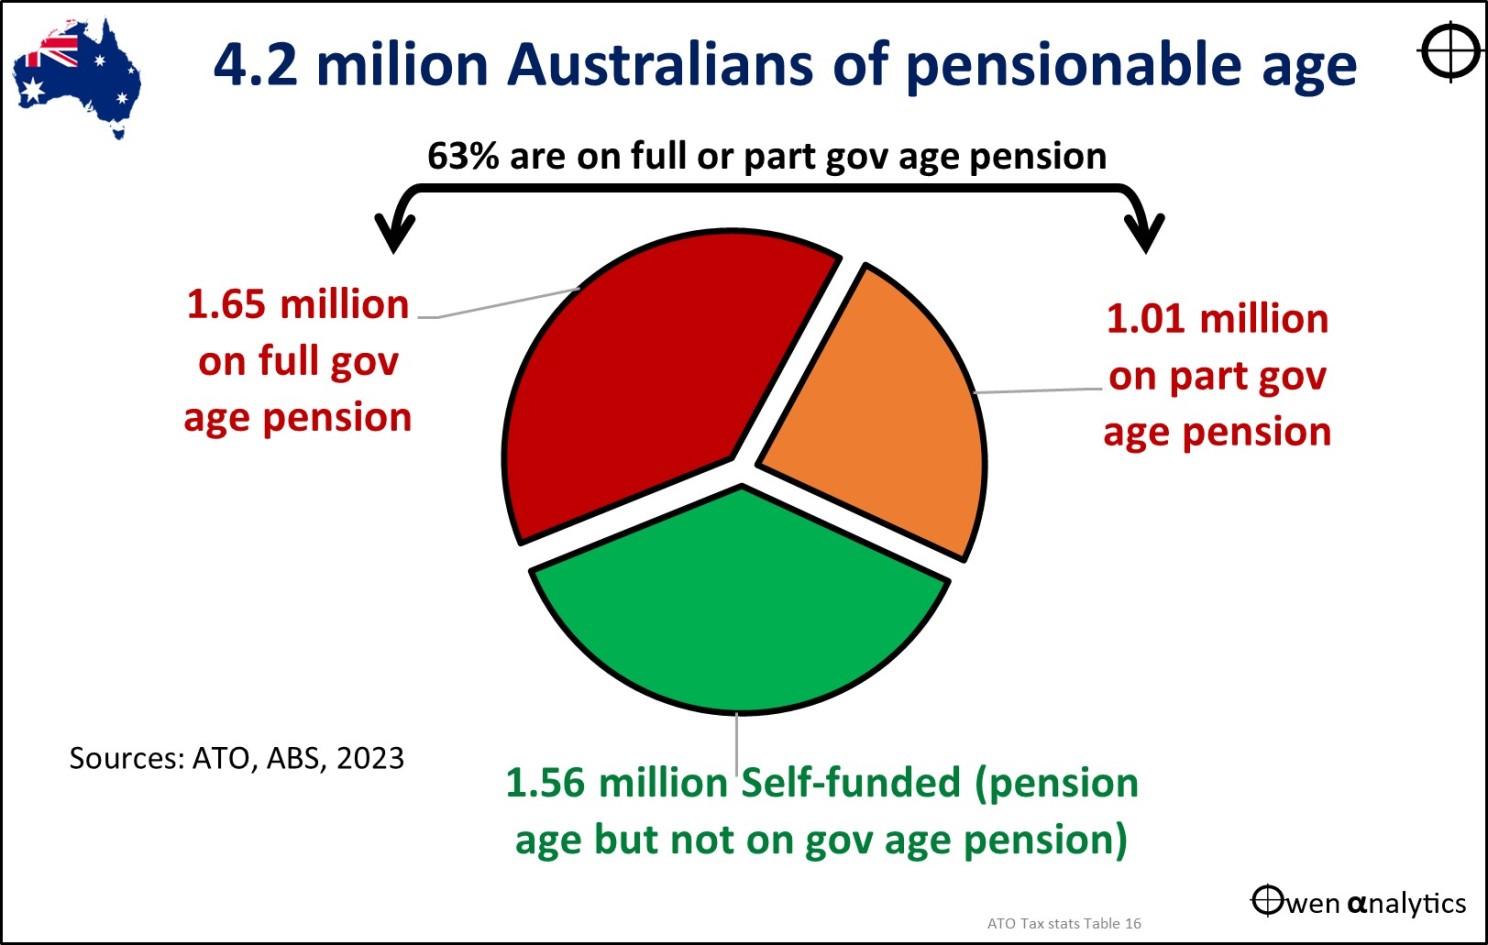
There are 2.7 million retirees on government age pensions. 1.7 million are on the full age pension (being below the assets and income means tests), and 1.0 million are on part pensions. We will assume that the 1.7 million on the full pension, plus the 3.4 million people on other support payments, are paying no tax, as various tax offsets (mainly SAPTO, LITO, and the 'work bonus') lift the effective tax-free threshold to well above the official $18.2k level where the first tax bracket starts.
However, for the 1.0 million retirees on part age pensions, not all are tax-free. Around one-quarter of them pay some income tax, as pensioners can earn up to $60k (singles) or $92k (couples) and still receive a part pension.
Of the 4.2 million people of pensionable age in Australia, 37% (1.5 million) are 'self-funded', i.e., they don't receive the full or part age pension. Perhaps up to half of these 'self-funded' retirees, or around 800,000, would be tax-free. The rest would be paying tax on income over and above their tax-free withdrawals from their super funds in tax-free pension phase.

- There are also 1.8 million post-secondary students (in University, TAFE, and vocational colleges), and we can probably assume they would all, or almost all, be below the income tax-free thresholds.
- That leaves around 300,000 other 'tax-free' adults. These include the working poor, struggling to make ends meet, and the idle rich, living off family income and trusts.
Without intending here to enter the social or equity debates about income and tax distribution, the Income Tax Pyramid does highlight some initial observations.
Average tax rates for most people appear too high
One observation is the rather high 'average' tax rates paid by workers on modest incomes. The boxes to the right of the main chart show the average tax rates paid by each level. (The 'average' tax paid per dollar of income is different from the 'marginal' tax rate paid on each additional dollar of income).
The 'middle class' (purple) pay 23% average tax on every dollar of income, and the 'middle managers' (yellow) pay 32% average tax. These appear very high.
So too are the average tax rates paid by the top 1% (red), and also the 'workers' (green), but to a lesser extent.
These rather high average tax rates are mainly the result of 'bracket creep' over many years, but correcting this (e.g., with the 'Stage 3' tax cuts on the table), is politically difficult, as it appears to favor the 'rich.'
The tax-free 42% of adults
A second observation is the sheer size of the 42% of the adult population who pay no income tax at all. Here we are not questioning the idea of supporting people in genuine need, but it is hard to imagine how nearly half of all adults need to be supported by the other half.
The problem is not demographics – Australia has the youngest population (lowest median age) in the 'rich nations' club. We have a relatively young, productive population, with relatively high immigration that targets productive workers. The problem is tax structure.
Living standards, productivity, and taxes
Australians have enjoyed the highest per capita living standards, incomes, and wealth in the world on several measures since the 1890s, and this is still the case today. The problem is that growth in productivity and living standards have stalled.
In August the federal government released its latest Intergenerational Report. It paints a very depressing picture for the next forty years in Australia:
- virtually nil productivity growth (i.e., stalling living standards),
- low overall economic growth,
- an older/sicker population,
- where the costs of aged/sickness care rise at much higher rates than revenues.
- All paid for by even higher taxes on a diminishing proportion of workers, and rising debts paid for by future workers/taxpayers.
The solution requires economic reforms on several fronts, including tax reform. Reducing taxes on income from productive work, and shifting more to taxes on spending, to reduce disincentives to increase income and productive endeavor, and to encourage savings to fund investment in productivity-boosting technologies and processes.
Probably part of the reforms will also involve future governments scaling back tax breaks on superannuation, and even scaling back the unlimited exclusion of the family home from the pension assets tests.
"But I paid taxes all my working life!"
Reactions to the idea of tax reform span a very wide spectrum of views. At one extreme is the idea that: 'I've paid tax all my working life, so I'm entitled to tax-free income (or tax-free pension) for the rest of my life - even if I live past 100!'
That argument only works if governments run surpluses every year, so that current taxes can be banked to fund future spending.
If governments merely run balanced budgets, or worse still, deficits, then current spending is funded by current tax revenue (and increasing debts), and future spending has to come from future taxes.
In other words, taxes paid in the past just paid for past services. If you want to get future services from the government, like hospitals, defense, etc., then they must be funded by future taxes. There is no magical free lunch in the future just because you paid taxes in the past.
"We are a rich country - let's share it around!"
At the other extreme, we have the idea that we are a rich country, so we should share the wealth around, e.g.:
'From each according to his ability, to each according to his needs'.
That, of course, is a direct quote from Karl Marx in 1875, and it was the underlying principle of Communism.
Thirty-six countries tried that idea, and they all ended in poverty and corruption. Without incentives to increase productive work and income at a personal level, aggregate incomes and wealth stagnate, and much of the little revenue that is generated is siphoned off by the elites and/or redirected into uneconomic, political pet projects.
The very few remaining 'communist' regimes that did manage to grow themselves out of poverty, did so only after they abandoned communism in everything but name, and adopted free-market capitalism (e.g., China, Vietnam).
Between those two extremes is where the policy debates and politics begin!
But, as it stands at present, it is a rather alarming picture, as we dutifully lodge our tax returns.
Thank you for your time. Please let me know your thoughts!