Property construction has been the largest component of China’s incredible economic growth this century, and also the largest contributor to Australia’s export revenues, government tax receipts, corporate profits, and national wealth.
The Chinese property sector has collapsed, the population is aging and declining, the economy is slowing, and Xi Jinping is reluctant to hit the stimulus button, but Aussie exports are booming! Why? Can it continue?
China’s Growth and Australia’s Windfall
Since 2000, one billion Chinese people (two-thirds of China’s 1.4 billion population) have been ‘urbanized’ – shifted from farms, villages, and obsolete factory towns into hundreds of newly built cities. It has been the largest mass migration in human history, and the greatest increase in aggregate wealth and living standards.
The construction of these new cities – including all of the residential apartments, factories, warehouses, offices, shopping centers, restaurants, hotels, schools, hospitals, train stations, airports, government buildings, etc – has also been the main driver of global commodities demand, and it has been the largest contributor to Australia’s prosperity.
31 Billion Square Meters of Floorspace Built
Since the start of this century, China has built the equivalent of a total of 31 billion square meters of floor space (in apartment blocks, offices, schools, factories, etc). How much is that?
If laid out flat, it would be half the land area of Tasmania, or a little larger than Belgium, or almost as large as Taiwan.
For most of the post-GFC era, Chinese construction has run at about 2.3 billion square meters of floor space per year, or about 200 million square meters per month.
These numbers are so large they are difficult to visualize, so I have come up with a more meaningful unit of measurement of building floor space – a ‘Sydney CBD’.
One ‘Sydney CBD’ of Floor Space = 20 Million Square Meters
Sydney’s ‘Central Business District' - from Circular Quay in the north to Central Station in the South, from Darling Harbour in the west to Hyde Park in the east - contains about 20 million square meters of building floor space. This includes every floor in all of the office blocks, apartment blocks, hotels, shops, restaurants, hospitals, car parks, etc.
It took us 230 years to build our Sydney CBD of 20 million square meters of floorspace. China does the same in just three days!
China’s construction rate of 200 million square meters of floor space per month equals ten Sydney CBDs worth of buildings per month, or one Sydney CBD every 3 days.
Our first chart shows Chinese construction since 2001, which is when China joined the World Trade Organization, kick-starting the urbanization and industrialization booms. In the upper section, the blue line shows monthly construction, and the red line shows the 12-month average rate, in millions of square meters per month.
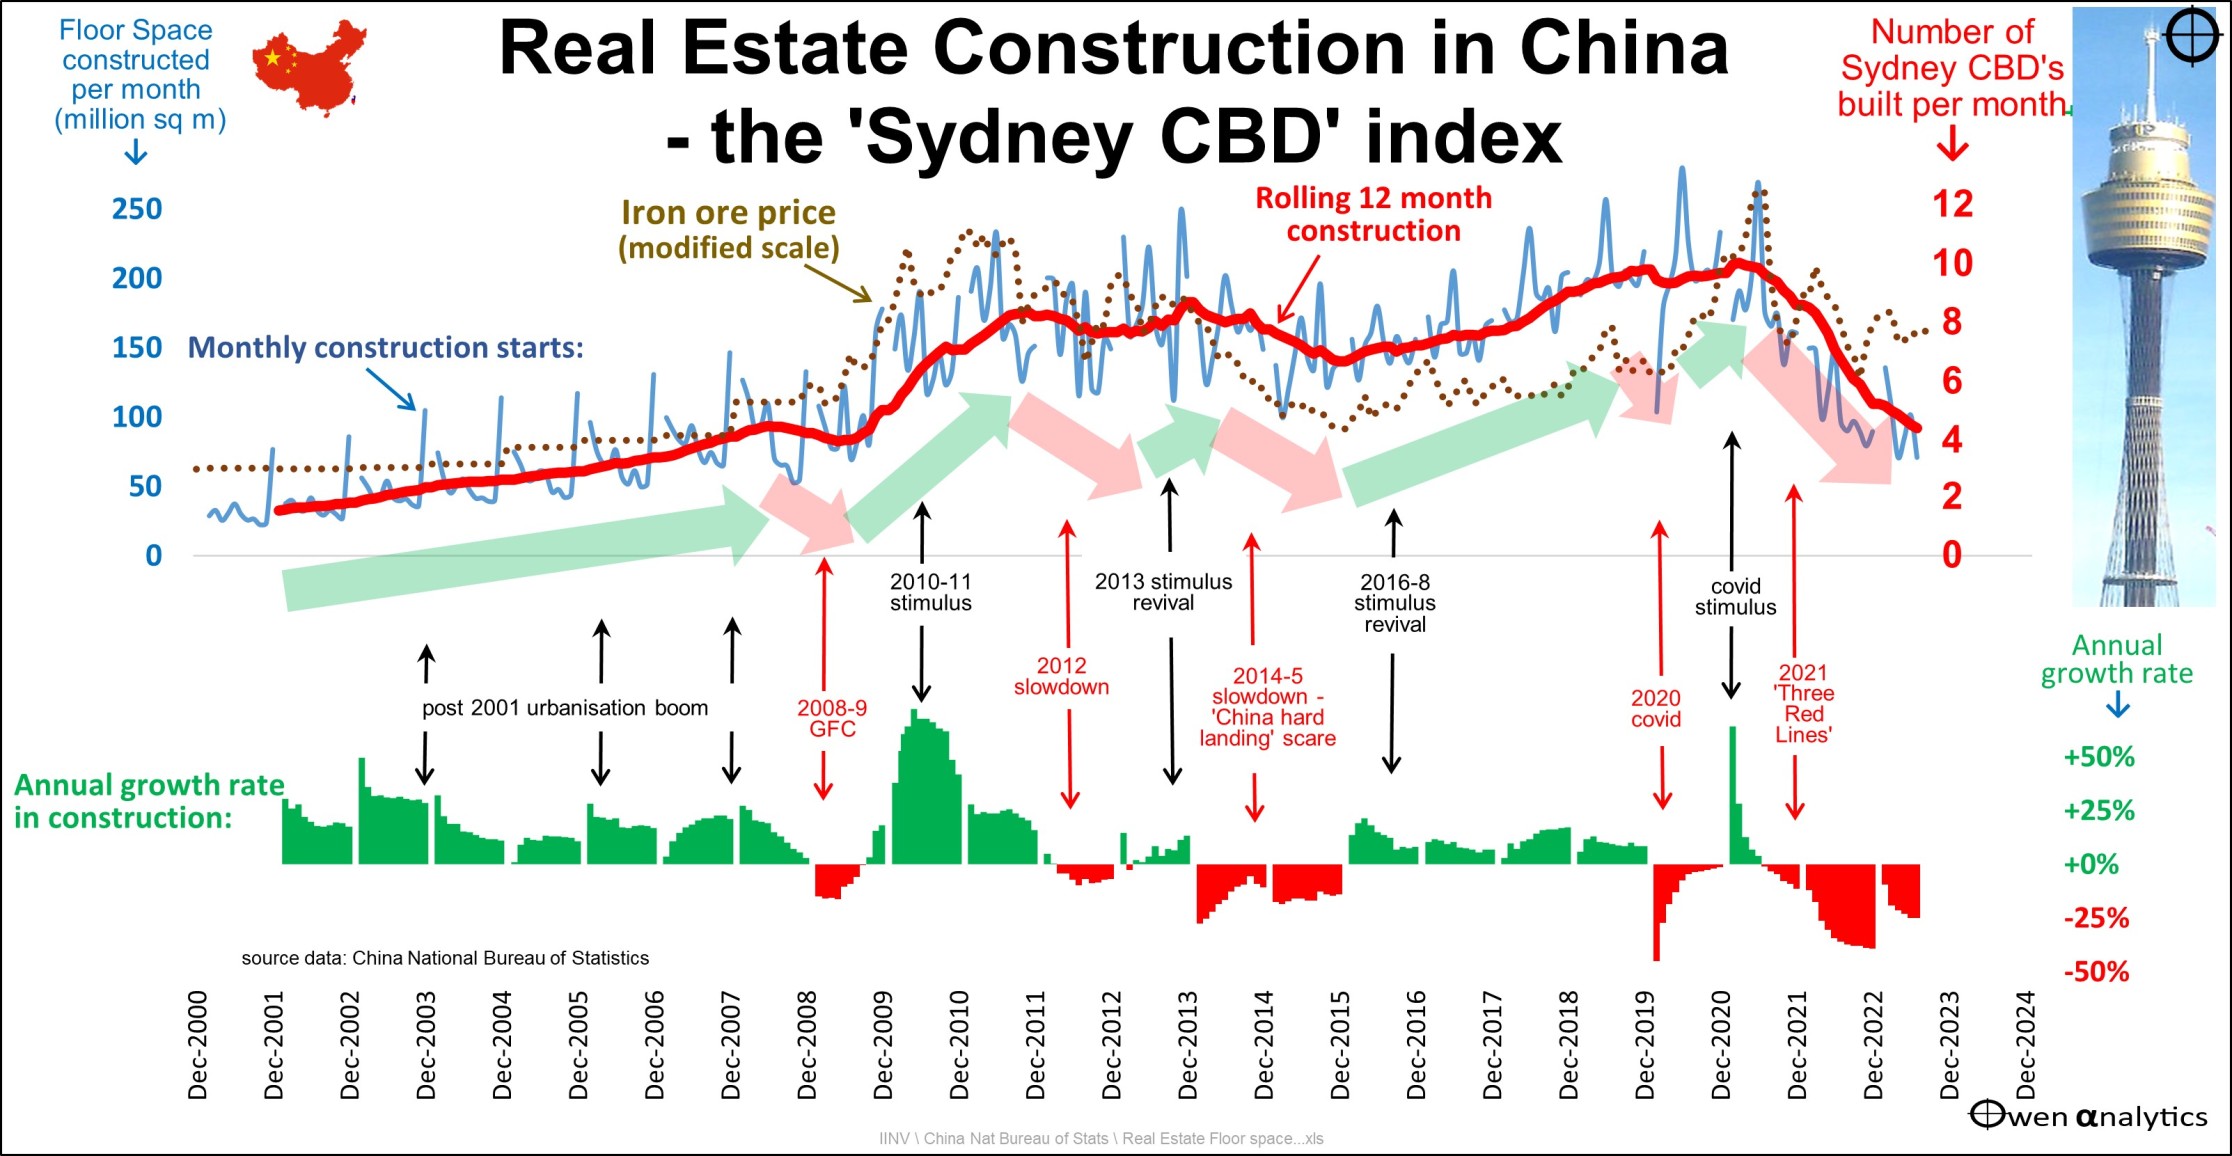
Real estate construction in China - the Sydney CBD index
The red scale to the right shows construction rising from one ‘Sydney CBD’ per month at the start of the century to more than ten ‘Sydney CBDs’ per month at its peak in 2020.
The rate of building activity increasing over time, but there have been several cyclical slowdowns and stimulus re-boots along the way, highlighted by changes in the rates of growth in construction in the lower section of the chart.
Iron Ore Prices Follow Construction Activity
The chart also shows iron ore prices (brown dots) closely following the ups and downs in construction activity.
The main exception to this pattern was the iron ore price spike in 2019-20 after the Vale mine disaster in Brazil, and then COVID lockdowns took Brazil out of the iron ore market. Australia overtook Brazil as the world’s top iron ore exporter, and China’s largest supplier.
It is the same with coal. Australia overtook South Africa as the world’s largest coal exporter after the COVID lockdowns crippled South Africa’s coal production and exports.
Recent Iron Ore Spike Too Optimistic?
To the right of the chart, we can see that the iron ore prices have received a boost this year and are now well above the construction line. The price rise is anticipation of a major stimulus re-boot, but the announcements thus far have been very minor, and nothing like the major boosts in the GFC and in 2016.
As Chinese construction cycles are the biggest driver of commodities prices, export revenues, mining company profits, and dividends, two key questions for investors include:
- Where are we now in the current cycle?
- Can Chinese construction and demand for our rocks continue on its upward march forever, or will it slow?
Where Are We Now?
To the right of the above chart, we see that China’s property construction has slowed sharply from more than ten ‘Sydney CBDs’ per month in 2018, 2019, and 2020 to less than five in 2023.
The problems started with the CCP’s ‘Three Red Lines’ rules introduced in 2021 to curb property leverage and speculation. It was also trying to reduce prices for lower wage earners as part of Xi’s ‘common prosperity’ plan.
It backfired badly and triggered a debt/default crisis with property development companies, a slump in new construction, a mortgage boycott by millions of buyers of uncompleted units, collapses in property lending, and consumer/buyer confidence, housing prices, and losses on retail investments in high-yielding unit trusts (‘wealth management products’) that on-lend to property developers.
This slump is far deeper and longer-lasting than previous cyclical slowdowns, which were all kick-started quickly with fresh stimulus boosts each time. Throughout the post-Deng era, the CCP’s number one ‘to-go’ lever to increase output and jobs has been to boost construction. Not this time.
One reason is politics - Xi has a philosophical aversion to capitalist billionaire property developers, and he is reluctant to bail them out. But there are larger issues.
Aging and Declining Population
The first problem is the fact that the population is aging rapidly, largely due to Deng’s ‘one-child policy’ from 1979. The policy was abandoned in 2016, but it has not halted the trend, nor is it likely to. Throughout human history, there has been a persistent trend for birth rates to decline as societies urbanize and increase in wealth. Subsistence farmers need children to work the farm. City dwellers in cramped concrete boxes don’t.
China’s population peaked in 2022 and is now starting to decline.
Urbanization Rate Will Probably Slow
Despite stalling and now declining overall population, it is urbanization, not population growth, that drives construction. There is probably still some gas in the tank on urbanization.
One billion people have been urbanized, and 1,800 ‘Sydney CBDs’ of buildings have been built to move them to new cities. This was a one-off migration that is not repeatable at the same scale or speed.
The next chart shows China’s urban population (blue bars), rural population (green bars), and cumulative urbanization rate (red line). The lower section shows the annual growth rate in urban population. This is what drives construction and Australia’s mineral exports.
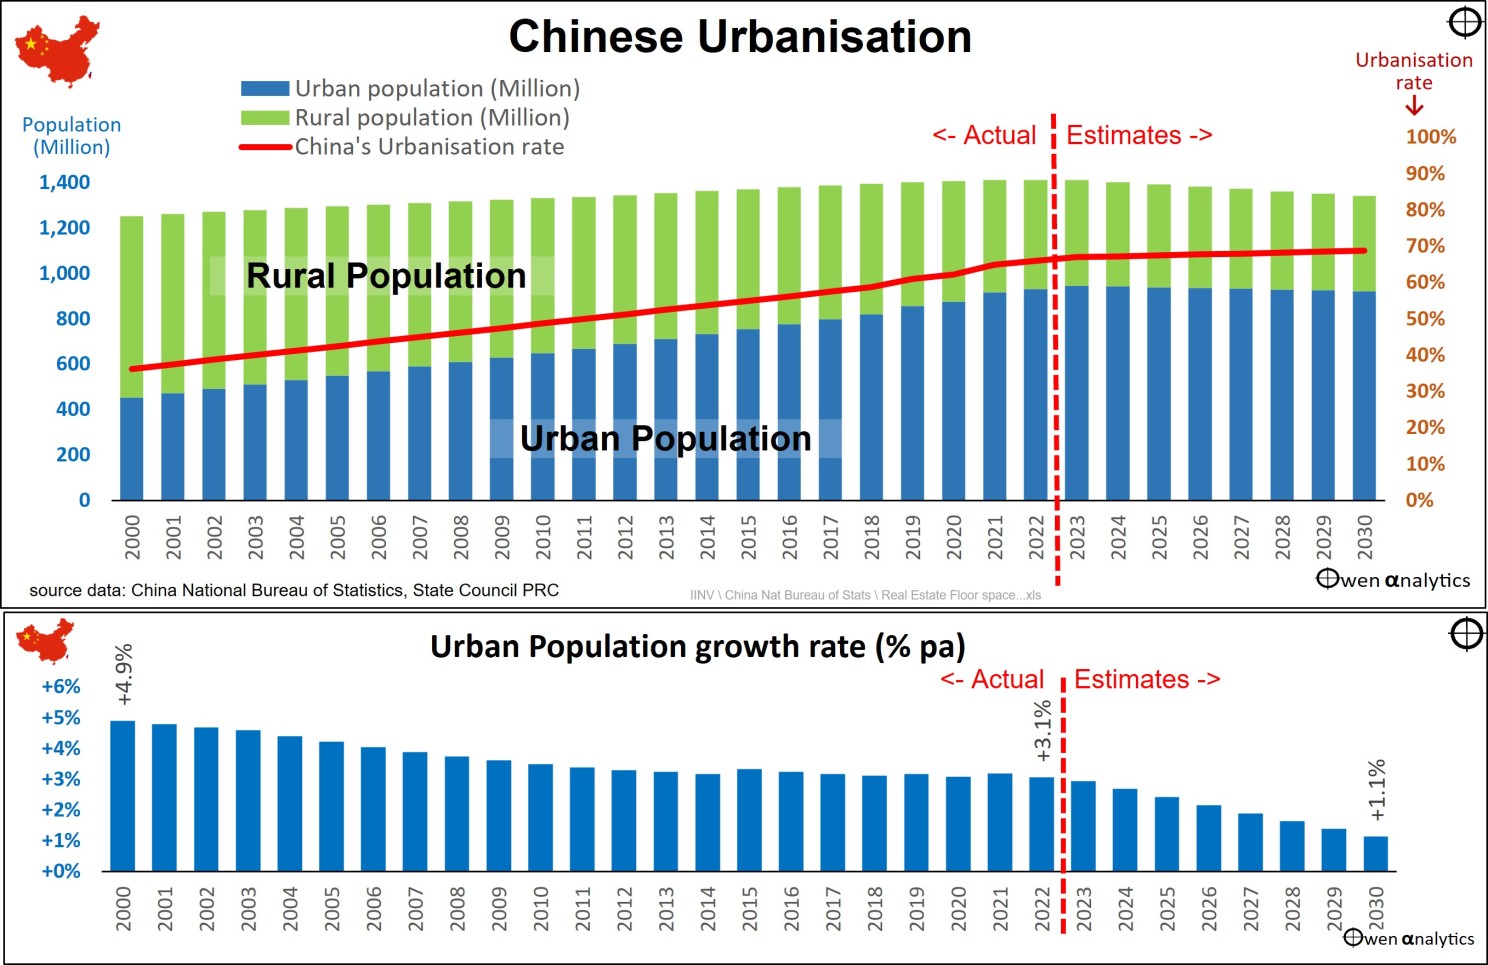
Chinese urbanization since 2000
The urban population has grown from 450 million (36% of the total population) in 2000 to 940 million (67% of total population) in 2023.
But the rate of growth is slowing. Growth in urban population has fallen from 5% per year at the start of the century to 3% per year now. With the overall population declining, and urbanization rate probably slowing, the growth in urban population is likely to slow, to perhaps 1% per year at best.
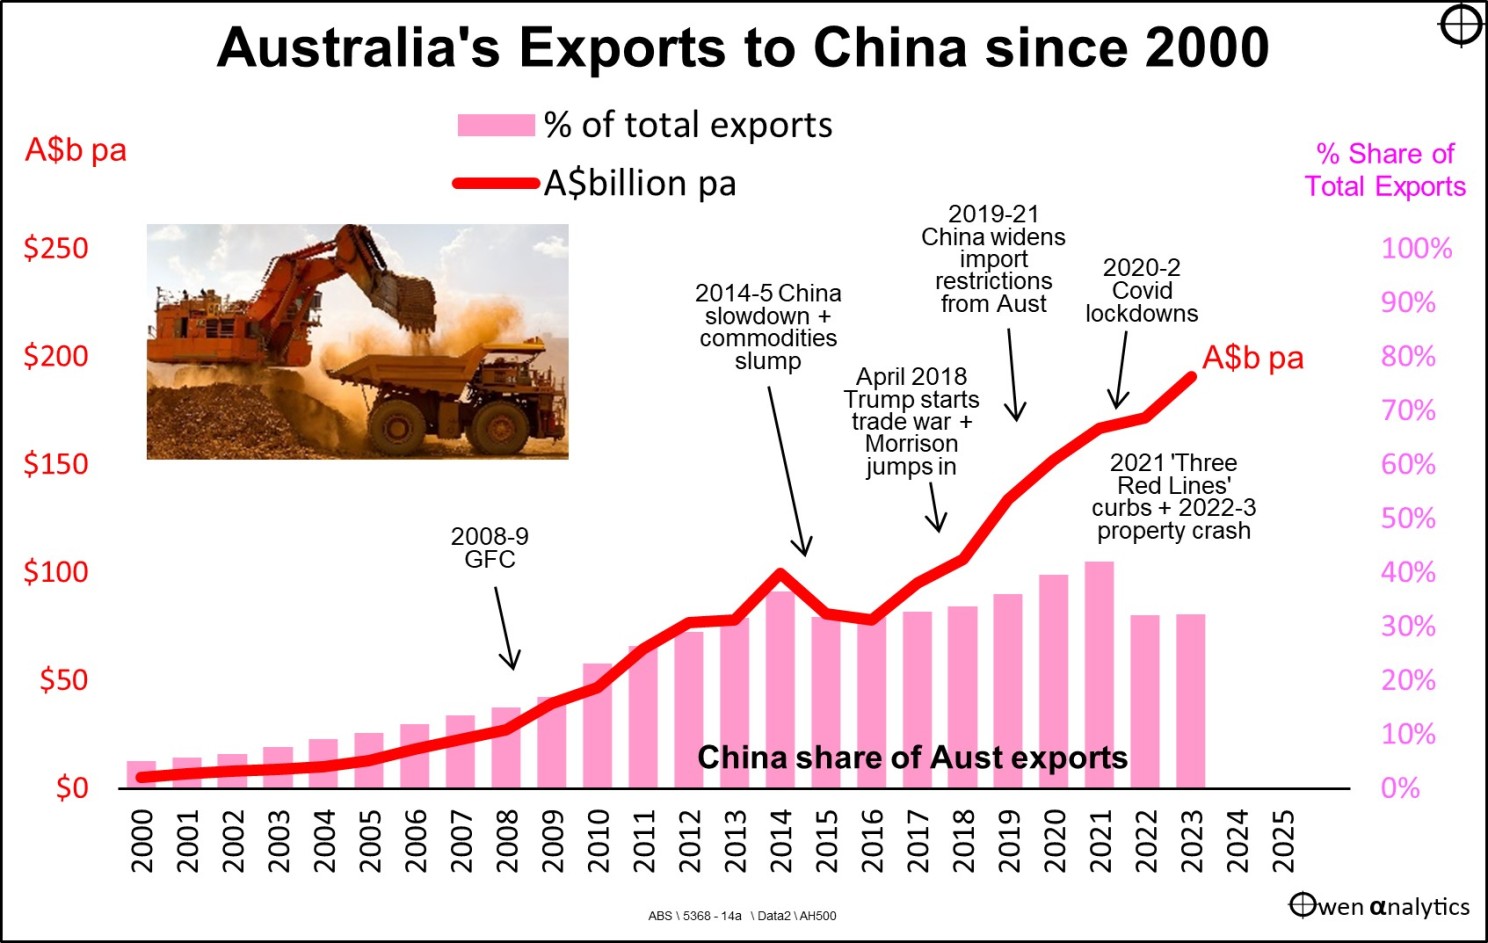
But Australia’s Exports to China Are Booming Like Never Before!
Our next chart shows that Australia’s exports to China have been soaring – despite the severe construction slowdown since 2020.
With China’s import restrictions still affecting many types of Aussie exports (barley, wine, etc), the export boom in minerals (mainly iron ore) has accelerated!
Australia exports to China since 2000
Something must be missing!
China’s population is declining, urbanization is slowing, construction of buildings is in a major slump, and manufacturing production volumes are down, but Australia’s exports of iron ore, coal, and industrial metals are soaring.
What is China building with our rocks?
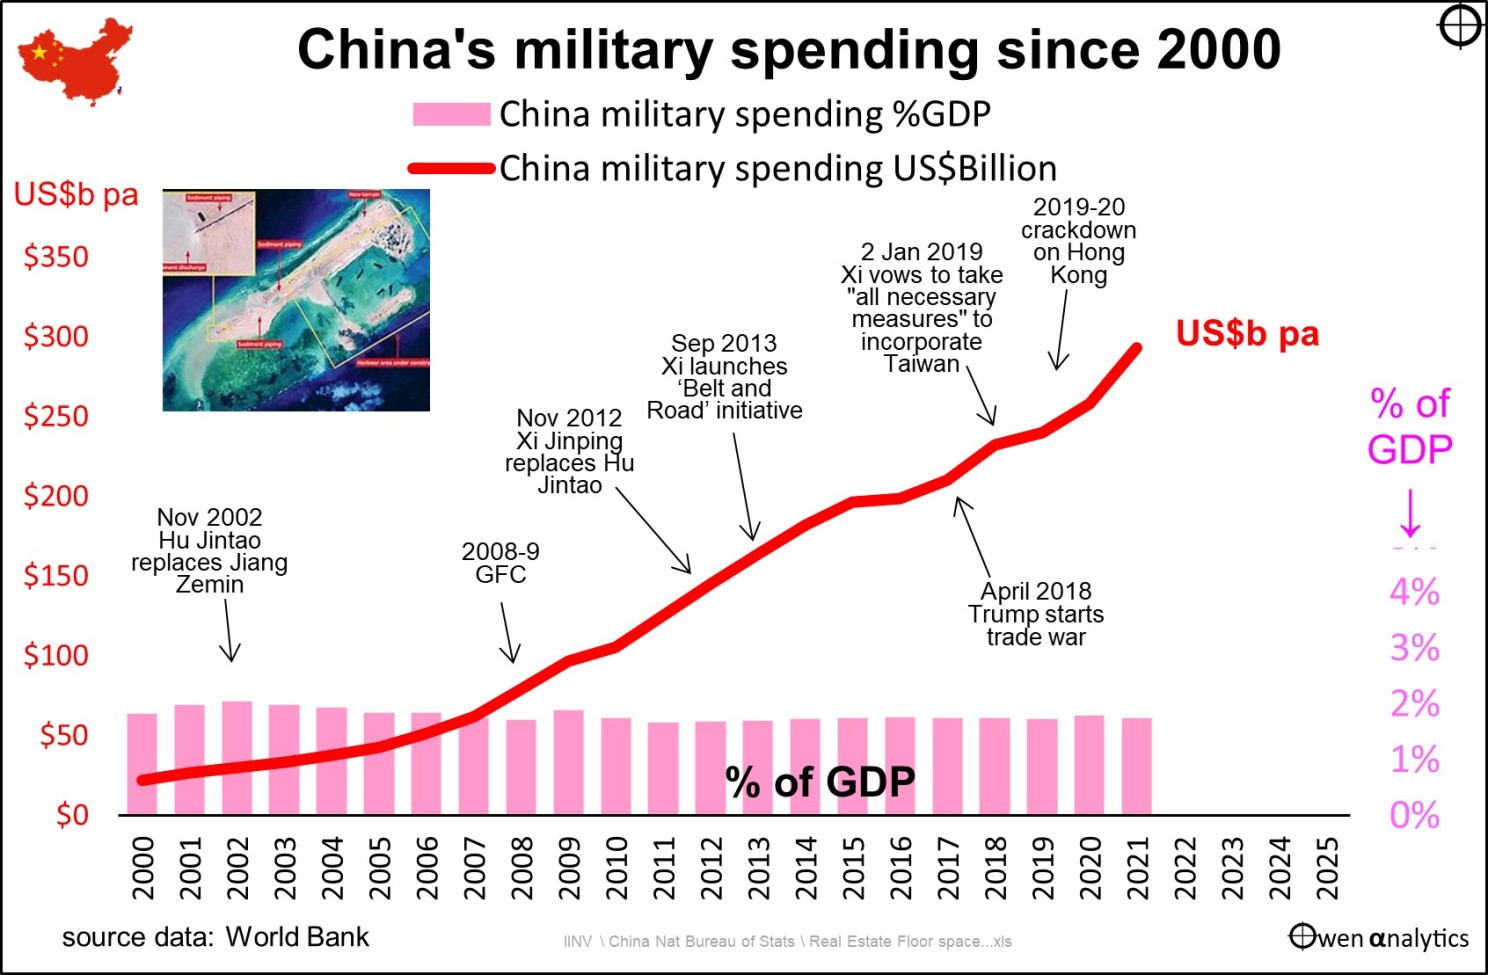
Military Buildup
Our final chart shows the big growth sector – military spending.
China's military spending since 2000
China’s military spending has been steady at a little under 2% of GDP per year over the past two decades.
Despite slowing economic growth, China’s military spending has accelerated in dollar terms, especially in recent years, with the trade tensions with the US since 2018, and with Xi’s escalations in Hong Kong, Taiwan, the South China Sea, and the ‘Belt and Road’ trade/military relationships in the Pacific, across central Asia, and into Africa and Europe.
Over the same period, defense spending in the US averaged 3.9% of US GDP per year (i.e., twice that of China, relative to their national incomes), but in dollar terms, the US spends three times what China spends. China is playing catch-up and is likely to continue to increase military spending.
This is likely to keep Aussie rock exporters happy for many years to come!
The military build-up has broader implications, of course, including:
- Supporting commodities prices – especially for Australian exports
- Commodities cycles - oversupply, substitutes, speculative bubbles
- Higher commodities prices feeding into general price inflation globally
- Commodities prices and revenues crowding out non-mining investment to boost productivity
- Drift from global free trade toward trade blocks and competitive friend-shoring and on-shoring
We will cover these issues in due course.
Stay tuned!
Thank you for your time. Please let me know your thoughts.