Key points
- Looking at share market returns under every PM and government since Federation - right-leaning governments win, with significantly higher average returns than under left-leaning governments.
- Left-leaning PMs presided over the worst return periods for the share market, and also the best return periods.
- However, most of big differences were due mainly to lucky (or unlucky) timing and/or delayed causation from prior governments.
- Our governments deserve credit for creating and maintaining relatively favourable and stable conditions for investment – better than almost every other country on earth.
- But our returns have been sliding in recent decades. Time for the next government to step up, bring on productivity-enhancing reforms, reduce the rising tide of red tape, green tape, and black tape, then get out of the way.
Election season
Every Federal election cycle I get the usual uptick in questions about which side of politics has been better for the local share market, ‘left’ or ‘right’? So let’s take a look at share market returns under every PM and government since Federation.
Australia has been blessed (or cursed) with 31 Prime Ministers in the past 124 years since Federation in 1901. That’s an average of 4 years per PM.
In contrast the US has had only 21 President during the same period. (Does more time in office per leader mean more stability? Not necessarily – look at the US today!)
Right or Left?
To find out which side of politics has been better for our share market, first we need to label each PM and their government as either ‘left-leaning’ or ‘right-leaning’.
Since the 1940s, this has been relatively simple – ‘right’ for Liberal and Country/National parties, and ‘left’ for Labor. Traditionally, ‘left’ tended to mean pro-worker and big government, and ‘right’ has tended to mean pro-capital (business) and small government, but it is not that straightforward as governments often stray far from their labels.
The first 40 years after Federation was more complex as it wasn’t a question of Liberal versus Labor. A variety of political parties held government at various times. Prime Ministers switched parties, and the parties also changed policies.
For example, Billy Hughes (PM from October 1915 to February 1923) was a member of five different political parties at various times! I count Hughes as ‘left-leaning’ during his Labor and National Labor periods as PM, but ‘right-leaning’ for his Nationalist period as PM.
Based on their economic policies at the time, I have labelled the following parties as ‘right-leaning’ – the Protectionist Party, Fusion Party, Free Trade Party, Nationalist Party, the early Liberal Party, United Australia Party, and Country Party. I have labelled the National Labor Party and the Australian Labor Party as ‘left-leaning’.
There is a degree of subjectivity involved here of course, but it is probably a good starting point. On this basis we have had right-leaning governments for 67% of the time since Federation, and left-leaning governments for the remaining 33% of the time – a neat two-thirds / one-third split.
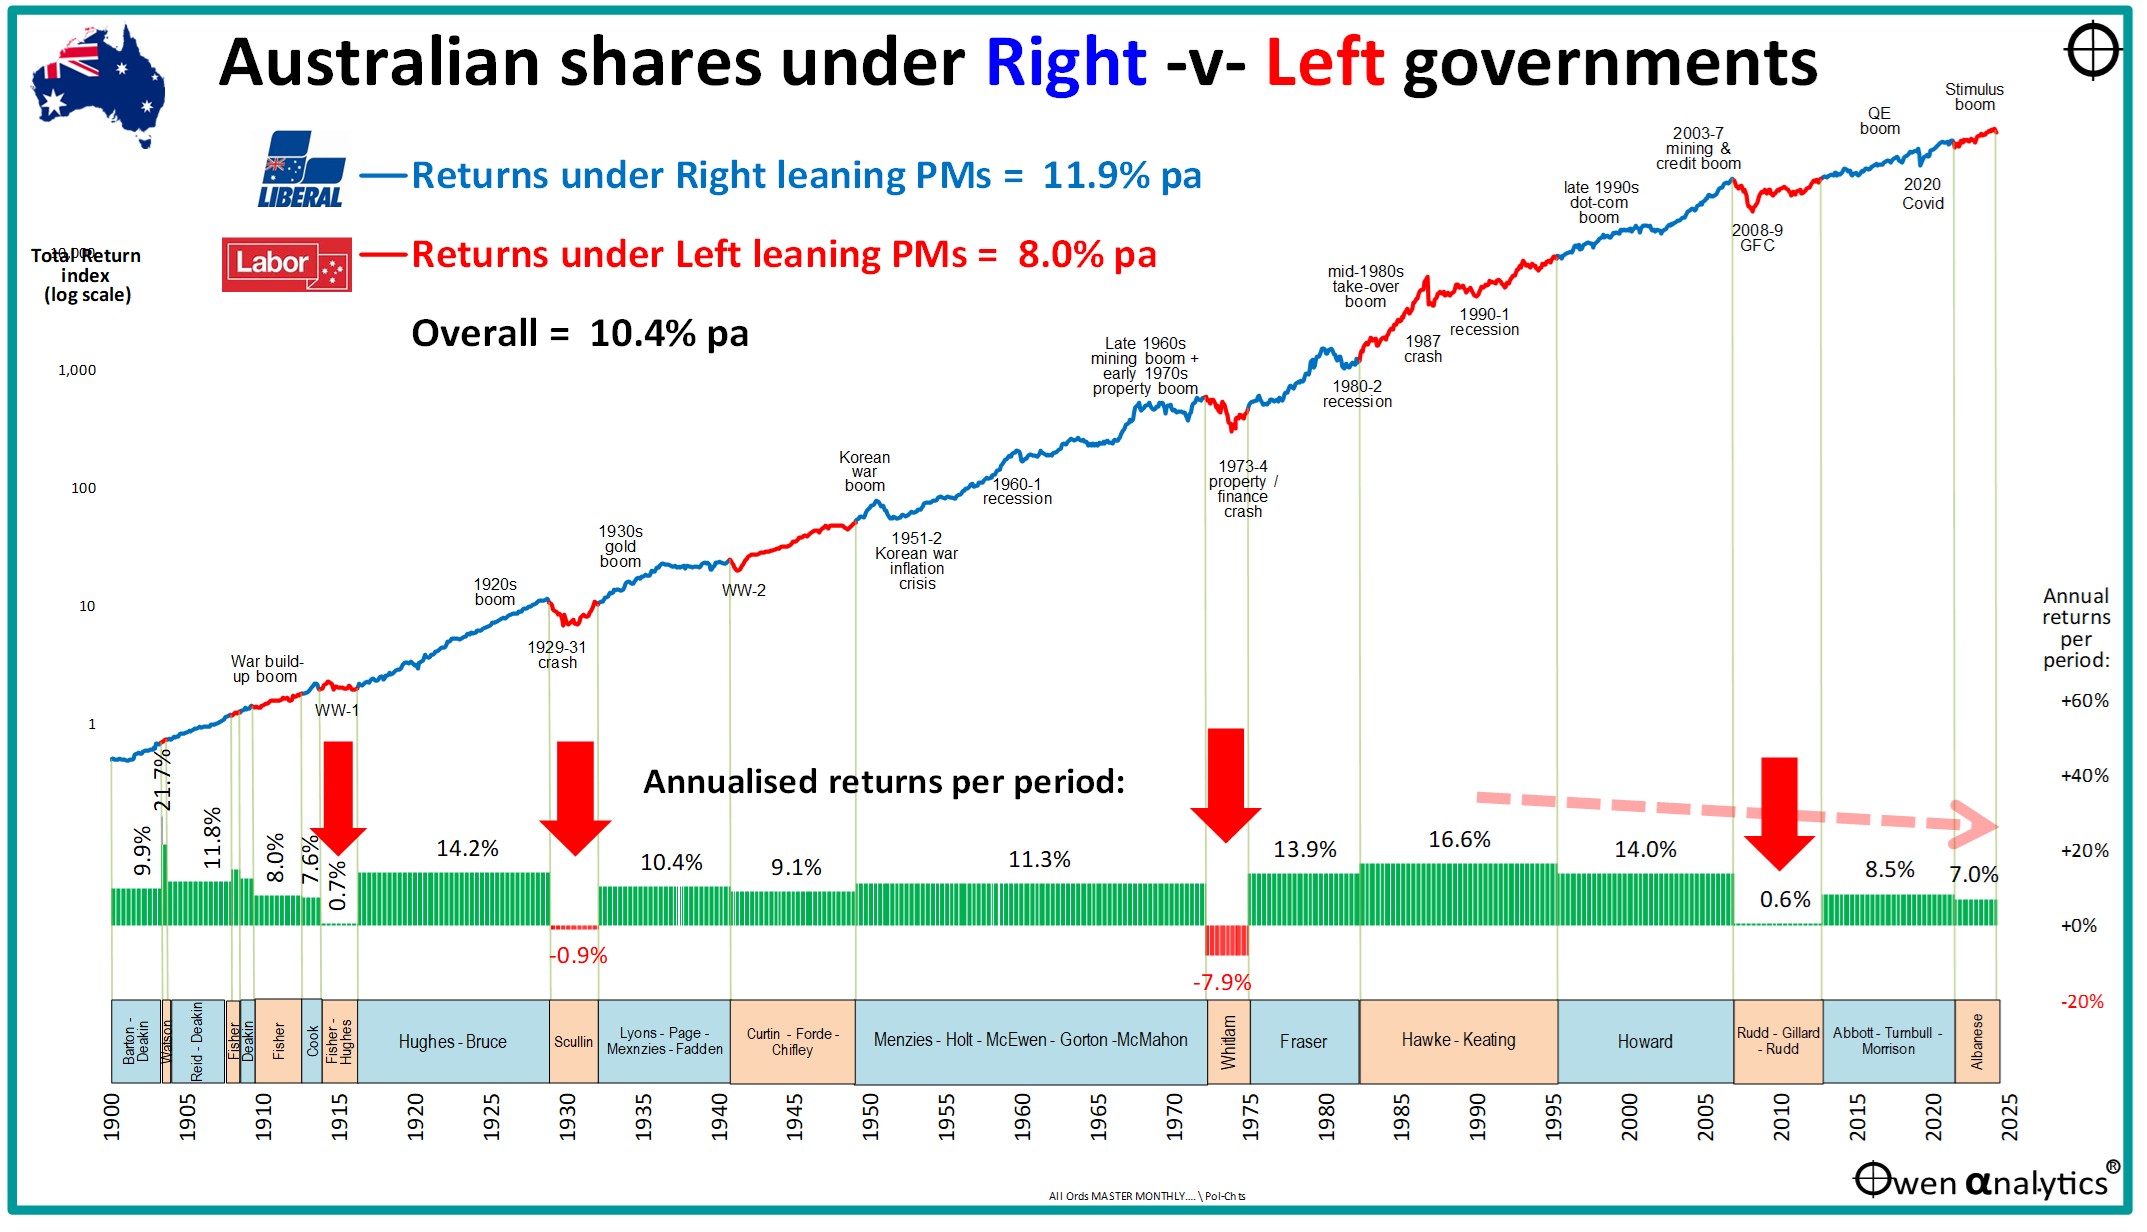
Today’s chart shows total returns from Australian share market since Federation – divided into ‘right-leaning’ periods (blue line) and ‘left-leaning’ periods (red line). The lower section of the chart shows the average annualised total returns (including dividends reinvested) for each political period (all returns are before costs, fees, taxes).
Returns
Total returns from the local stock market (ie capital gains plus dividends) have averaged 10.4% per year since Federation overall (data to March 2025).
Returns averaged 11.9% pa under right-leaning governments, versus 8.0% pa average returns under left-leaning governments.

Although the ‘right’ has clearly won overall, we can draw no conclusions from this. There are two main problems – causation and luck.
Poor returns were all under Labor – but mostly just unlucky timing
There were only four PMs who presided over periods of very poor or negative total returns from the share market, and they were all left-leaning – Fisher, Scullin, Whitlam and Rudd/Gillard/Rudd.
They would claim they were not to blame for the poor share market returns of course. Each would argue that the poor returns were due to poor policies of the prior government, and/or to global crises beyond their control - and they would largely be correct. Let’s look at each of these four periods in turn.
Outbreak of WW1
First - Andrew Fisher (Labor) can hardly be blamed for the stock market fall on the outbreak of the First World War. Our share market fall was actually much milder than it was in the US, but the US was not even involved in the war until it was reluctantly dragged in more than two and a half years after the War had started. (US shares and the US dollar fell heavily at the outbreak of War as UK/European investors pulled their money out and converted back into gold to bring back home).
1929-31 crash
Second - Jim Scullin (Labor) took office just six days before Wall Street’s ‘Black Monday’ 28th October 1929, after the long 1920s boom under Stanley Bruce, so Scullin can hardly be blamed for the crash.
Even before the crash, the Australian economy had been in recession since 1927, due the halving of wool and wheat prices in the global glut and commodities price slump. We also had the failure of government bond issues in London following the profligate government spending spree in the 1920s (although most of the loose government spending was by the States, not the Federal government).
On the other hand there is little doubt that Scullin made things considerably worse with his ‘Scullin Tariff’ and his support of the hard-line ‘Niemeyer Plan’ and ‘Premier’s Plan’ for savage cuts to wages and spending, although much of this was continued after Joe Lyons (right-leaning UAP) took office.
Our share market fell less than the US market (ours down -64% compared to US down -89%), and our market bottomed and started to rise more than a year earlier than the US market.
Early-mid 1970s
Third – Gough Whitlam (Labor) came to power on a wave of euphoria after the long period of Liberal rule under Menzies, Holt, Gorton, and McMahon. In the brief but turbulent Whitlam years, the share market headed straight down with very little respite for shareholders.
There were two periods of major stock market losses in the early-mid 1970s. The first was the inevitable collapse of the crazy late-1960s speculative mining boom when prices reached ridiculously high levels and were bound to collapse. The second share market collapse in 1973-4 was a much deeper and more wide-spread crisis, with the collapse of the property finance boom, made worse by Whitlam’s credit squeeze and government financing scandals.
The mid-1970s was a period of great turmoil across the world – with governments in many countries falling to military coups, insurrections and widespread civil unrest. Our system survived (although Whitlam was sacked by the Queen of England. (Oops, I mean ‘Queen of Australia’, and her son Chuck is still our King!). Many countries fared far worse than Australia during the turbulent 1970s.
2008-9 Global Financial Crisis
Fourth - Kevin Rudd (Labor) came to power in November 2007 at the very top of the 2003-7 global share market boom that had been frothing along under John Howard (Liberal).
In the 2008-9 the ASX fell by more than nearly every other country in the world, despite the fact that Australia had neither a housing crisis nor a banking crisis (the US had both), and despite Labor’s massive government stimulus programs (the second largest stimulus in the world relative to GDP, after China).
Why? We had a bigger GFC bust than the US and the rest of the world because we had a bigger pre-GFC boom, and so it had further to fall. Not only did we have a wild credit boom like the rest of the world, we also had a wild speculative mining boom at the same time thanks to China’s explosive growth. The bigger the boom – the bigger the bust, regardless of who happened to be in power at the time of the bust.
Periods of high returns
The periods of poor returns just happened to be while left-leaning governments were in power. It was clearly more a case of unlucky timing. On the other hand, periods of high returns from shares have been rebounds out of recessions, which often coincided with the election of new governments.
For example, the high returns under Joe Lyons (UAP – right) from the bottom of the 1930s depression were more a case of recovering over-sold shares in the depression, plus the speculative gold mining boom triggered by Roosevelt’s US dollar devaluation, supported by Scullin’s Gold Bounty.
Lagged cause and effect?
Many of the big booms occurred under right-leaning governments – eg in the 1920s, 1960s, 2000s) aided and abetted by their pro-business policies like cheap money and hands-off governments, which encouraged (over-) confidence and speculation.
Inevitably, these policies and booms also sowed the seeds of the crashes that followed (for example - cheap money raising prices, inflation, which in turn requires rate hikes and/or fiscal tightening, triggering slowdowns and crashes). Most of these slowdowns and crashes happened to have occurred during left-leaning governments. (Note that before WW2, interest rates and exchange rates were set by the trading banks. The Government mainly used fiscal controls like sales taxes, personal/corporate taxes, and tariffs to manage the economy.)
But it would be going too far to suggest that economic and share market booms fostered by right-leaning governments and policies, were followed by crashes and downturns because of, or made worse by, left-leaning governments and policies. There are too many moving parts for such a simple conclusion.
The winner is. . .
The winner for high returns was the Hawke-Keating period (Labor), with annualised returns averaging 16.6% per year. (The only better period was during John Watson’s brief 113 day rein as PM in 1904 – also Labor).
The high share market returns in the Hawke-Keating era were not only a strong rebound from the early 1980s double-dip recessions under Fraser (Lib), but also were greatly assisted by the wide-ranging deregulation and economic reforms introduced by Hawke and Keating.
Global -v- local impacts
Although global events and trends dominate the direction of the local capital markets and economic conditions here in Australia, global trends do not translate automatically to local impacts. Much depends on the actions of government within each country.
For example, Australia and Argentina had very similar economies at the end of the 19th century, and both shared the highest living standards in the world at that time as commodities exporting former European colonies. However we followed very different paths since then – due largely to the actions and effectiveness (or lack thereof) of governments within each country.
Argentina suffered a string of political and economic disasters (and it is still suffering) – almost entirely due to its own internal decisions and actions.
Credit where credit is due
Many countries end in self-inflicted economic disaster, so we should give credit to our governments over the years for not falling into the many traps that have ensnared the majority of counties in the world at one time or another.
There are 200+ countries in the world today, but Australia is one of only a very small handful that are open democracies with stable, accountable governments and strong public institutions. In particular, both sides of politics in Australia have been pro-growth, pro-development, pro-immigration, and more-or-less pro-business, and mostly pro-competition.
Only Australia, New Zealand, Canada and the US have delivered an un-broken run of high returns to shareholders since 1900 (aside from the inevitable booms and busts along the way of course).
Not just ‘British institutions’ or ‘resources riches’
It is no accident that these ‘success stories’ are all former British colonies. However that is not enough. There are dozens of former British colonies that have fared relatively poorly since their independence – including India, Pakistan, Bangladesh, Sri Lanka, Myanmar, Egypt, Kenya, Iraq, Libya, Nigeria, Somalia, South Africa, Uganda, Yemen, Zimbabwe, and so on.
And look at Britain today – it was once the epicentre of the industrial revolution and the leading capital market of the world – but look at it now.
Nor is our success due to our ‘resource riches’. Many ex-British colonies are also resource-rich, but their wealth has been siphoned off and pocketed by successions of corrupt rulers and elites, so we cannot simply conclude that Australia’s luck has been its resource abundance alone.
Credit for Australia’s relative economic success must go to the governments we have elected, and to generations of prior governments that established and developed these institutions and pro-growth policies.
Once these big-picture political and institutional settings are in place, it is often difficult to attribute long term economic outcomes to specific governments, or to claim that one side of politics delivered better returns than the other.
Remarkable consistency of returns over 124 years
Do this quick test – find a ruler or other straight edge and line it up with the share market return line on the chart.
(For long term charts I use a ‘logarithmic’ (or ‘ratio”) scale on the vertical axis as it highlights the rate of compound (‘geometric’) returns over time. A straight line indicates consistent compound growth rate over time).
It is an almost perfect straight line – an average 10% compound annual total returns for the 124 years (with a few minor ups and downs along the way).
Over that period we have seen two World Wars, the Great Depression, cold wars, peripheral wars, nuclear scares, military flare-ups, high inflation & deflation, protection & free trade, regulation & deregulation, high taxes & low taxes, big government & small government, massive changes in technology, society, a host of natural disasters, pandemics, boom/bust cycles, and countless political crises here and around the world.
Through all of this drama and turmoil we have had 31 PMs whom we criticised, chastised, and some we even mocked. Some lasted just days, others lasted more than a decade. Some supported business and enterprise, others tried to destroy and nationalise it.
But still – look at chart of consistent compound growth in the share market through it all!
Recent few decades – a warning sign?
We cannot take this for granted of course. We cannot blindly assume it will automatically stay on the upward path at the same rate. We cannot blame or rely on global events and trends – much of the outcomes are based on local decisions by local leaders, and the ability of our companies to weather the storms, and the steady stream of PM and governments they have to deal with along the way.
Urgent need of productivity-enhancing reforms
One final feature of this chart that I will highlight is the dotted red arrow indicating the steady decline in returns since the high point of the Hawke/Keating period.
Not only was this the period of highest share market returns, it was also the period of the great reforms that took the country from a low-productivity, highly protected, highly taxed, highly regulated, high inflation, high interest rate, rigid, closed economy, to a much more open, flexible and dynamic economy with higher productivity, lower inflation and lower interest rates, through into the 1990s and 2000s.
Those great share market returns of the Hawke/Keating period were achieved despite the setbacks of the 1987 crash, the 1990-1 ‘recession we had to have’, and the 1992 banking crisis, as well as the implementation of the raft of painful and often disruptive economic reforms at the time.
The problem is that Australia’s economic ranking and living standards have been sliding since the end of the 2000s China / mining / commodities boom that allowed the Howard government to pay off the national debt.
Ever since then, governments of all flavours have been guilty of failing to keep up the momentum for productivity-enhancing reforms. On the contrary, for every meagre forward step, it seems there has been at least two backward steps.
Unfortunately in the upcoming election campaign, neither of the major parties offers any productivity-enhancing reforms. All we have is a scatter-gun of promises to buy votes with debt-funded hand-outs.
Let’s see what the upcoming election throws at us!
‘Till next time. . . . safe investing!
Notes on data sources:
Australian shares:
- From 1980 – ASX All Ords accumulation index
- 1958-1979 - Sydney All Ordinaries
- 1936-1957 - Sydney 34 Ordinaries
- Before 1936 - Sydney Commercial & Industrial Index
- Before 1979, total return series use the Adjusted Lamberton dividends series.