The US Federal Reserve is expected to enter a new rate cut cycle, cutting rates for the first time since the Covid crisis in early 2020. Here’s what it means for the US share market:
-
-
- In rate cut cycles, the US share market has usually posted higher returns, but also higher volatility
- The big issue will be inflation - has it been solved? or will it revive like in previous cycles?
- With monetary policy now being eased, can we rely on Trump or Harris for fiscal restraint to contain inflation?
Given the almost universal euphoria in anticipation of the Fed starting to cut rates, the general consensus appears to be that it will magically herald a new golden era for the share market! We need to take a closer look.
This story looks at US rate cuts and rate hikes in past cycles, and their impact on the US share market.
US share market -v- interest rate cycles and inflation
Today’s chart shows US inflation, short-term policy interest rates, and US shares since 1945. Over the period, the US Federal Reserve has made 135 rate hikes and 115 rate US cuts, organised into cycles.
With the Fed set to cut rates this week for the first time since the Covid cuts in early 2020, we are now entering a new rate CUT cycle.
This chart has three sections. The upper section shows the Dow Jones Industrial Average (DJIA) since 1945. This line is green during rate CUT cycles and red during rate HIKE cycles. The line is currently red since we have been in a rate hike cycle since the Fed started raising interest rates on 17 March 2022.
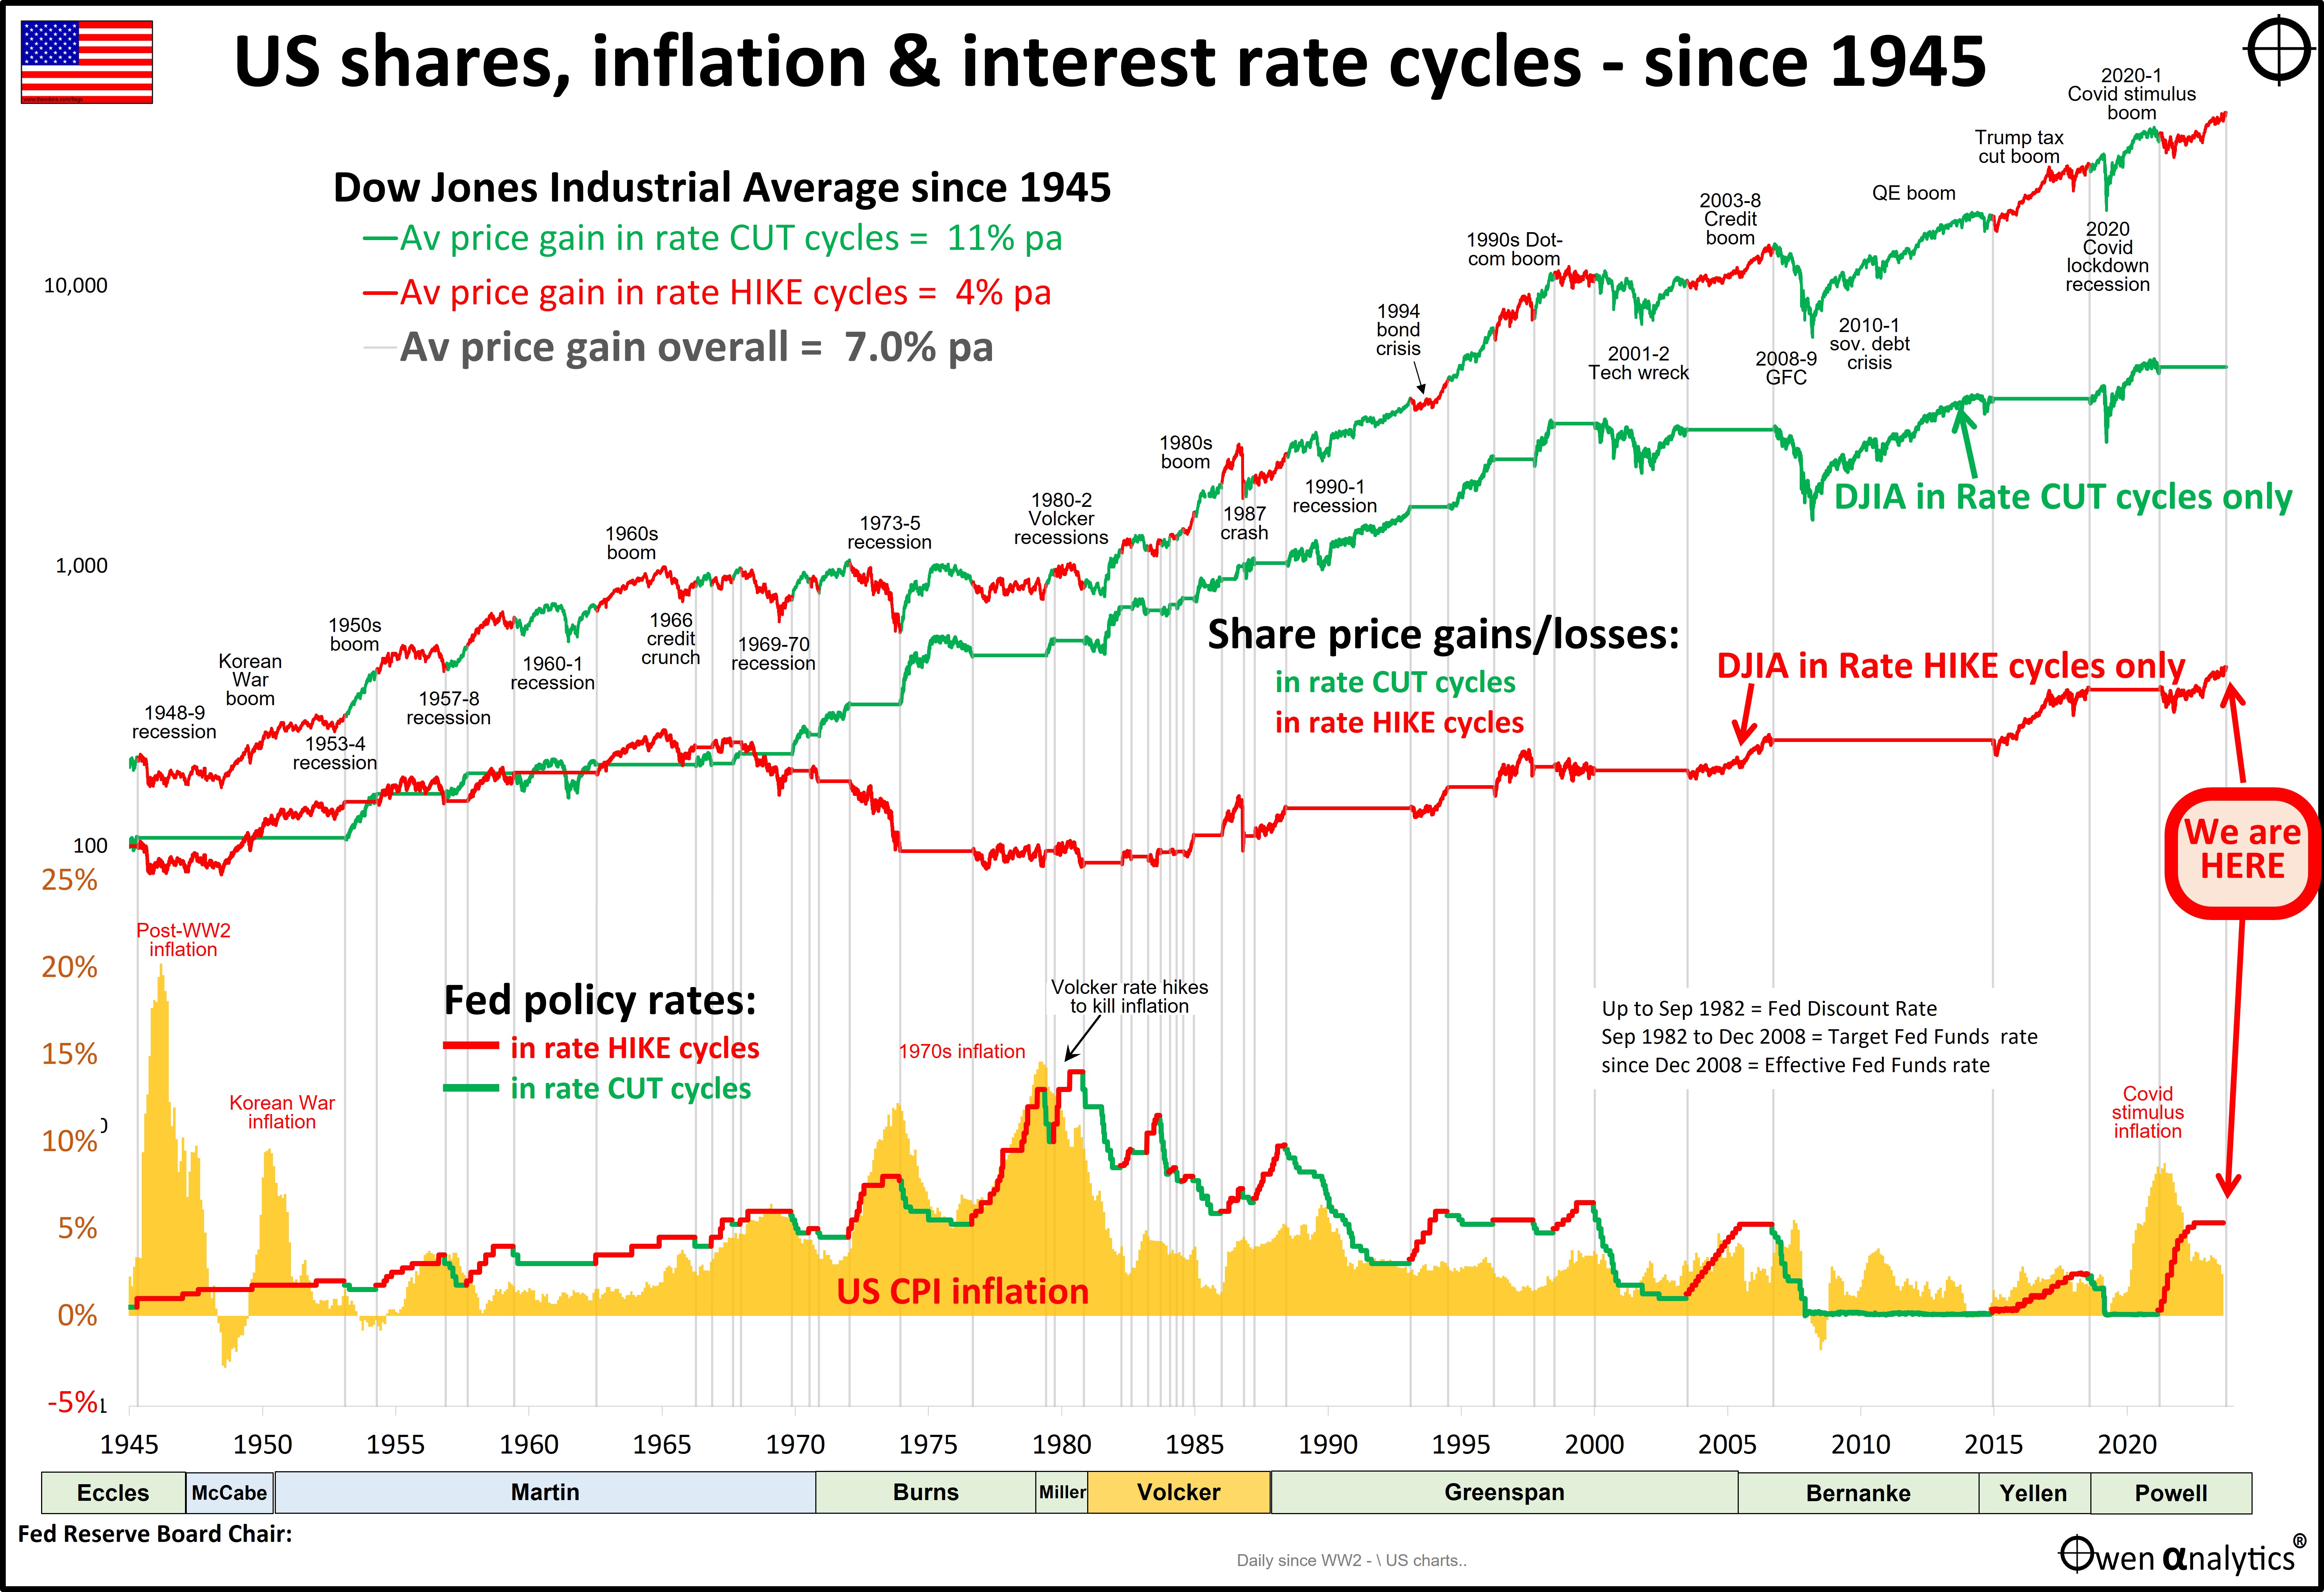
The lower section of the chart shows annual CPI inflation in the US as orange bars, and the Fed policy cash rate. The cash rate line is green during rate CUT cycles and red during rate HIKE cycles. To the right we see that the Fed’s rate hikes since 2022 have brought inflation down from a peak or 8.6% in March 2022 to 2.4% in August 2024.
The key question is – have the rate hikes done enough to kill inflation (at least for a few years)?
In the middle section of the chart, the Dow Jones index is split into two lines:
- the green line shows how the index fared during just the rate CUT cycles (the green line is flat during rate HIKE cycles,
- the red line shows how the index fared during just the rate HIKE cycles (and is flat during rate CUT cycles)
Shares much better in rate cut cycles
We can see from the green and red share price lines in the middle section that the green line (share market during rate CUT cycles) is well ahead of the red line (share market during rate HIKE cycles).
- During rate CUT cycles (green) the market rose by an average of 11% per year.
- But during the rate HIKE cycles (red) the market rose by an average of just 4% per year.
Over the whole period, including all rate cut and rate hike cycles, the market rose by an overall average of 7% per year.
It would be easy (but wrong) to conclude that rate cut cycles are always going to be better for shares than rate hike cycles just because interest rates are declining.
Inflation the difference
The difference between the green line (shares during rate cut cycles) and at the red line (shares during rate hike cycles) is mainly due to the very poor performance of the share market during the rising inflation period from the mid-1960s to 1980 – indicated by declining red line (shares during rate HIKE cycles) in the middle of the chart.
It would be unwise to conclude simply that shares will do well now we are entering the start of another rate cut cycle, with the Fed’s first rate cut this week (September 2024).
Shares will only do well if inflation has been killed by the recent rate hike cycle (March 2022 to September 2024).
Late-1960s-1970s inflation
The last time the US had an inflation problem it started in the mi-1960s (Kennedy tax cuts, LBJ’s Great Society spending, and Vietnam war spending). The late 1960s inflation was reduced somewhat by rate hikes in 1968 and 1969, and by the resultant 1969-70 recession, but inflation took off again from late 1972 (before the 1973 oil crisis).
Inflation surged back to even higher levels – twice – in the early-mid 1970s, and again in the late 1970s. Part of the causes of the two 1970s inflation spikes were external shocks (oil shocks following the 1973 Kom Kippur war, and 1979 Iranian revolution), but the inflation problems were certainly exacerbated by poor government policies as well.
This is exactly the situation today – inflation has been helped along by external shocks (Covid lockdowns, and Russia-Ukraine war), but it has been exacerbated by excessive monetary and fiscal largess, in particular the huge increases in government spending (and in Australia, by centralised wage hikes).
The 1970s inflation was only killed off by the dramatic Volcker rate hikes in 1979-81, and the resultant deep early-1980s ‘double-dip’ recession. Unemployment shot up to 11% and took a decade to come down.
Share market during each interest rate cycle
To illustrate that it’s not all plain sailing in rate cut cycles, the second chart below has the same upper and lower sections, but the middle section shows the US share market gains and losses during each rate cut and rate hike cycle.
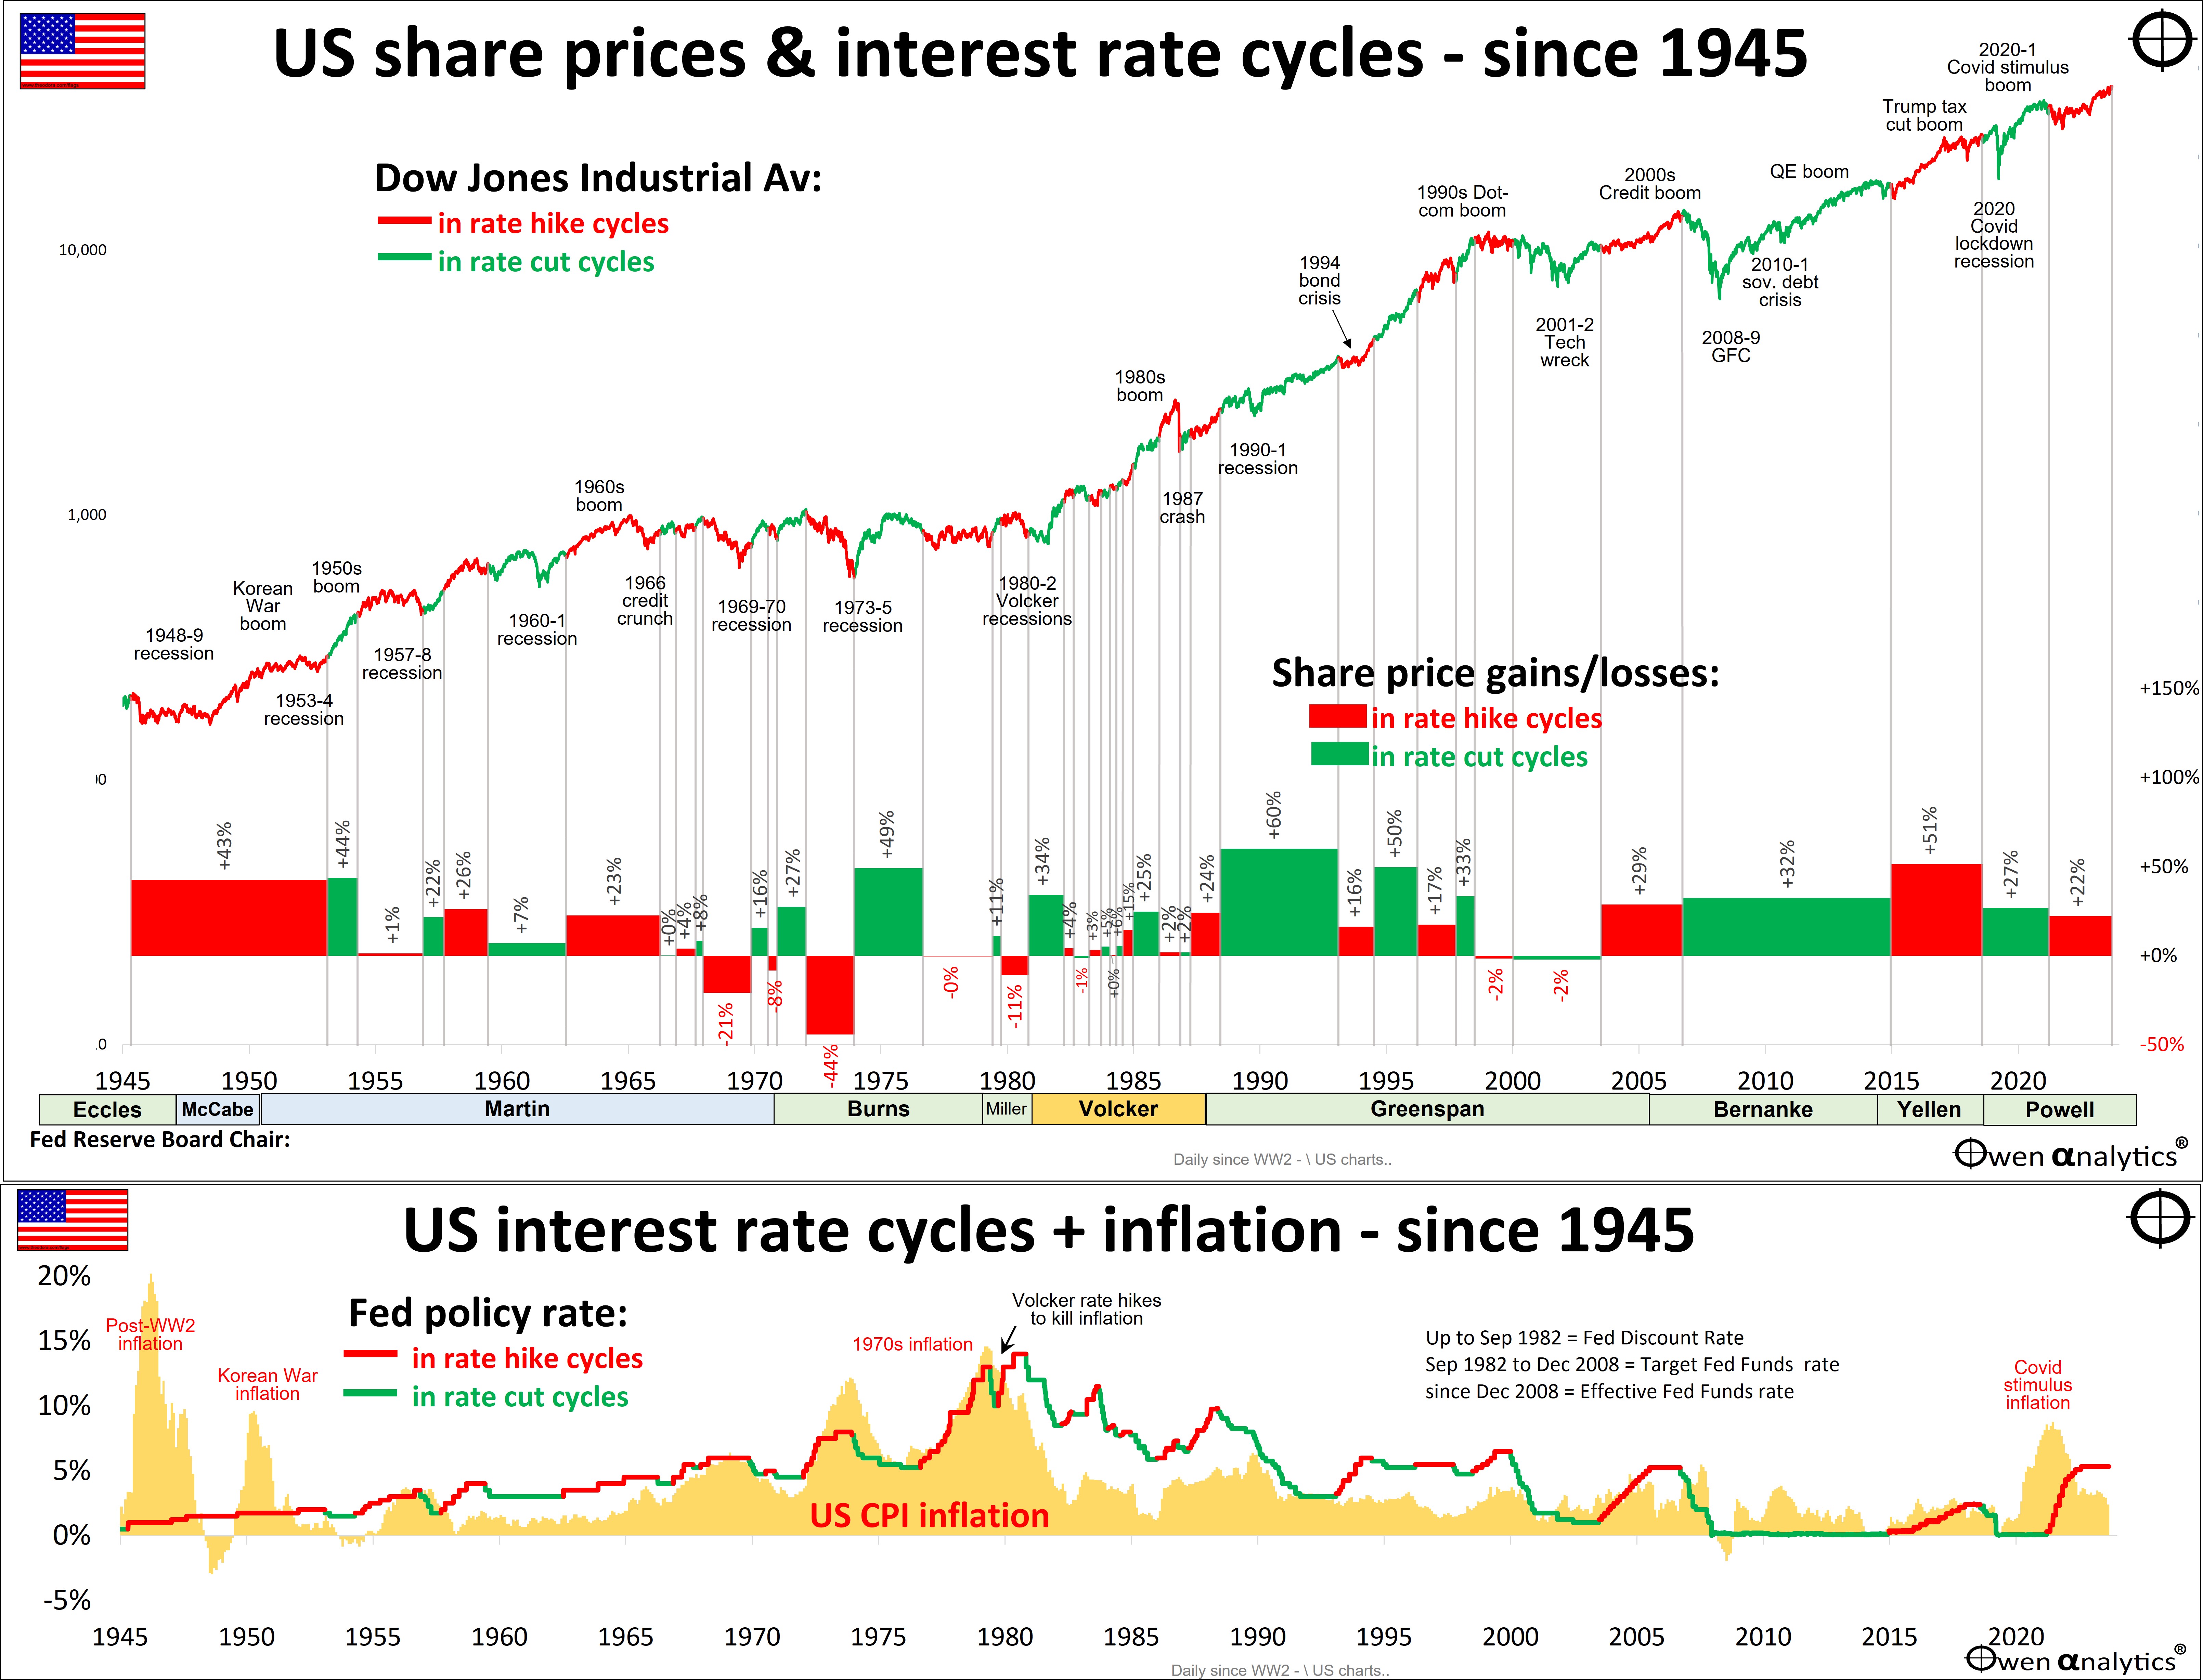
In the middle section, the blocks show the overall (not annualised) gain or loss in the Dow Jones index during each interest rate cycle – red blocks are for the rate HIKE cycles, and green blocks for rate CUT cycles.
Here we can see that some of the best periods for the share market were rate HIKE cycles (positive red blocks) – eg:
- +43% share market rise in the rate HIKE cycle from April 2046 to Feb 1954 – when the US had massive inflation spikes in the late 1940s (post WW-2) and Korean War inflation.
- +51% share market rise in the rate HIKE cycle from December 2015 to August 2019 (pre-Covid).
- +29% share market rise in the rate HIKE cycle from June 2004 to September 2007 – when rates were progressively hiked to counter rising inflation in the 2003-8 credit/China boom.
- +22% in the current rate HIKE cycle from March 2022 to now (Sep 2024).
But also big losses in rate hike cycles
Despite several positive gains in the share market during rate hike cycles noted above, rate HIKE cycles were responsible for almost all of the negative share price moves – shown as the big negative red blocks in the middle section of the chart.
Notably, from the mid-1960s to early 1980s, all five of the rate HIKE cycles during this period were negative for the share market (negative red blocks), when the Fed was hiking rates to try to counter inflation.
There is only one negative green block (ie share market loss during rate CUT cycles) – a very small minus 2% in the rate CUT cycle from January 2001 to June 2004 – mainly caused by the 2001-2 ‘tech wreck’ following the collapse of the explosive ‘dot-com’ boom.
What about Recessions?
Recessions generally occur during rate CUT cycles (when central banks are cutting rates to stimulate spending, investment, and jobs). However, in every case (except the tech-wreck noted above), share prices rebounded strongly during the rate CUT cycle itself, before the Fed started to hike rates to slow inflation.
The 2008-9 GFC and 2020 Covid recessions were examples of this.
Share market flat for 16 years of inflation
One notable feature of both charts is the fact that the US share market was flat for sixteen years from April 1966 to September 1982. That’s a long time without share price growth – and that’s before inflation!
This was the period of rising inflation and rising interest rates, resulting in deeply negative real (after inflation) returns from shares for more than a decade and a half.
This is a good reminder that the new rate CUT cycle we are now entering will only been good for the share market if inflation has been solved, and will not revive due to further external shocks and/or government spending sprees or other inflationary policies. We are certainly not out of the woods yet!
Volatility higher in rate cut cycles
This will not be plain sailing. Rate CUT cycles have generally had greater share market volatility because that is when the big scares usually occur – corporate collapses, recessions, external shocks.
Over the whole period since 1945, the price volatility of the US share market has averaged 15.6% pa (annualised standard deviation of daily DJIA moves), but volatility averaged 17% in rate CUT cycles, compared to just 14% pa in rate HIKE cycles.
This is another reminder that it is in the rate CUT cycles that recessions, corporate collapses, and external shocks usually occur.
The new rate cut cycle will be a bumpier ride, but hopefully positive if inflation can be kept under control by fiscal restraint alone, now that rates are easing.
Trump -v- Harris on fiscal restraint?
There are many differences between the policy promises of Trump and Harris (eg. tariffs, fossil fuels, foreign policy), but they share one thing in common – both have abandoned any pretence of fiscal responsibility (eg balanced budgets over a cycle).
With monetary policy now easing, there is very little chance either side will focus on fiscal restraint to contain inflation. The inflation fight is probably not over yet!
'Till net time - happy investing!
See also:


For my current views on asset classes and asset allocations - see:
