Many people will remember the line by Crocodile Dundee after a couple of thugs threatened him with a small pocketknife on the streets of New York. He pulled out his own massive hunting knife, chuckles, and pronounced: “That’s not a knife . . . THAT’s a knife!” (link here)
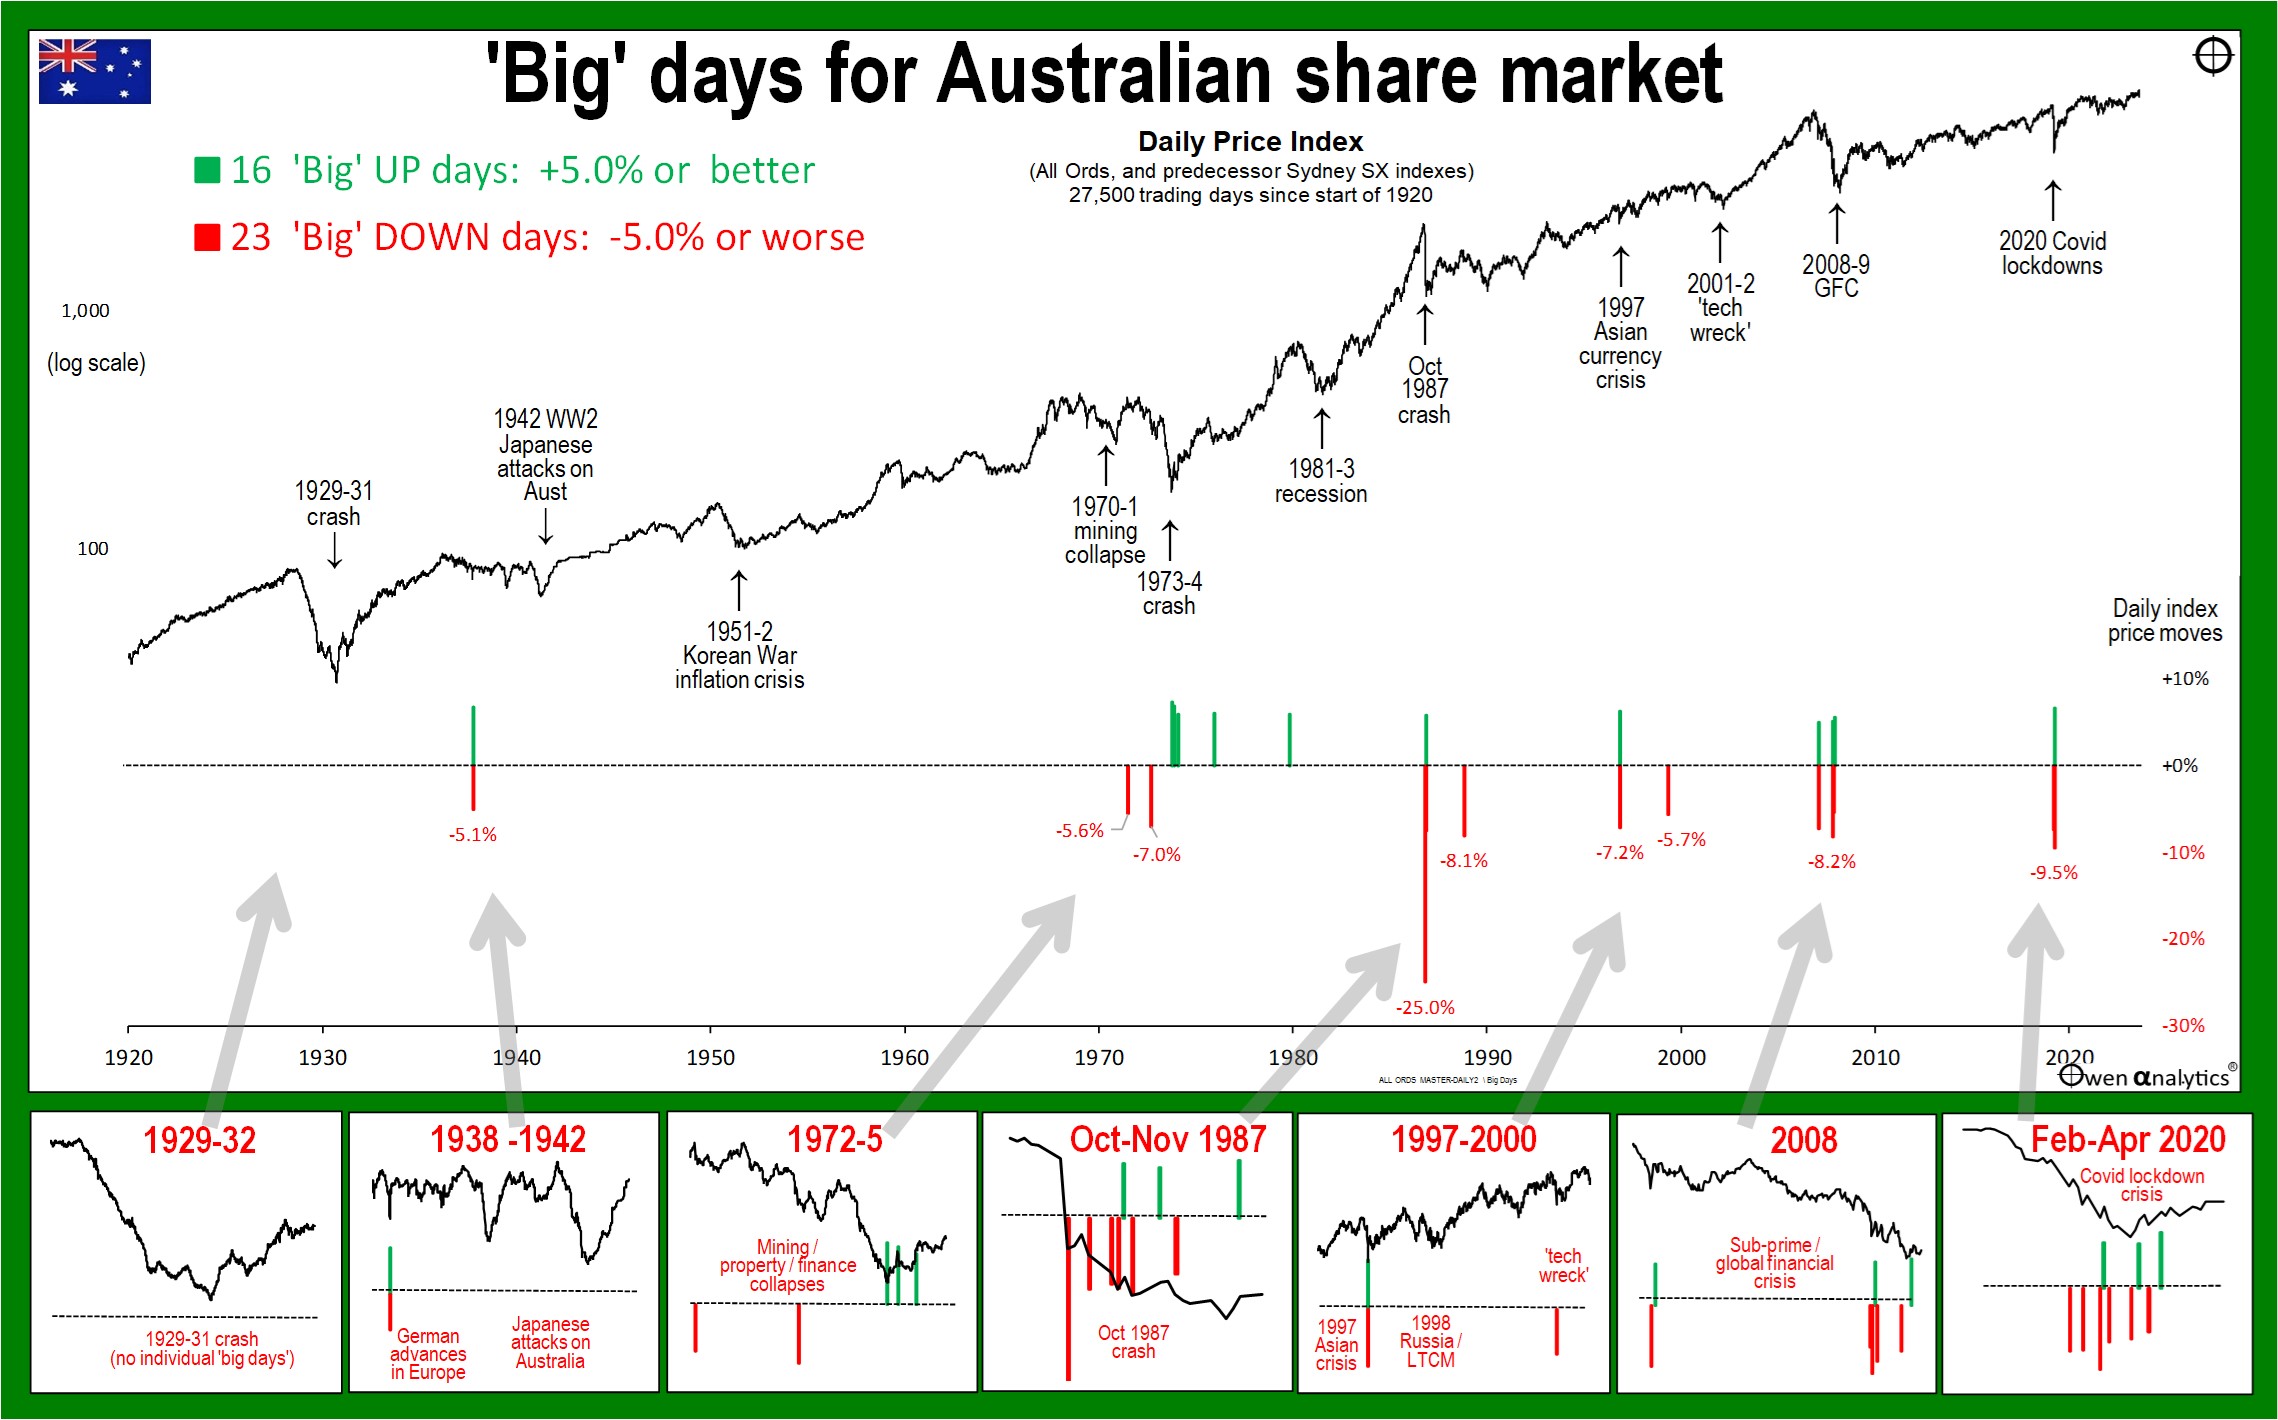
On Monday of this week (5th August 2024) the Australian share market fell by -3.8%, the worst day in four years. As media headlines were starting to get carried away with scaremongering headlines, I did a story that night pointing out that it was actually barely a hiccup in the scheme of things, and there have been literally dozens of worse days on the ASX over the years.
Monday’s fall only seemed dramatic because share markets had been unusually calm for the past few years.
Here’s a link to Monday’s story, which featured a chart highlighting the really ‘bad’ days (falls worse than -5%) over the past century:
· BIG days on the Australian share market – but how bad was it? (5 Aug 2024)
In response to that story, many people asked what were those really ‘bad’ days, and what caused them.
Today’s story details the 23 days when the broad Australian market fell by -5% or more over the past century. It describes the main triggers for each fall, and what happened on Wall Street.
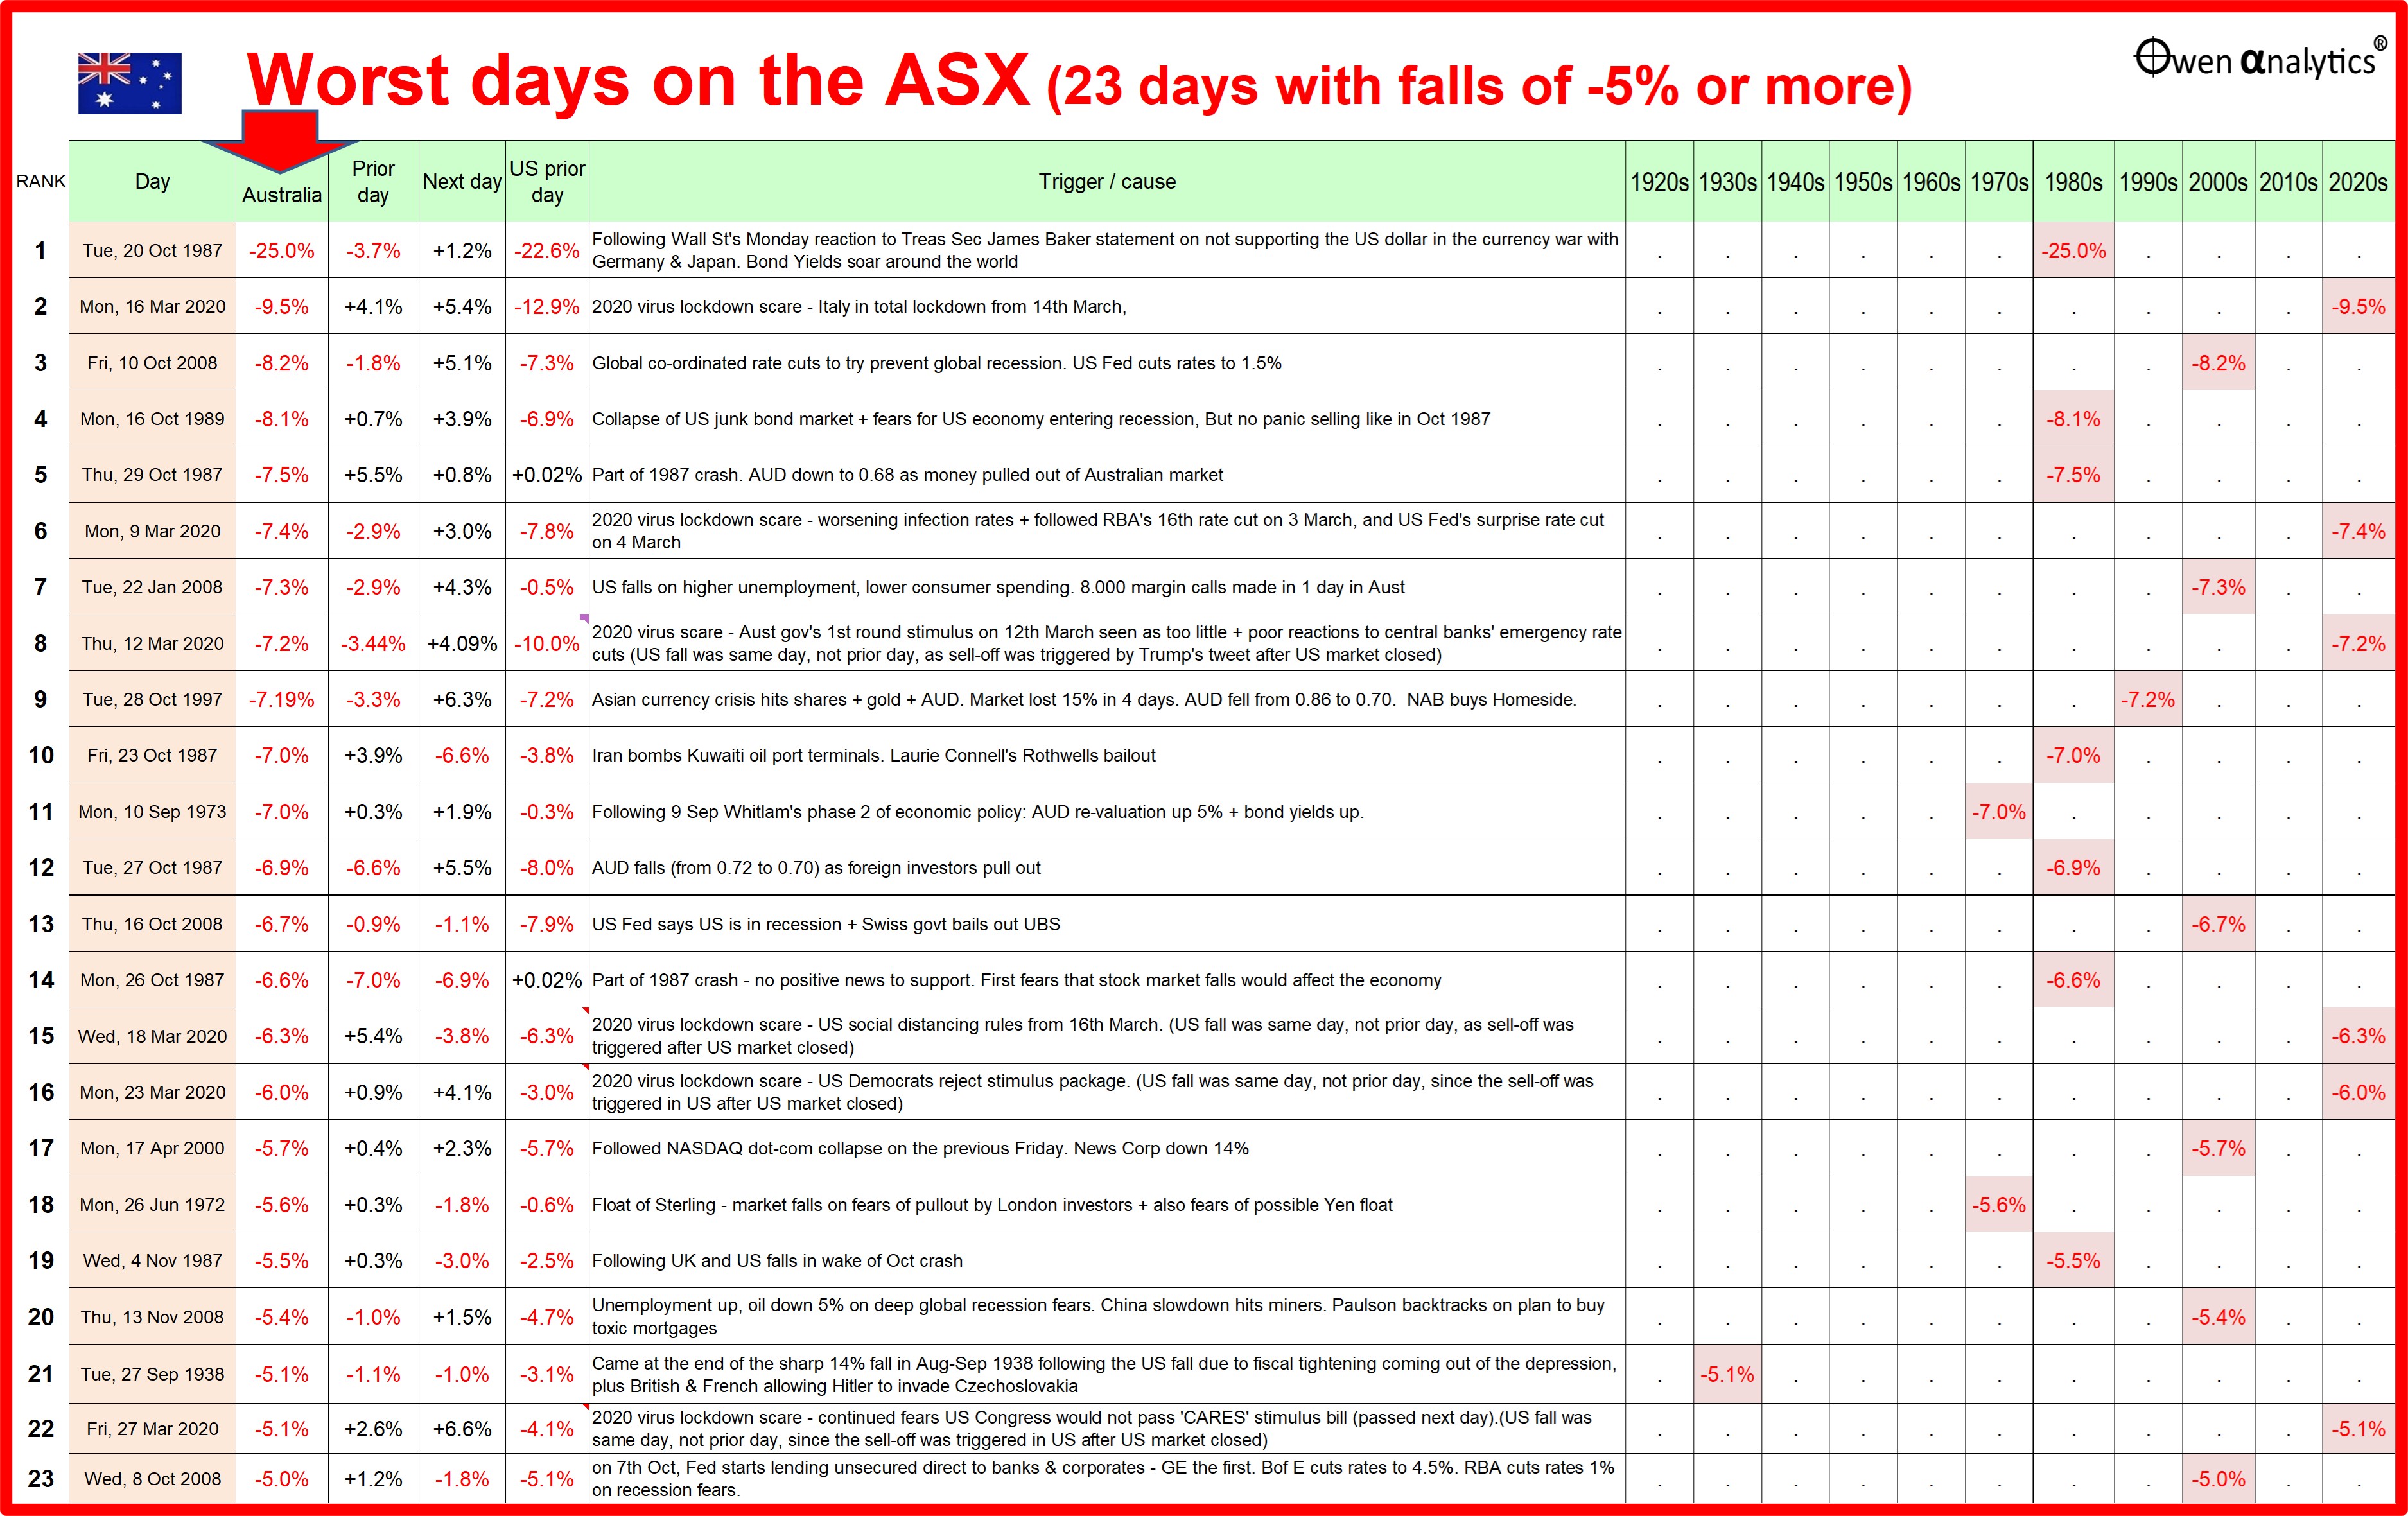
Of these ‘worst’ 23 days with falls of -5% or more:
-
- 7 were in the 1980s – of which 6 were in the September-November 1987 crash. The other one was almost exactly two years later in 1989. The market was spooked by fears of another 1987-style crash on its second anniversary (so much for ‘rational’ markets!), but it did not eventuate of course.
-
- 6 were in the 2008 ‘sub-prime’ crash / ‘global financial crisis’ leading up to and following the Lehman bankruptcy.
-
- 6 were in the February-March 2020 ‘coronavirus’ lockdown scare.
-
- 2 were in the early 1970s double-barrelled mining/property finance crash.
-
- Only one of the worst 23 days was in the 1990s – and this fell exactly 10 years after the 1987 crash. As in 1989, the irrational market was spooked by fears of another major crash on the 10th anniversary of the 1987 crash.
-
- Only one of these worst days was in the 1930s, and that was in 1938 after the British and French allowed Hitler to invade Czechoslovakia in the lead-up to World War 2.
None of these ‘worst’ days occurred during the 1929 crash, the 1930s depression, nor in the 1940s (WW2 itself), nor in the 1950s or 1960s.
(A note on WW2: Between March 1942 and December 1946, the federal government imposed limits on share price movements on all stock exchanges in Australia, mainly to prevent war-time profiteering. Had it not been for these share price controls, the local share market would have done even better than it did during the War. I cover the Australian share market during WW2 in separate stories.)
None in the 1929-31 crash?
This is one area in which the Australian share market differed from the US market. The Australian market followed the US market down in the 1929-31 crash, but was significantly less volatile for Australian shares than it was for Wall Street. Australian fundamentals were better for most of the 1920s boom, and local market was far less inflated by speculative fever or margin lending than the US market.
In the early part of the 1929 crash, the worst days on the US market were -22.6% on Monday 19th October, (which is still the worst ever single day on Wall Street), followed by a fall of -13.5% on Monday 29th October, and another -11.7% on Tuesday 29th.
In contrast, the Australian market shrugged off the big daily falls in the US market in October 1929 as investors here assumed Australian companies would be largely unaffected by the US crash. In contrast, the worst day in Australia in 1929 was a relatively mild fall of -3% on Friday 13 December 1929 (Friday 13th of course!).
However, despite lower price volatility here, the 1929-31 crash did turn out to be our deepest share market crash, even worse than 1987, but not nearly as deep as Wall Street’s crash. I cover this in a separate story.
Worst day for the ASX
The worst single day on the ASX was a fall of -25.0% on Tuesday 20th October 1987. This was worse than Wall Street’s worst ever day, but not as bad as the combined fall on Wall Street in October 1929, described above. (I cover the 1987 crash in a separate story).
(On the morning of 20th October 1987 I was in a cab with the three fellow directors of our little investment firm, on the way into the ASX to watch progress on our fourth IPO we floated in the boom preceding the crash. (This was before the age of internet or even mobile phones - and the ASX had an actual trading floor!) We were sellers in the boom, and buyers in the bust – I was well trained!)
“If you missed the X best (or worst) days in the market…”
Many readers will have come across reports and promotional videos that make claims like:
· ‘If you missed the 10 worst days you would increase your returns by x%!’, or
· ‘If you missed the 10 best days you would decrease your returns by y%!’.
These types of claims are often used to support trading systems that claim to be able to miss the ‘worst days’, and/or be able to jump into the market to get the ‘best’ days.
They are also often used to prove the claim that ‘time in the market’ (‘buy & hold’) is better than ‘timing the market’.
These claims may be theoretically accurate, but they assume that you are able to: (a) know in advance which are going to be the best and worst days, (b) get into (or out of) the market immediately before the best/worst days at the exact closing price the day before the big day, and then (c) get out (or in) at the exact closing price on the big day itself! (and do it all with no brokerage, fees, or taxes.)
This is physically impossible in real life of course, but it does not stop marketers from running those silly stories after big days.
The other big problem with these theoretical claims is the fact that the best days in the market are almost always the very next day after the very bad down days. The only way to obtain the big ‘up days’ is to have just taken a hit on the big ‘down day’ the previous day. Japan’s Nikkei225 index did precisely this on Monday 5th and Tuesday 6th August this week.
The lesson is – ignore silly marketing fluff based on impractical theories that are impossible to replicate, and focus instead on what drives markets in the real world, and what you can actually do in practical terms.
Clusters, not random
This table also confirms the fact that in the real world, big days occur in clusters, during relatively short periods of high turbulence and volatility. They are not ‘randomly distributed’ as claimed in finance textbooks and academic theories.
In the real world, markets are far from random, because they are driven by human nature. Humans always have been, and always will be driven by herd instincts and wild emotions, not rational logic, so investment markets will always lurch from wild panic-buying booms to wild panic-selling busts.
Long periods of relative calm
In between these occasional periods of high volatility in general market panics, there are long periods of relative calm. These are periods when investors become complacent, ignore risks, and bid prices up to unsustainably high levels on the assumption that ‘this time is different!’
Unfortunately, it never is, of course. Irrational over-confidence in the wild booms sooner or later always turns into irrational over-pessimism in the wild busts that always follow booms.
The next big correction
In the last story I suggested that the current market mini-mini-correction is probably not going to be the next big sell-off or major correction – at least probably not yet anyway.
But a major correction is certainly coming sooner or later – to unwind the current level of over-pricing and speculative fever, especially in US shares (the Australian market always follows the US market down in crashes).
For over-pricing of the US market see:
· US Shares: 'double-whammy' of over-pricing, but how serious is it? (27 Mar 2024)

· US shares vastly over-priced and primed to fall – but what will be the trigger? (US ‘CAPE’ ratio update) (22 April 2024)

‘What happened next?’
Watch out for my next story in a few days - about what happened immediately after these ‘worst’ days in the share market. The answer may surprise you!
‘Till next time – happy investing!
Thank you for your time – please send me feedback and/or ideas for future editions!