Here is our quick snapshot of Australian and US share markets, short-term interest rates, bond yields, and the AUD -
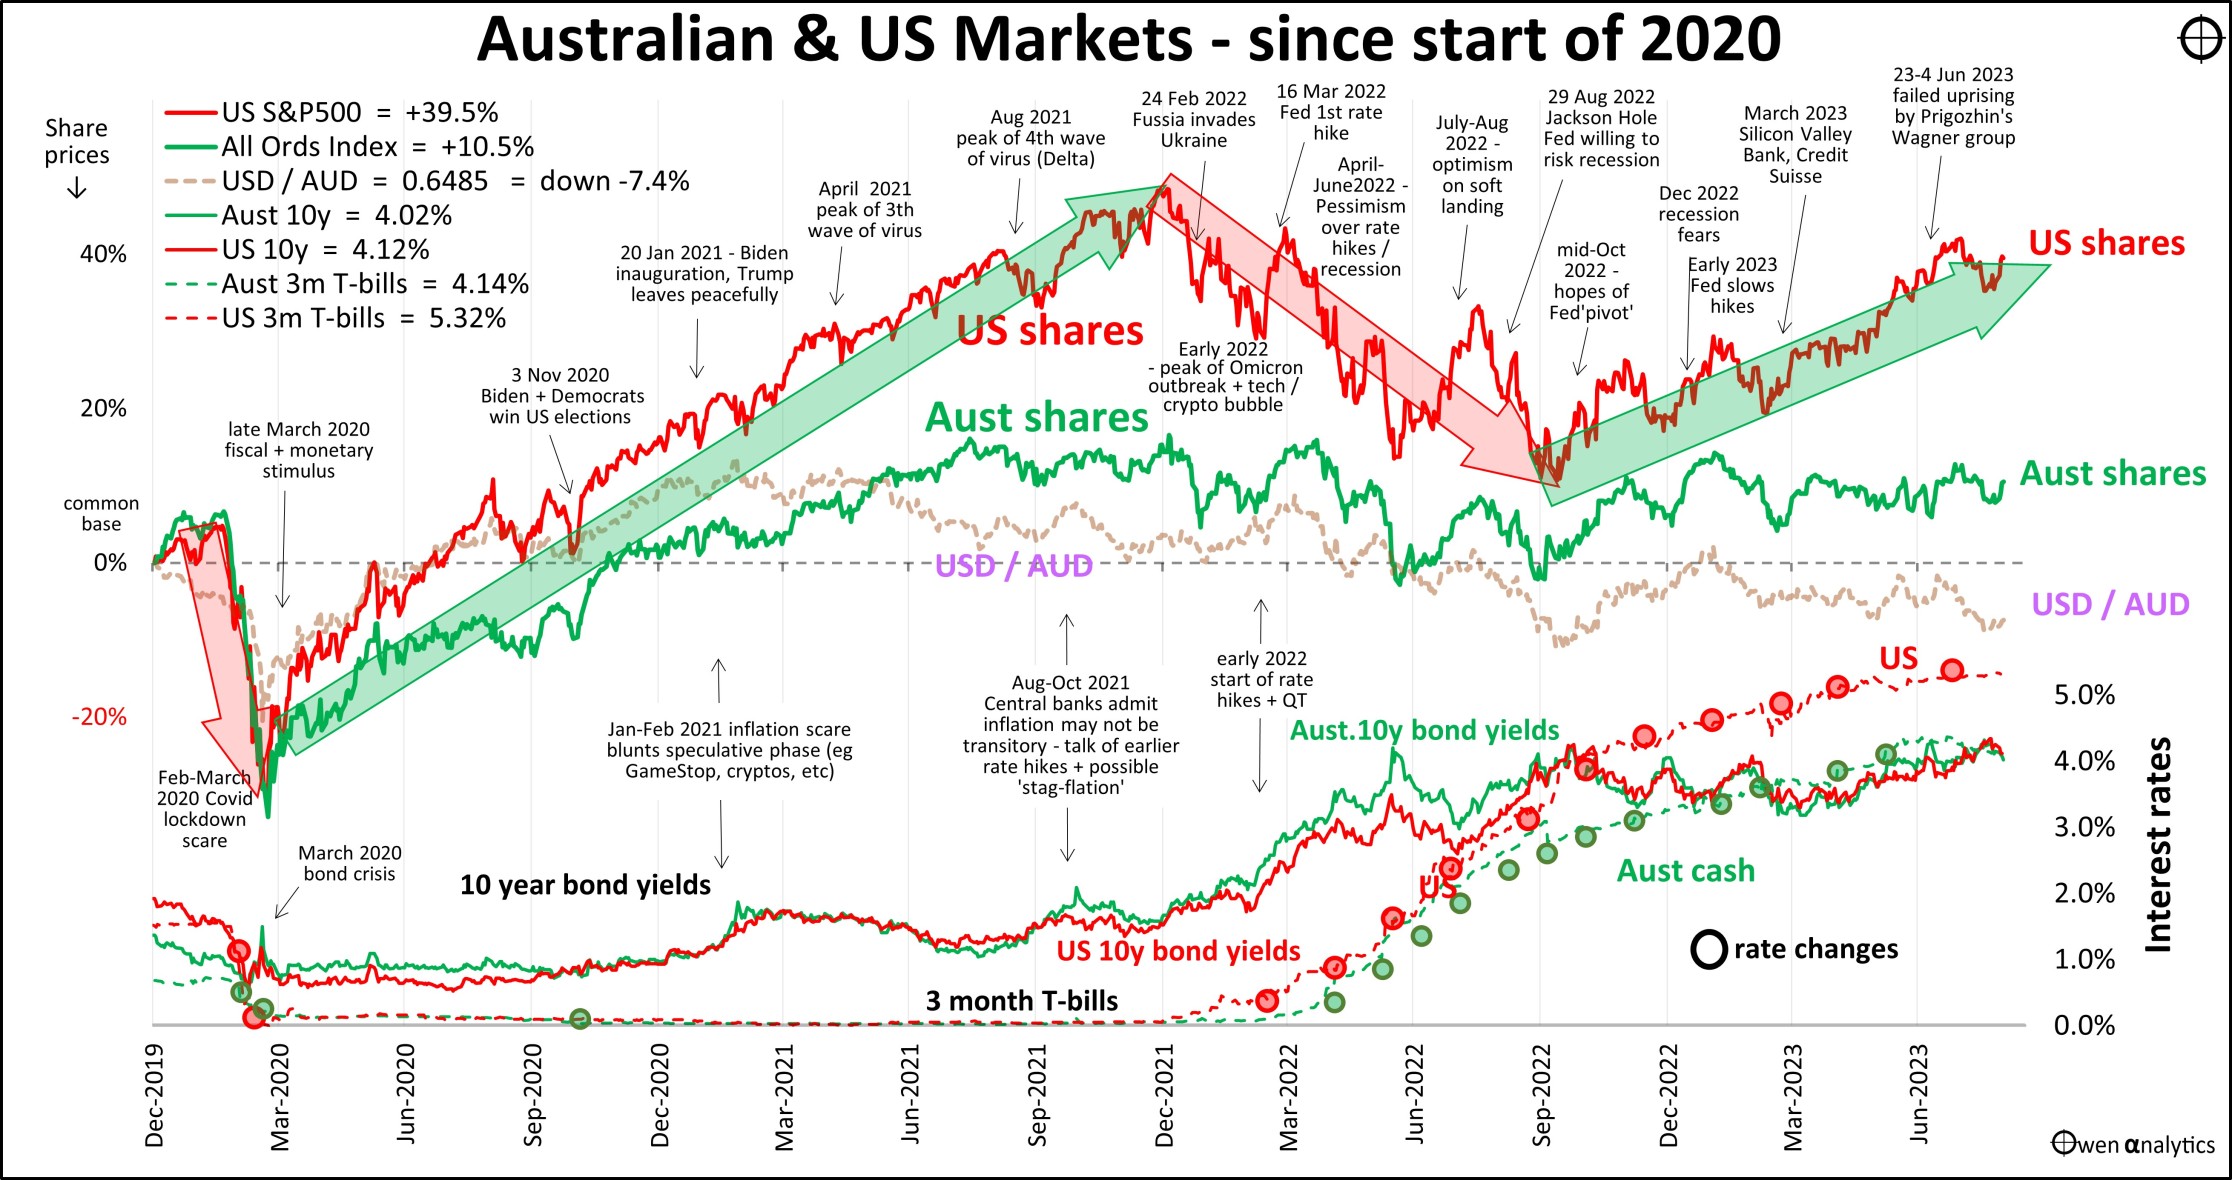
Australian & US share markets, short-term interest rates, bond yields - USD/AUD exchange rate
Key developments in August included -
- Share markets lower across the board – profit taking, plus fears of sticky inflation.
- Rate hikes slowing – with inflation receding further, but central bankers warning they are not done yet.
- Bond yields – up a little in the US, but flat in most markets – fears of sticky inflation, not deep recessions.
- Commercial property – more cuts to prices & valuations, more funds defaulting, freezing redemptions.
- Australian Housing – prices being supported by tight supply and strong immigration.
- Debt stress – the ‘mortgage cliff’ handled well so far without major outbreak of widespread foreclosures. More developers failing.
- China – widening of the property/construction/finance crisis. Some minor support measures from Beijing, but nothing major yet.
- Commodities – mixed in August. In this report we look at the post-Covid commodities bubble/bust.
- Aussie dollar – lower in August. Focus in this report: “What’s keeping the AUD down?”
Inflation & interest rates
Inflation, and central bank responses to it, are still the biggest drivers of global sentiment affecting all markets – shares, bonds, property, currencies, spending, lending. The good news is that inflation rates continue to recede from their 2022 peak levels.
With inflation heading back toward target ranges, central banks have more or less paused interest rate hikes but are still warning of more cuts ahead if inflation is not contained. The exception is Japan, which has yet to get off the mark.
Wages are on the rise, but it is to pay for price rises, not higher productivity, which has stalled everywhere. Higher productivity lifts real living standards, but wage rises without productivity gains just increases prices/inflation further.
In the US – the annual inflation rate (black line) is down to 3.3%, but the annualized rolling 3-month rate (orange) is just 1.9%:
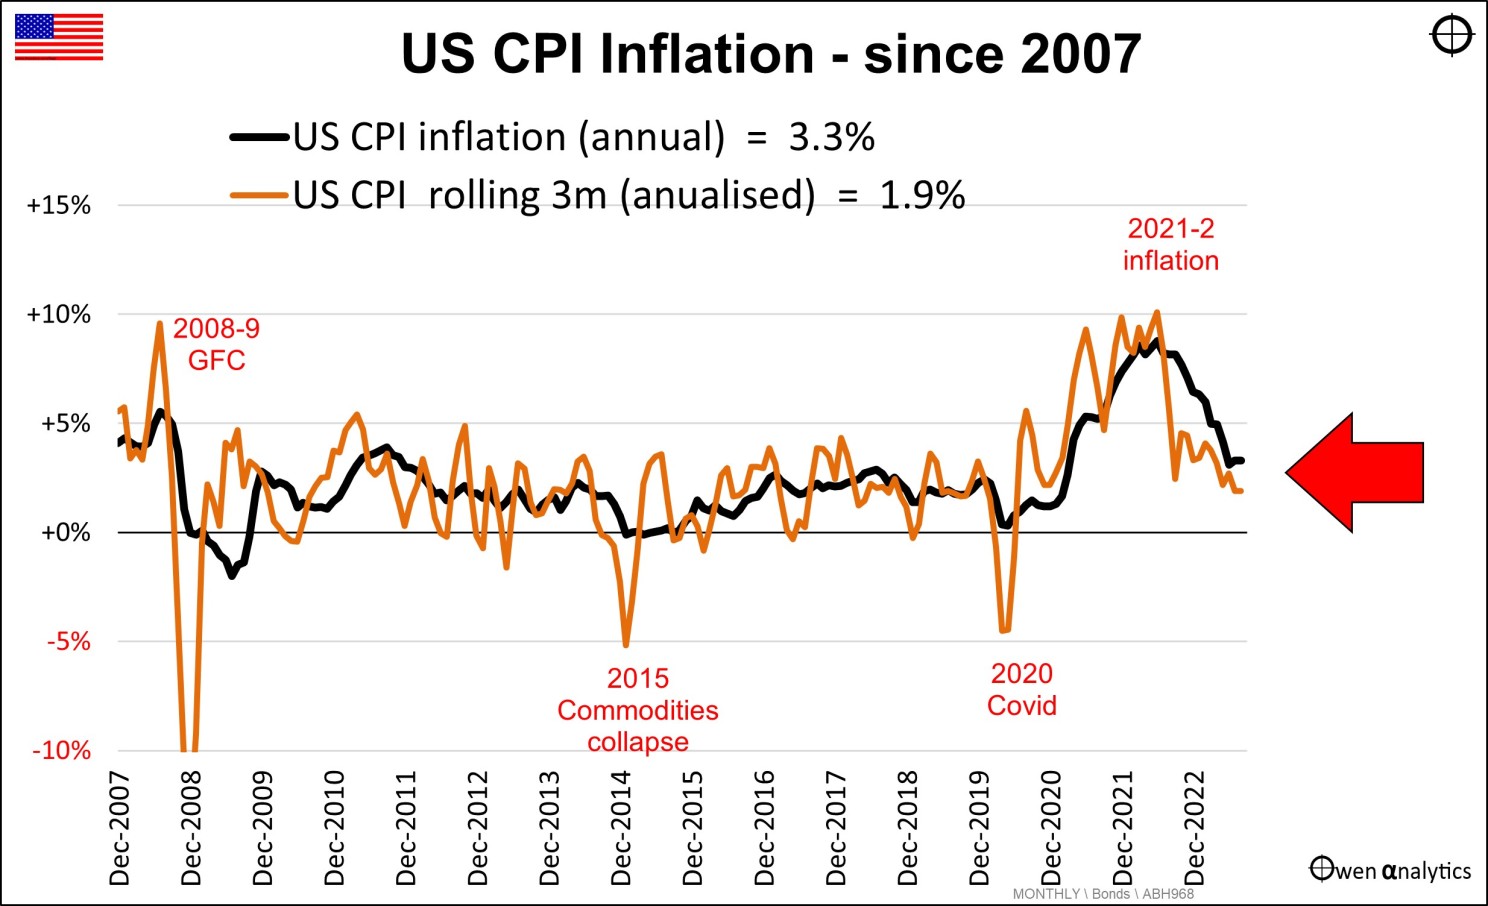
US inflation - annual rate + rolling 3 month rate
In Australia, the official annual rate is still a very high 6%, but the annualized rolling 3-month rate is down to 3.6%:
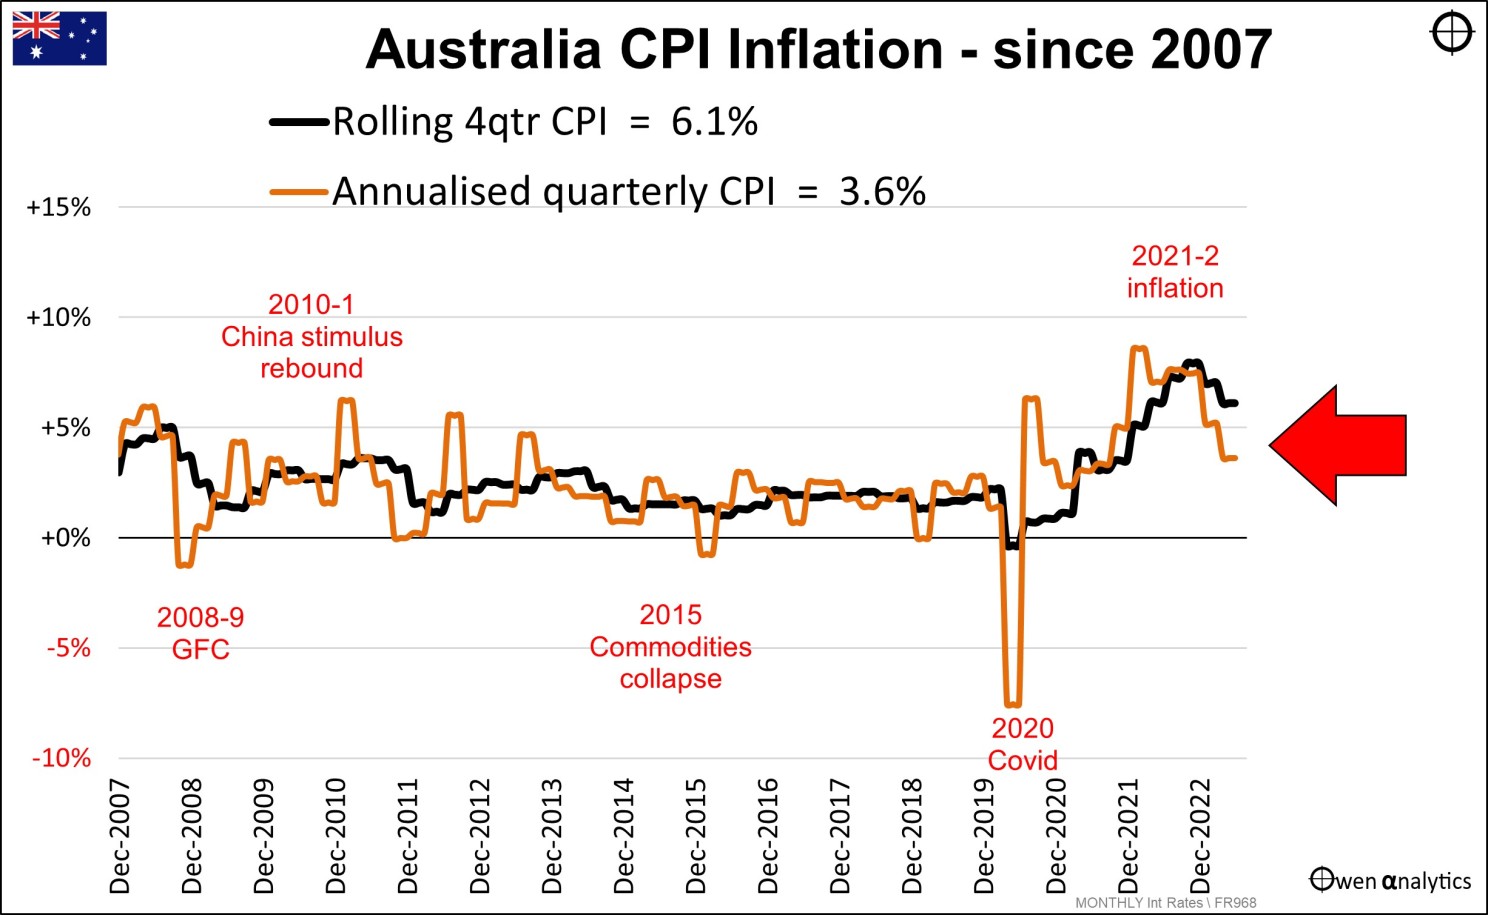
Australian inflation - annual rate + rolling 3 month rate
The UK is a similar story - with headline inflation at 6.8%, but the running rate is now back to zero, and the economy has stalled. Europe is worse – with inflation still problematic, but stalling economies, including Italy in back in recession. On the other hand, inflation is running at 3.3% in Japan, but the Bank of Japan is still running negative cash rates.
China’s economy has stalled, with negative inflation, falling imports, exports and production, and a worsening property crisis. Xi Jinping has announced a handful of minor support measures, but no major stimulus measures like 2009 or 2016.
Unemployment
Unemployment rates are on the rise – up to 3.7% in Australia, 3.8% in the US, 4.2% in the UK, 6.4% in Europe, 5.5% in Canada, 5.3% in China. Youth unemployment in China is so high (probably well above 20% and climbing fast) that China has simply stopped reporting the numbers, for fear of rising unrest, on top of festering unrest over falling property prices and the failure of several retail unit trusts (‘wealth management products’) that lend to failing property developers.
Share markets
August was a negative month for shares virtually across the board – as investors took some profits after two strong positive months in June and July.
In this section we have three charts - the performance for the latest month (middle chart), last calendar year (left), and the current 2023 year to date:
Countries – All major markets lost ground in August:
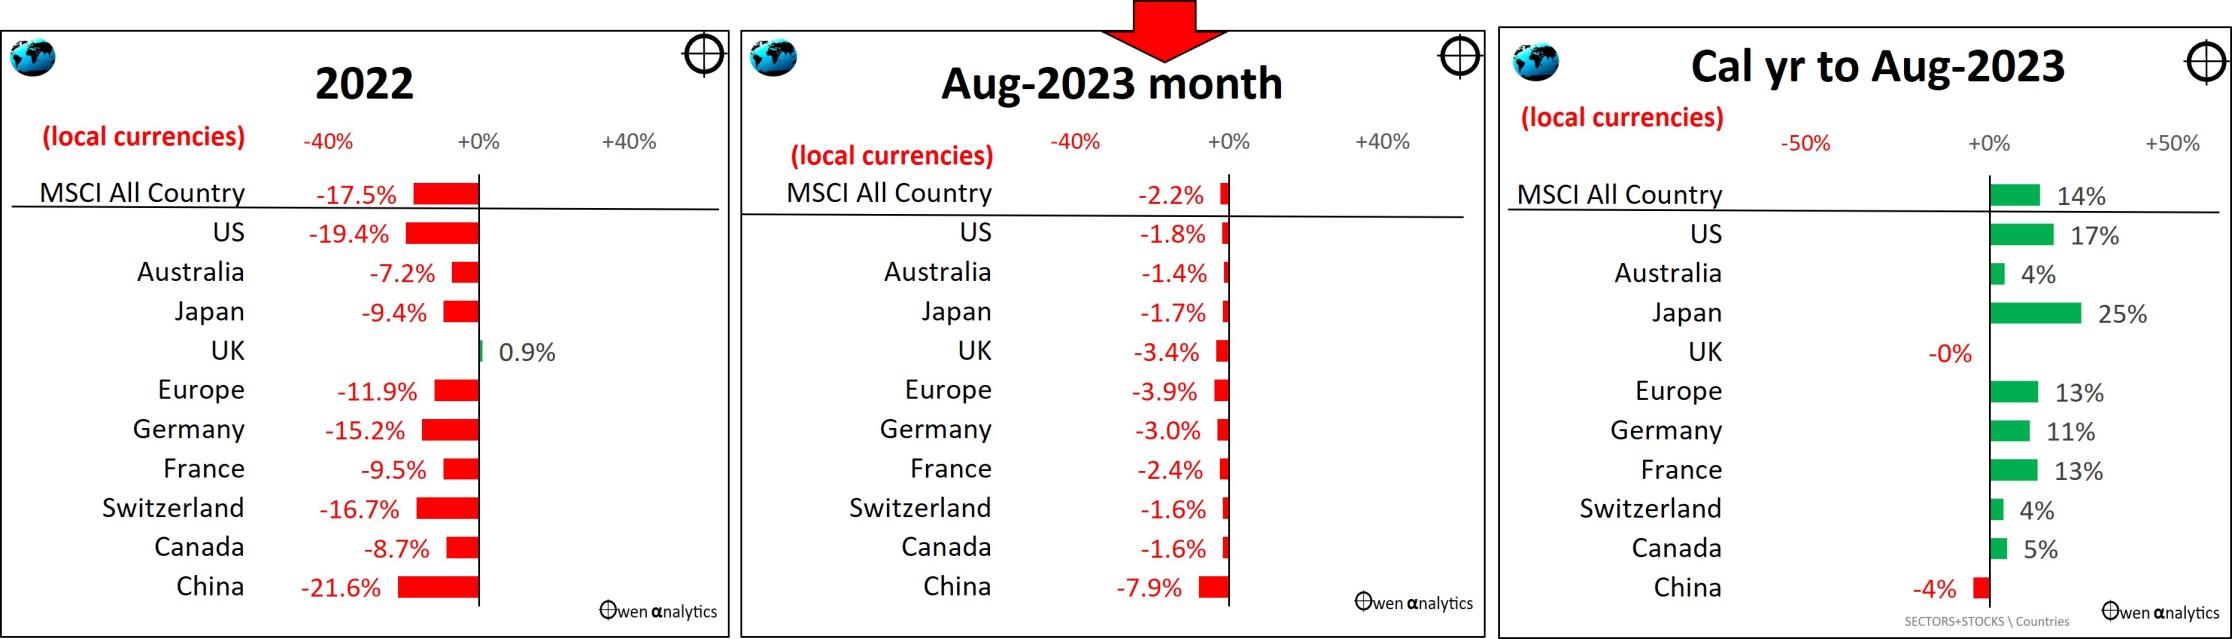
country share market indexes
In the right chart we see that, so far this year, stock markets are yet to recover their declines in 2022 (aggressive rate hikes). The only main country ahead over the two years is Japan, thanks to its artificial suppression of the Yen. Next best is the US, thanks to the tech revival.
See - Where are we now? – Global Profits: Recession or Rebound?
Industry sectors -
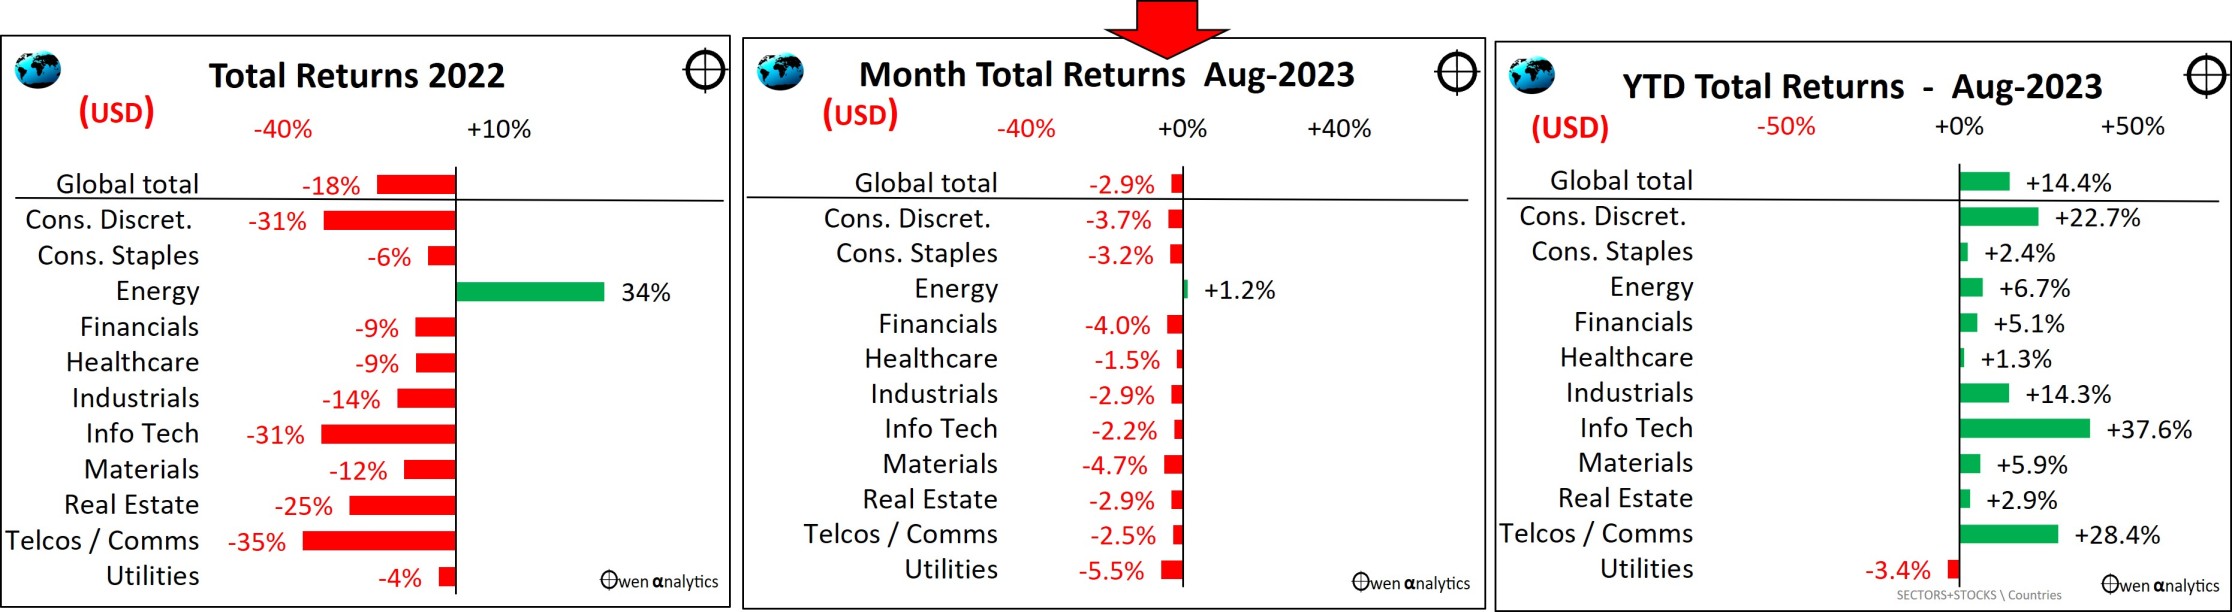
share market sectors
All industry sectors were down in August, except for fossil fuel producers (‘energy’), as prices of oil, gas and coal rose during the month on hopes of global soft landings. (see next section below on the commodities boom/bust)
Notice how the UK was the only market to survive the 2022 sell-off (left chart in the previous set of charts) because fossil fuels was the only sector to rise in 2022.
Year to date (right chart above), the tech/online/A.I. boom stocks are spread across three sectors:
- ‘Discretionary’ (Amazon, Tesla),
- ‘Tech’ (Apple, Microsoft, Nvidia, Adobe), and
- ‘Comms’ sector (Meta/Facebook, Alphabet/Google, Netflix).
The other sectors (aside from fossil fuels) are still well below the start of 2022.
Companies - global -
US companies dominate the list of world’s largest listed companies (former Chinese stars Alibaba and Tencent are long gone from the top 10 list).
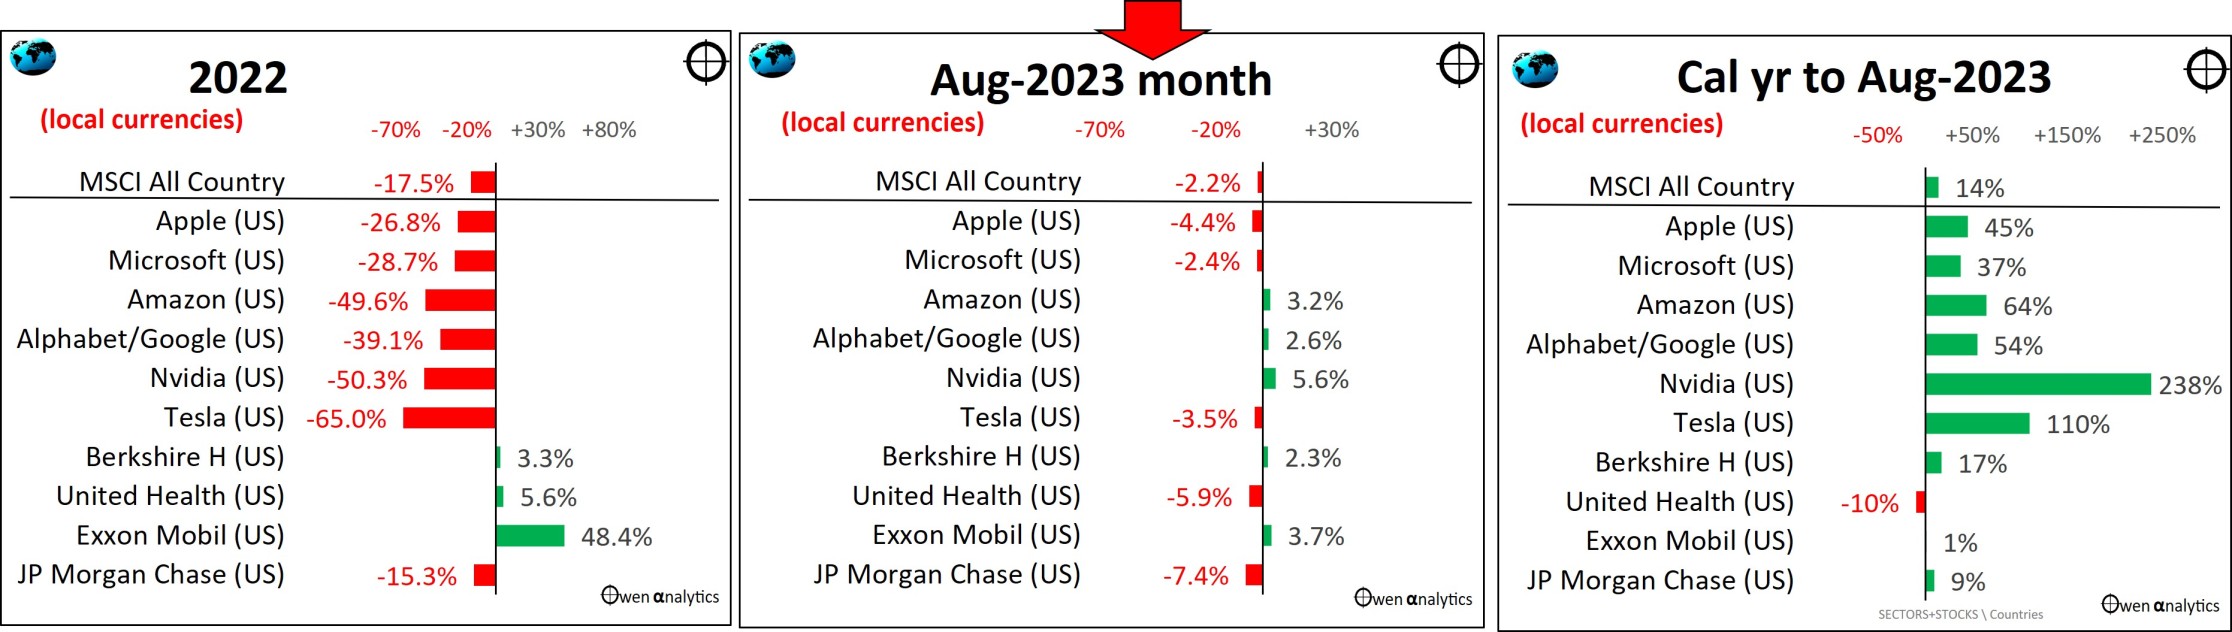
global top 10 shares
All of the majors have recovered their 2022 price declines – except United Health and JP Morgan.
The stand-out this year is Nvidia, the A.I. hot stock of the year, as its H100 chip (packed with 80 billion transistors on each chip) is the chip of choice for A.I. applications globally.
See - Where are we now? – US Profits: Recession or Rebound?
Companies - Australia -
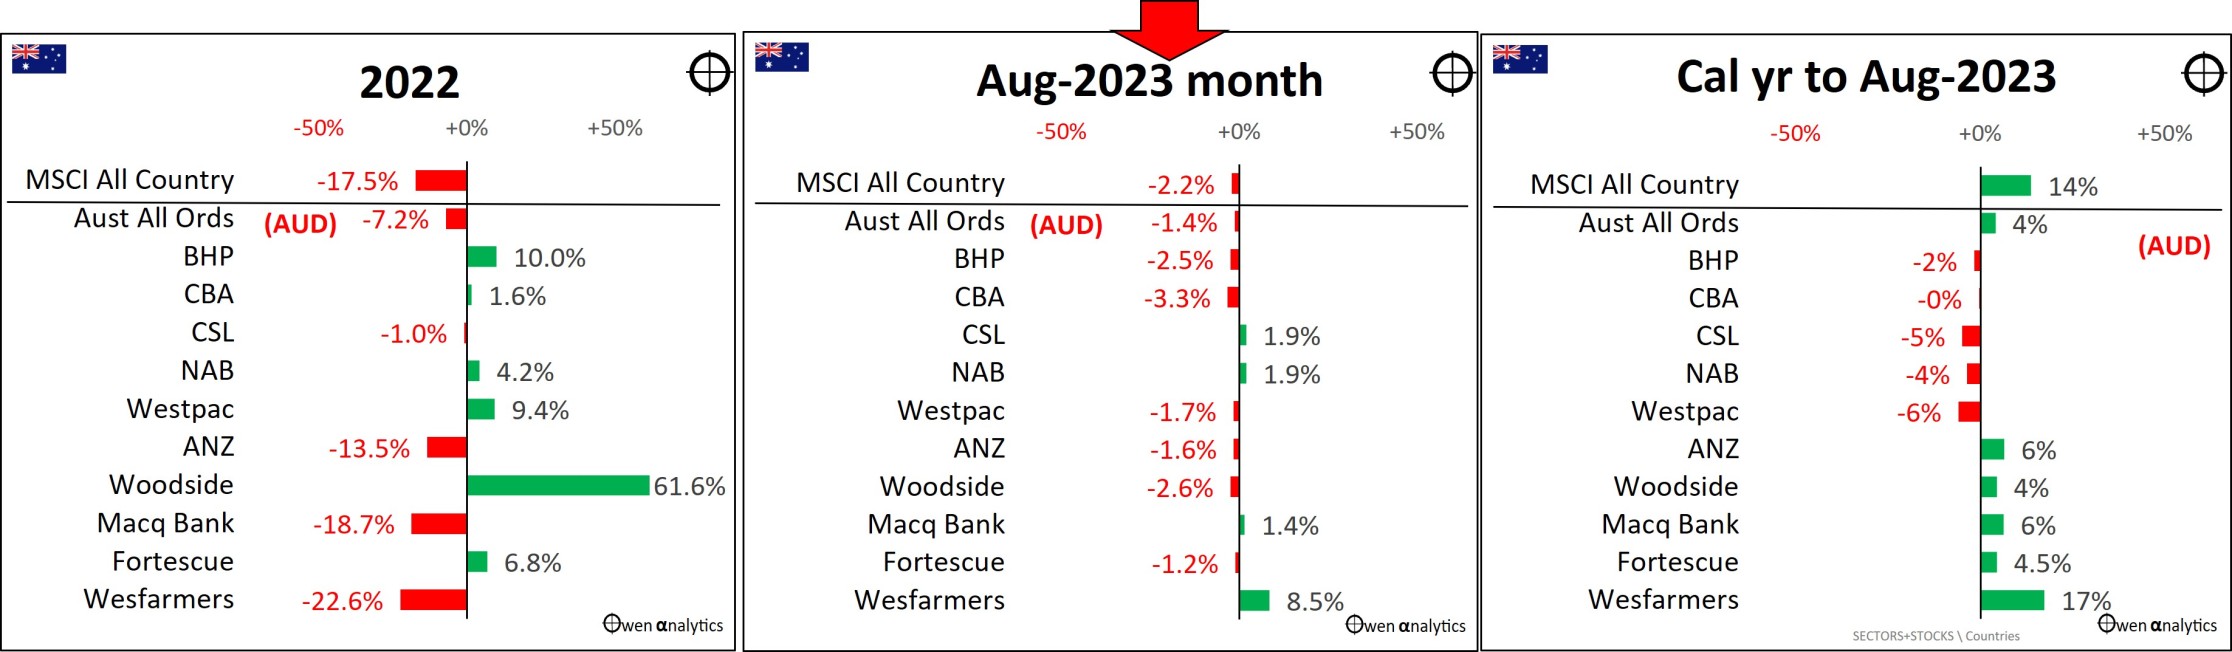
Australian top 10 shares
The Australian share market held up better than most other countries in 2022 (thanks mainly to fossil fuel and iron ore producers, mainly Woodside and BHP), but Australia has been a global laggard this year.
So far this year, Wesfarmers is the main standout, with its retailers (Bunnings, Kmart, Officeworks, and now Priceline) holding up relatively well despite rising interest rates and costs.
For a rundown of the August ASX reporting season – see ASX reporting season in 4 charts - $40b wiped off profits! - where did it go, and why?
Commodities – bubbles deflating
August was a mixed month for commodities prices -
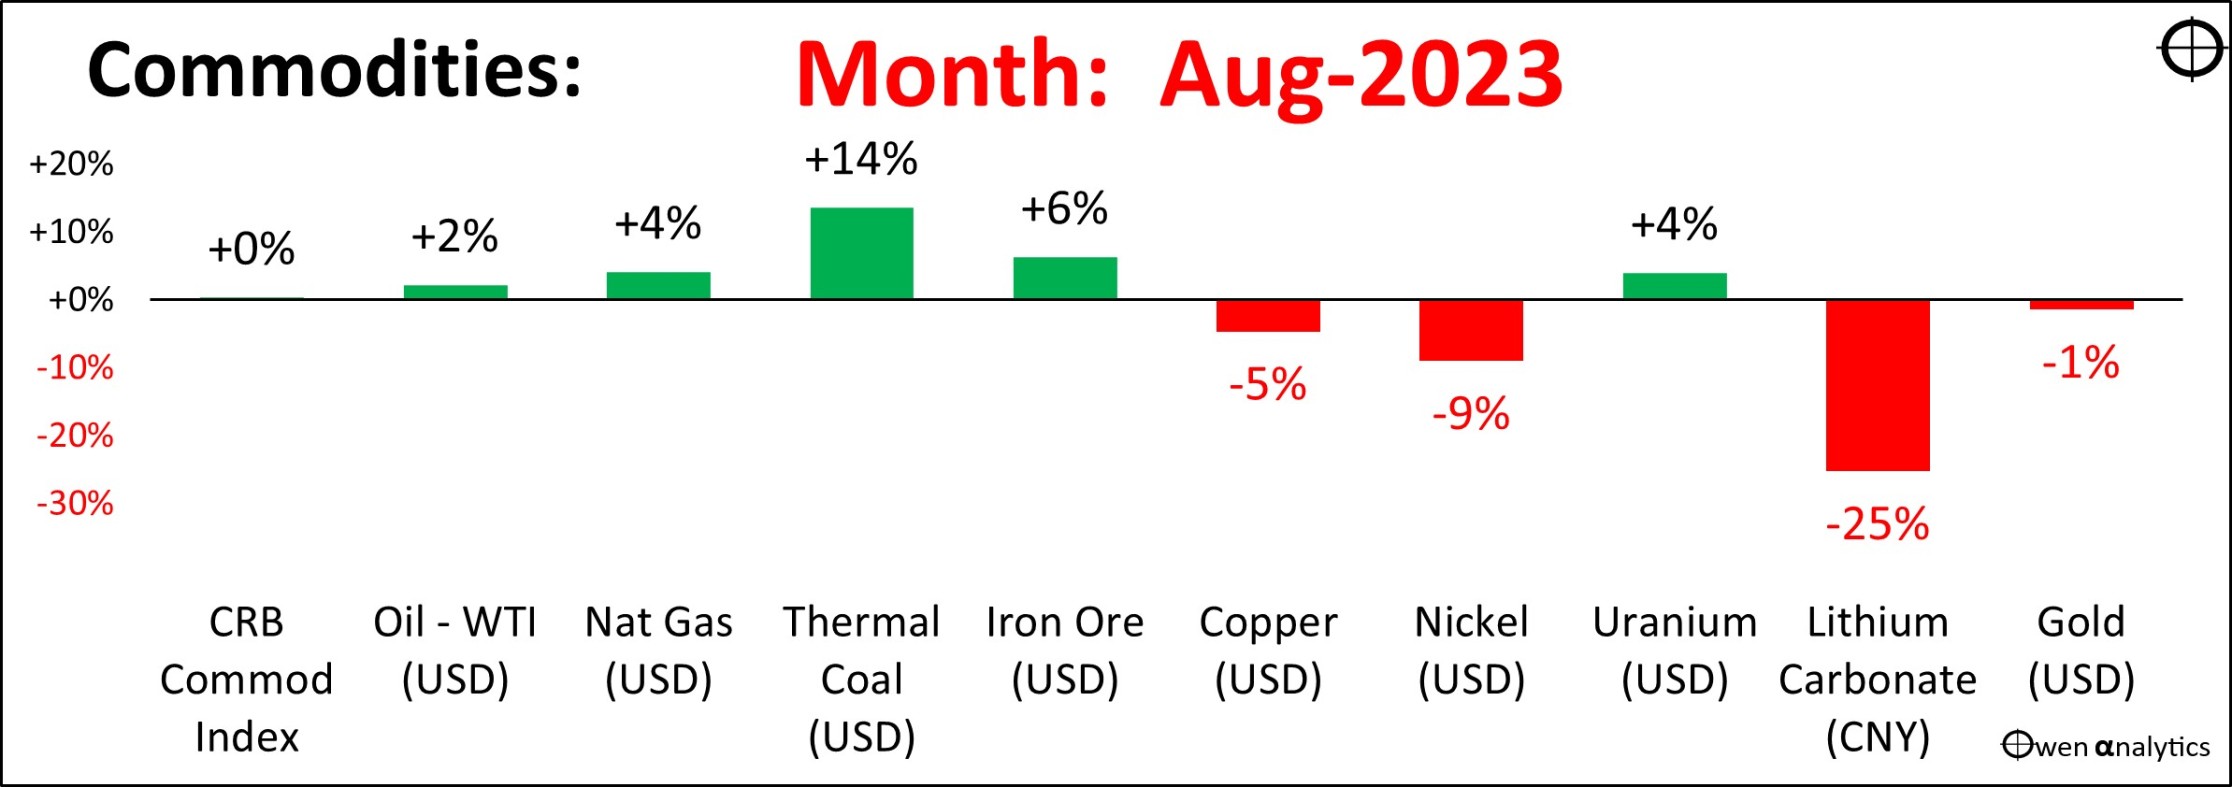
Commodities prices - August
Oil was up a little on stronger growth outlooks (receding fears of hard landings), and signs of Chinese stimulus, which also boosted iron ore. Gas prices rose mainly due to the offshore gas workers’ strike on WA’s North-West Shelf, which has become a major supplier to Europe since the Russian sanctions. Battery metals prices continued to slide, due to weak EV sales and increased production.
The BIG picture –
We can get a much better view of the commodities story by looking at prices over the past few years, starting from a common base at the start of 2020, before Covid changed the world.
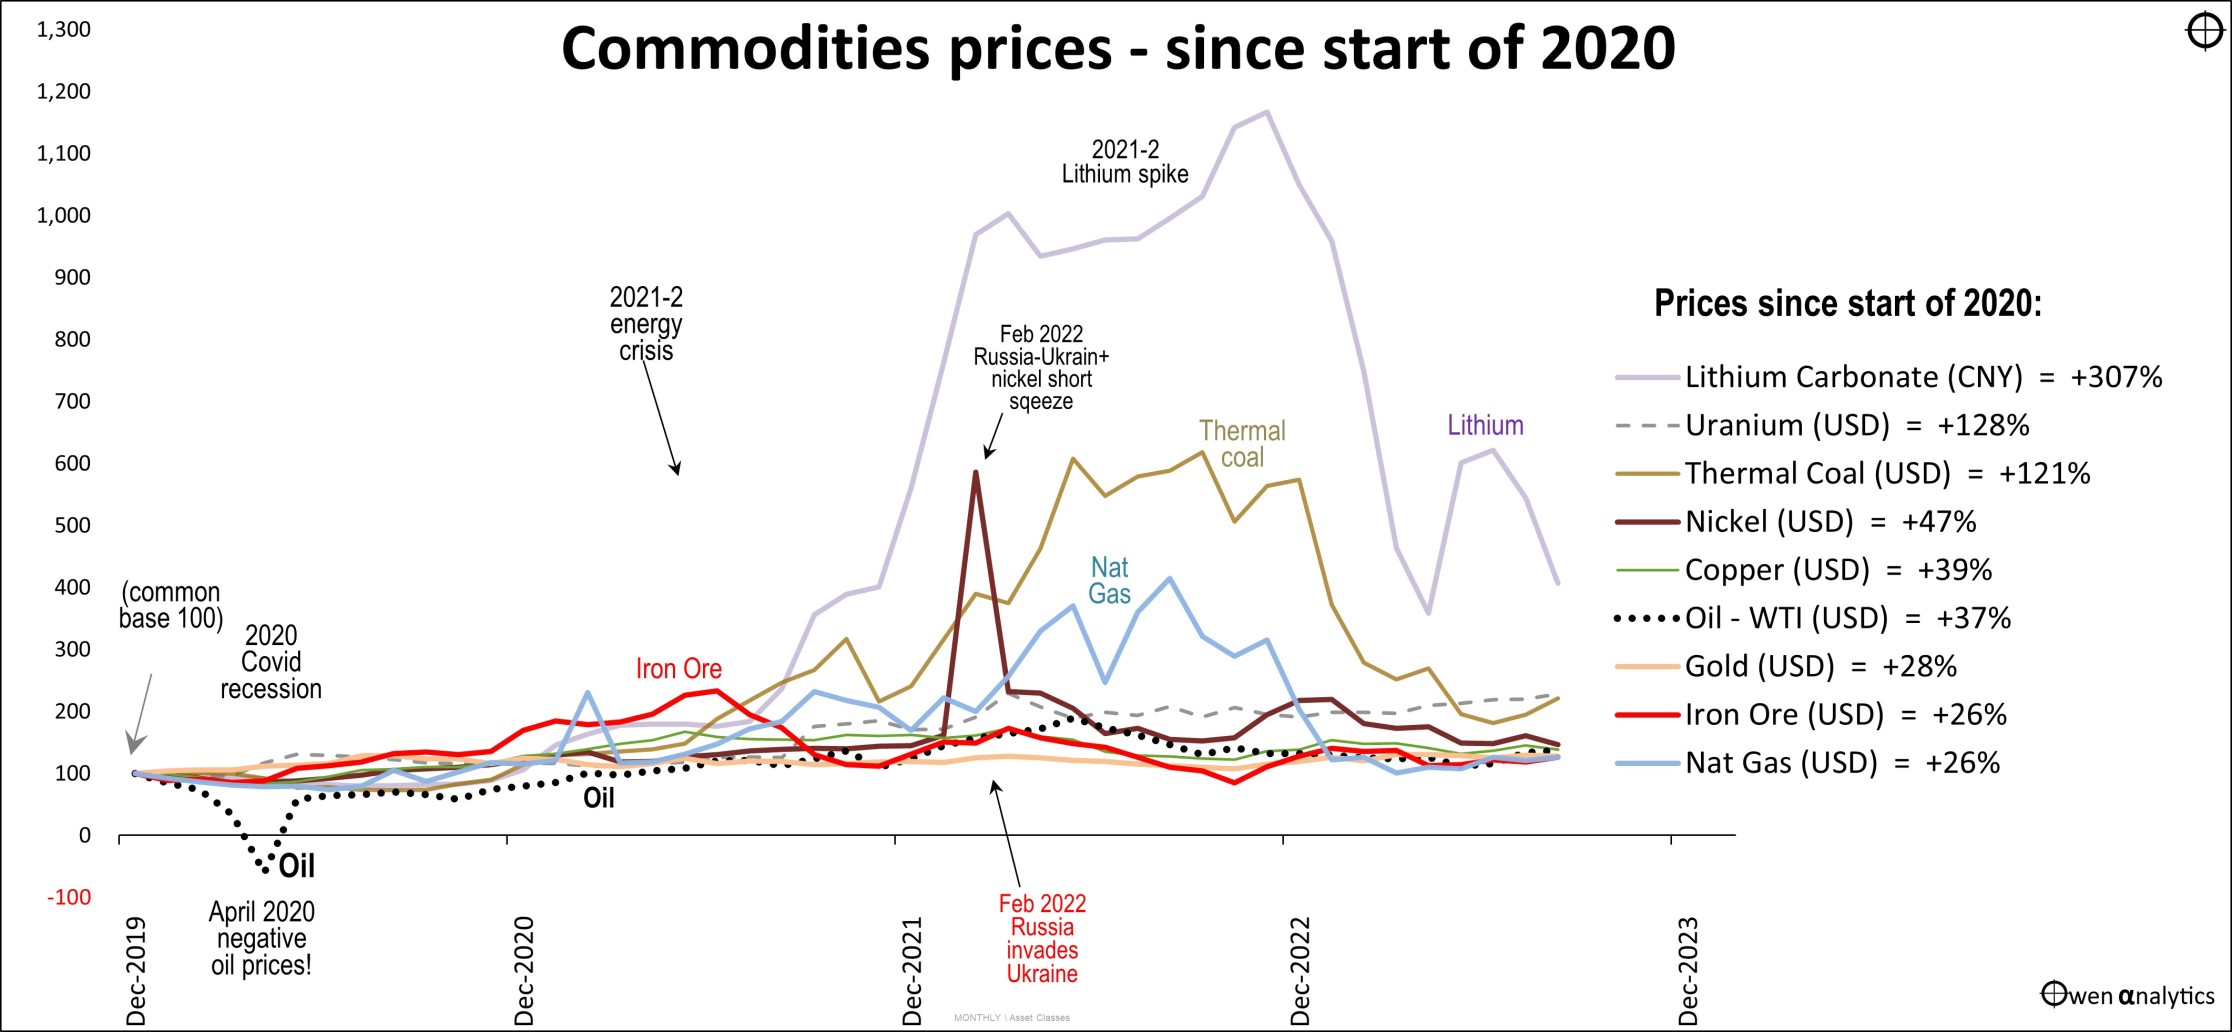
commodities prices since 2020
Most investors focus on the demand side of the commodities equation – the demand for energy, demand for industrial metals, demand for electric vehicles, etc.
The problem is that almost all of the swings in commodities prices (and share prices of commodities explorers and producers) are due to what happens on the supply side.
OPEC production wars sent oil price negative in 2020. Mine disasters in Brazil sent iron ore soaring in 2021. Covid port closures in South Africa and Russian sanctions in Europe sent coal soaring in 2021-2. Nickel prices soared after Indonesia banned exports, and a short squeeze following the Russian sanctions. Nationalizations of lithium mines in Mexico and Chile sent lithium prices through the roof.
Many investors saw rising prices as proof of their theory on strong demand, and jumped into anything and everything that had a hint of their chosen hot mineral. Explorers and producers saw prices rising and they accelerated their exploration and new mine development to try to cash in on the booming prices.
The result is always the same in every commodity boom – prices collapse when temporary supply restrictions are resolved, and new supply comes on stream. Making things worse this time is weakening demand for electric vehicles in China.
Today, commodities prices are still well above what they were three years ago, but production volumes are much higher, and costs have soared.
As with all forms of investment, timing is everything!
The Aussie dollar: "What’s keeping the AUD down?"
This is one of the most common questions I have received in recent months.
The Aussie dollar fell against all major currencies in August. Year to date, the AUD is down against all currencies except the Yen and Chinese RMB.
In the case of the Yen, it is because Japan is the only country left using aggressive QE and suppression of its interest rates and currency. In the case of the RMB, China is engineering the RMB lower to try to revive exports, and also lower interest rates to try to stimulate spending and borrowing in the property construction / finance crisis.
The AUD rises and falls as a ‘risk’ asset
The first chart at the top of this month’s report illustrates how the USD/AUD exchange rate (beige dotted line through the middle of the chart) essentially follows share markets most of the time as both are ‘risk’ assets. The AUD and shares rise together in ‘risk-on’ rallies, then falling together in ‘risk-off’ corrections.
August was a negative month for shares, so the AUD naturally fell, as per the usual pattern.
While this is true on a day-to-day, week-to-week, and month-to-month basis, it does not explain why the AUD has fallen this year while shares and commodities have risen.
This is unusual in the absence of a local domestic crisis (for example, the 1986 ‘banana republic’ crisis, or 1992-3 banking crisis).
The main reason is interest rates. The US Fed has lifted cash rates earlier and higher than the RBA here. Since the start of the share rally in October 2022, short-term rates have been more than 1% higher in the US than here. What does this have to do with exchange rates?
Interest rate differentials are a major driver of exchange rates
Since the float of the AUD in 1983, there has been a strong correlation between the USD/AUD exchange rate and the difference between short-term interest rates in the US and Australia (the interest rate 'differential').
When interest rates are higher in Australia than the US, US investors sell US dollars and buy Aussie dollars to get the higher interest rates here (the ‘carry trade’). This raises the AUD relative to the USD.
Conversely, when interest rates are higher in the US than in Australia, investors sell AUD and buy USD to get the higher interest rates there.
For almost all of the period since the 1983 float of the AUD, Australia has had higher short-term rates than the US, because inflation here has been higher. (On average, Australian cash rates have been 2.3% higher here than US cash rates).
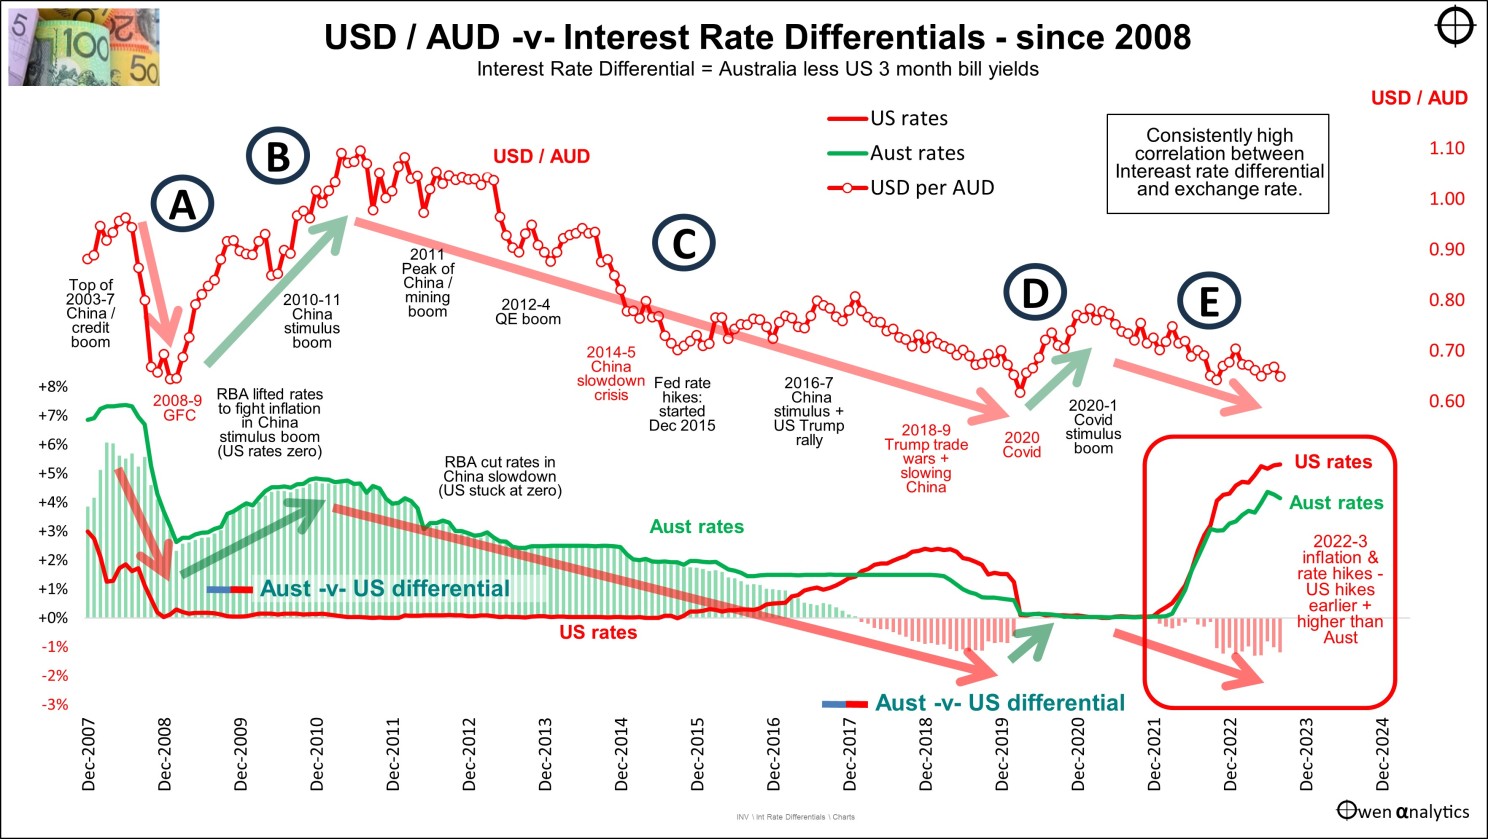
Interest rate differentials - Australia v US since 2007
The lower section shows Australian 3-month rates (green line), US 3-month rates (red line), and the difference between the two (positive green bars when Australian rates are higher, negative red bars when US rates are higher).
The large red/green arrows show how the exchange rate essentially travels in parallel with interest rate differentials.
There have been four main phases of this relationship since 2007. Starting from the left of the chart –
- A - both (USD/AUD and interest rate differentials) fell heavily in the 2008-9 GFC, because the RBA cut rates further than the US Fed.
- B – both rose strongly during the 2010-11 China stimulus boom. The RBA raised rates but US retained zero rates.
- C - then both fell from 2012 through the 2012-14 QE boom, the 2014-5 China slowdown scare, the 2018 US rate hike recession scare, and 2018 China slowdown, through to the 2020 Covid scare.
- D - The AUD rose in the Covid rebound, while the interest rate differential rose from negative back to zero (rates were zero in both countries).
- E - Both fell in 2022-3 as the US hiked rates earlier and further than the RBA, sending the interest rate differential negative once again, and sending the AUD down.
Current position and outlook
Although inflation rates (headline, core, and running rates) are higher in Australia, US rates cash rates are higher, and that is likely remain the case in the near future. This should keep the AUD weak, even if share markets continue to rise, which would ordinarily carry the AUD higher with it.
What lies ahead...
The idea of ‘sticky inflation’ gathers pace – especially as it relates to weak productivity growth. How are they related?
The recent surge in inflation triggered wage claims everywhere, especially with jobless rates at multi-decade lows.
The problem is that increasing wages to cover higher prices, without increasing productivity or output, is inflationary and does not raise real living standards, it just pushes prices even higher.
On the other hand, productivity gains are what raises real incomes and living standards. Hence the debate has now turned to the real driver of growth and prosperity – productivity.
Labour productivity growth has stalled across the world over the past decade – but why? We’ve had an almighty tech boom, but technology is supposed to improve productivity. Why hasn’t it done so this time? (hint: cat videos!)
Is ‘generative A.I.’ going to be the ‘next big thing’ that boosts productivity - like the steam engine, or electricity, or the motor car, or personal computers, or the internet, in previous eras?
Or is it just the next bubble, like tulips, 'dot-coms', crypto’s, NFTs, ‘Peletons’, or ‘We-Works’?
Australia
In August we also had the release of the latest Intergenerational Report from the federal government. It paints a very depressing picture of the future – virtually nil productivity growth (stalling living standards), low overall economic growth, an older/sicker population where the costs of aged/sickness care rise at much higher rates than revenues. All paid for by higher taxes on a diminishing proportion of workers, and rising debts paid for by future workers/taxpayers.
In Australia, two thirds of our overall economic growth over the past century has come from population growth, and only one third from productivity growth – hence our never-ending housing boom, with only minor hiccups.
In the US it is the opposite – two thirds of their overall economic growth has come from productivity growth, and one third from population growth.
Economic growth based primarily on population growth does not increase living standards, it just means more people pushing up prices (goods & services inflation, plus house prices), and clogging up our roads, trains, hospitals, etc.
Housing
While there is silence from the media and government about policy reform required to kick-start productivity growth, there is plenty of noise over housing policy.
Australian house prices continue to edge higher again this year, but prices are still below their post-Covid peaks. Although mortgage stress is on the rise, as interest rate hikes and refinances of honeymoon rates increase While there is silence from the media and government about policy reform required to kick-start productivity growth, there is plenty of noise over housing policy.
Australian house prices continue to edge higher again this year, but prices are still below their post-Covid peaks. Although mortgage stress is on the rise, as interest rate hikes and refinances of honeymoon rates increase repayments, prices are being supported by rising wages, supply constraints (NIMBY’s, local councils, state governments), and strong population growth (mainly immigration).
Meanwhile, landlords are increasing rents to pay for higher interest costs (and because supply is tight, they can!). Hopefully the debate is swinging away from populist quick-fixes (rent controls, and even more taxpayer-funded handouts to buyers), and more toward longer-term solutions – freeing up more supply. Not in outer suburban wastelands, but allowing higher density (medium and high-rise) in inner-middle suburbs.
What do investors do about these changing patterns of productivity, population, and housing? We will cover these issues in future editions!
‘Till next time – happy investing!
Thank you for your time and support - please send me feedback and/or ideas for future editions!